ABSTRACT
GHOBAD, LADAN. Analysis of Daylighting Performance and Energy Savings in Roof
Daylighting Systems. (Under the direction of Dr. Wayne Place).
An investigation has been made of potential lighting electricity reductions and associated
thermal impacts of replacing electric light with daylight admitted through rooftop glazing.
Horizontal apertures on flat roof (skylights) and vertical apertures facing in two opposite
directions (roof monitors) are examined in a prototype office building. A computer
simulation tool that integrates lighting simulation (RADIANCE) and energy simulation
(EnergyPlus), DIVA-for-Rhino has been used. Lighting simulation determines the fraction of
the solar radiation entering the aperture that reaches the work plane as useful illumination;
whole-building energy simulation predicts reductions in lighting electricity and the impact on
energy consumption for heating and cooling the building. Building operation costs are
calculated as a function of aperture to floor area so that the optimum roof daylighting design
could be identified. The results indicate that rooftop glazing contribute to savings in building
operation if a modest amount of glazing is used in the roof. In some climates either heating or
cooling energy is more sensitive to increasing the area of glazing, but the potential cost
benefits of daylighting are larger when an optimum aperture area is used. The design
implications of the results are discussed and important parameters that influence the rooflit
© Copyright 2012 by Ladan Ghobad
Analysis of Daylighting Performance and Energy Savings in Roof Daylighting Systems
by
Ladan Ghobad
A dissertation submitted to the Graduate Faculty of
North Carolina State University
in partial fulfillment of the
requirements for the degree of
Doctor of Philosophy
Design
Raleigh, North Carolina
2013
APPROVED BY:
_______________________________
______________________________
Dr. Wayne Place
Dr. Jianxin Hu
Committee Chair
________________________________
________________________________
DEDICATION
BIOGRAPHY
Ladan Ghobad joined the Daylighting and Building Energy Research Program at the North
Carolina State University (NCSU) at 2009 after nine years of education and professional
work in the field of Architecture. She received her Bachelor’s and Master’s Degree in
Architecture from the Islamic Azad University of Tehran and the Shahid Beheshti
ACKNOWLEDGMENTS
I give my deepest appreciation to Dr. Wayne Place, my dissertation committee chair, for his
outstanding guidance, constant support and endless patience throughout my doctorate
program. Dr. Place has been an exceptional committee chair and a valued mentor, whose
advice and consultation contributed tremendously to my personal growth in teaching as well
as research. I would like to thank my committee, Dr. Jianxin Hu, Dr. Soolyeon Cho, and Dr.
Stephen Terry for their assistance and support to advance my dissertation.
Special thanks to Christoph Reinhart and Alstan Jakubiec, who developed DIVA-for-Rhino
simulation tool and have been enormously helpful with the queries related to my research
method. Thanks to Jan Wienold, developer of Evalglare simulation tool, for his assistance in
application of this incredible software. Thanks to Rob Guglielmetti, who advanced the use of
RADIANCE lighting simulation in NREL’s OpenStudio tool, for being extremely supportive
and providing technical assistance about this tool.
I would like to express my gratitude to Marvin Malecha, Dean of the College of Design, and
Art Rice, Director of the Ph.D. program, for their financial and professional support to Ph.D.
students.
TABLE OF CONTENTS
LIST OF TABLES ... viii
LIST OF FIGURES ... x
CHAPTER 1: INTRODUCTION ... 1
1.1.PROBLEM AREA ... 1
1.2.RESEARCH GOALS ... 3
CHAPTER 2: REVIEW OF THE LITERATURE ... 4
2.1.ROOF DAYLIGHTING SYSTEMS: STATE OF THE ART ... 4
2.1.1.Definition of Roof-Daylighting Systems ... 4
2.1.2.Case Studies of Roof-Daylighting Systems ... 7
2.1.3.Daylighting Systems Performance ... 14
2.1.3.1.Daylight Quantity ... 15
2.1.3.2.Daylight Quality and Visual Comfort ... 16
2.1.3.3.Thermal Comfort ... 18
2.1.3.4.Energy Efficiency ... 18
2.1.4. Daylighting Performance Metrics ... 18
2.1.4.1.Daylight Quantity ... 19
Illuminance, Daylight Factor, Daylight Autonomy (DA), Useful Daylight Illuminance (UDI) 2.1.4.2.Daylight Quality and Visual Comfort ... 20
Luminance (L), Luminance Ratio, Vertical-To-Horizontal (VH) Illuminance Ratio, Cubic Illumination, Daylight Glare Index (DGI), Daylight Glare Probability (DGP) 2.1.4.3.Energy Efficiency ... 22
Energy Use Intensity, Building Operation Costs 2.1.4.4.Thermal Comfort ... 23
Mean Air Temperature (Ta), Mean Radiant Temperature (Tr), Operative Temperature, Predicted Mean Vote (PMV) and Predicted Percentage of Dissatisfied (PPD) 2.1.5.Roof-Daylighting Systems Performance ... 26
2.2.BUILDING SIMULATION METHODOLOGIES ... 29
2.2.1.Lighting Simulation ... 29
2.2.1.1.Lighting Simulation Algorithms ... 30
Split-Flux, Radiosity, Light-Backward Raytracing 2.2.1.2.Lighting Simulation Types ... 35
Point-In-Time Simulation, Interpolated Design Day, Daylight Coefficient (DC) Approach 2.2.1.3.Electric Lighting Control System Modeling ... 36
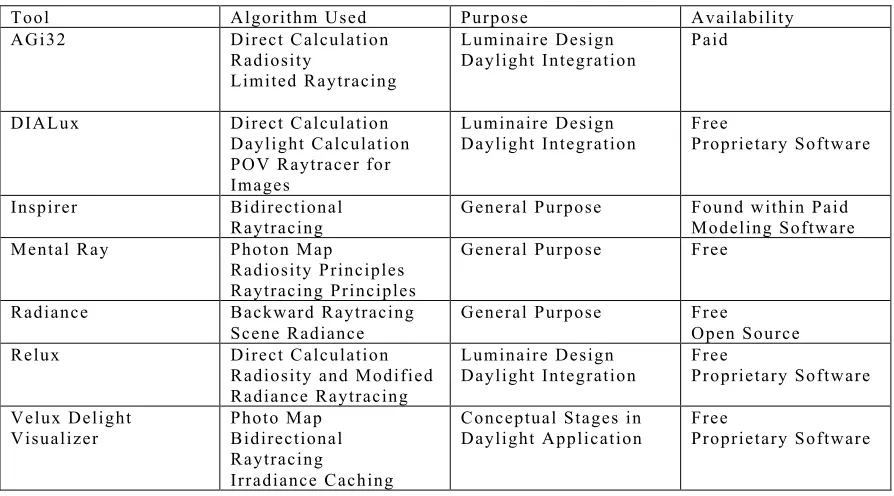
2.2.1.4.Lighting Simulation Tools ... 37
2.2.1.5.Accuracy Validations ... 39
2.2.2.Energy Simulation ... 40
2.2.2.1.Energy Simulation Tools ... 40
2.2.2.3.Simulation Tools Specific To Roof-Daylighting Systems ... 46
Skycalc, THERM/WINDOW 2.2.3.Thermal Comfort Models ... 50
2.2.3.1.Fanger Comfort Model ... 50
2.2.3.2.Two-Node Model ... 50
2.2.3.3.Adaptive Comfort Models (ASHRAE 55) ... 51
2.2.3.4.Graphic Comfort Zone Method ... 52
2.3.COMPARISON AND CONCLUSIONS ... 53
CHAPTER 3: CONCEPTUAL FRAMEWORK AND RESEARCH QUESTION ... 55
3.1. CONCEPTUAL FRAMEWORK ... 55
3.2. RESEARCH OBJECTIVES AND RESEARCH QUESTIONS ... 58
CHAPTER 4: METHODOLOGY ... 62
4.1.RESEARCH DESIGN ... 62
4.1.1.Independent Variables ... 62
4.1.2.Dependent Variables ... 63
4.1.2.1.Daylighting Assessment ... 63
4.1.2.2.Whole-building Energy Assessment ... 64
4.1.2.3.Total Operation Costs in Toplit Spaces ... 64
4.1.3.Building Parameters and Baseline Settings ... 64
4.1.3.1.Horizontal Apertures (Skylights) ... 65
4.1.3.2.Vertical Roof Apertures in Two Opposite Directions (Roof Monitors) ... 71
4.2.RESEARCH METHOD ... 82
4.2.1.Daylight Simulation Inputs ... 82
4.2.1.1.Simulation Time ... 82
4.2.1.2.Sensor Locations ... 83
4.2.1.3.Electric Lighting Control ... 84
4.2.1.4.Radiance Parameters ... 85
4.2.2.Whole- building Energy Simulation Inputs ... 91
4.2.2.1.Thermal Zone ... 92
4.2.2.2.Internal Loads ... 92
People, Interior Lights, and Electric Equipment 4.2.2.3.Air Circulation ... 93
4.2.2.4.HVAC System ... 94
Cooling System Design, Heating System Design, Ventilation Loads And Required Air Conditioning 4.2.2.5. HVAC Operation Controls ... 100
Operation Schedules, Temperature and Humidity Control, and Setpoint Managers 4.2.3.Glare Analysis Inputs ... 101
4.2.3.1. Location of Glare Assessment ... 102
4.2.3.2. Time and Weather Condition ... 103
4.2.3.3. Radiance Parameters ... 103
4.2.3.4. Material Properties ... 104
4.3.RESEARCH QUALITY ... 104
4.3.1.1. Physical Models ... 107
4.3.1.2. Settings ... 108
4.3.1.3. Equipment ... 109
4.3.1.4. Procedure ... 110
4.3.1.5. Data analysis and results ... 111
4.3.1.6. Conclusions and Discussion ... 115
4.3.2.Buidling Load Calculations with Cooling Load Temperature Difference (CLTD) 117 4.3.2.1. Cooling Load Temperature Difference (CLTD) Method ... 117
4.3.2.2. Calculations for the Research Models ... 120
4.3.3.Conclusions and Discussion ... 126
CHAPTER 5: RESEARCH FINDINGS AND CONCLUSIONS ... 127
5.1.LIGHTING ASSESSMENT ... 127
5.1.1.Point-in-Time Daylighting Simulation Outputs ... 127
5.1.1.1.Horizontal Apertures ... 127
5.1.1.2.Vertical Apertures ... 133
5.1.2.Electric Lighting Energy Use ... 139
5.1.2.1.Horizontal Apertures ... 139
5.1.2.2.Vertical Apertures ... 142
5.1.3. Glare Analysis ... 145
5.1.3.1.Horizontal Apertures ... 145
5.1.3.2.Vertical Apertures ... 148
5.2.WHOLE-BUILDING ENERGY ASSESSMENT ... 151
5.2.1. Thermal Comfort ... 151
5.2.1.1.Horizontal Apertures ... 152
5.2.1.2.Vertical Apertures ... 154
5.2.2.Heating and Cooling Energy Consumption ... 155
5.2.2.1.Horizontal Apertures ... 156
5.2.2.2.Vertical Apertures ... 160
5.2.3.Energy Use Intensity ... 167
5.2.3.1.Horizontal Apertures ... 167
5.2.3.2.Vertical Apertures ... 169
5.3.BUILDING OPERATION COSTS ... 173
5.3.1.Horizontal Apertures ... 173
5.3.2.Vertical Apertures ... 177
5.4.CONCLUSIONS AND DISCUSSION ... 180
LIST OF TABLES
CHAPTER 2
Table 1 Case studies of roof daylighting systems ... 8
Table 2 Summary table of current lighting simulation tools ... 38
Table 3 Comparison of Openstudio and Diva, two integrated simulation tools for daylighting and energy analysis ... 43
CHAPTER 4 Table 1 Vertical dimensions of models ... 66
Table 2 Key dimensions of models ... 69
Table 3 Effect of frames and curbs on overall U-values of the glazing ... 70
Table 4 Properties of roof insulation layer ... 70
Table 5 Glazing dimensions in single and double roof monitors with various AFRs ... 80
Table 6 Vertical dimension of roof components ... 80
Table 7 U-value of roof monitor assemblies ... 81
Table 8 Summary of vertical dimensions in models ... 81
Table 9 Illuminance results from testing various Radiance parameters for skylight models ... 87
Table 10 Illuminance results from testing various Radiance parameters for roof monitors models ... 88
Table 11 Minimum distances between sample points in four sets of Radiance parameters ... 90
Table 12 Internal loads generated by interior lights ... 93
Table 13 Internal loads generated by occupants ... 93
Table 14 Internal loads generated by Electric Equipment ... 93
Table 15 Outdoor air requirement calculation for thermal zone ... 93
Table 16 Cooling system requirements for Boston, MA ... 96
Table 17 Cooling system requirements for Miami, FL ... 97
Table 18 Peak cooling loads calculation in Boston and Miami ... 97
Table 19 Ventilation requirements in Boston and Miami ... 97
Table 20 Heating peak load calculation ... 98
Table 21 Humidifier Capacity ... 99
Table 22 Humidifier Power ... 99
Table 23 HVAC Operation Schedule ... 100
Table 24 Fan Availability Schedule ... 100
Table 25 Heating and cooling setback and setpoints ... 100
Table 26 Humidifier schedule ... 101
Table 27 Humidification and dehumidification setpoints ... 101
Table 28 Radiance Parameters for Glare Anlaysis ... 103
Table 29 Example of results from the physical experiment ... 112
Table 30 Boston climate data ... 121
Table 31 Miami climate data ... 121
Table 32 CLTD Method for base case in Boston ... 122
Table 33 Summarized CLTD Method for base case in Miami ... 123
in Miami ... 125 Table 36 Peak Heating load calculations for skylights with 5.5% AFR in Boston ... 125 Table 37 Peak Heating load calculations for skylights with 5.5% AFR in Miami ... 126 CHAPTER 5
Table 1 Average daylight illuminance in square and linear skylights with various
aperture sizes ... 132 Table 2 Average daylight illuminance in square and linear skylights with various
LIST OF FIGURES
CHAPTER 2
Figure 1 CIBSE Rooflights Typology ... 1
Figure 2 Well efficiency as a function of WCR (Well Cavity Ratio) ... 7
Figure 3 Cubic Illumination ... 21
Figure 4 Subjective visual sensations of DGP ranges ... 22
Figure 5 Acceptable ranges of operative temperature and air speed for the comfort zone ... 25
Figure 6 Graphic Comfort Zone Method in ASHRAE 55-2010 ... 52
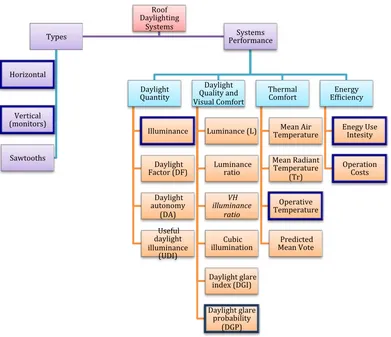
CHAPTER 3 Figure 1 Research framework in terms of roof daylighting systems types and performance ... 55
Figure 2 Research framework in terms of building simulation methodology ... 57
CHAPTER 4 Figure 1 Floor plans in (A) square skylights (B) linear skylights ... 66
Figure 2(A) Un-integrated roof design with squared-off light-wells ... 68
Figure 2(B) Integrated roof design with splayed light-wells ... 68
Figure 2(C) Integrated roofs with extended splayed light-wells ... 68
Figure 3(A) Two sectional views of Monitor-SingleNSglass-24”Lightwell-30’Span-20%SFR 75
Figure 3(B) Two sectional views of Monitor-SingleNSglass-36”Lightwell-60’Span-20%SFR 76
Figure 3(C) Two sectional views of Monitor-DoubleNSglass-24”Lightwell-30’Span-20%SFR 77 Figure 3(D) Two sectional views of Monitor-DoubleNSglass-36”Lightwell-60’Span-20%SFR 78
Figure 3(E) Two sectional views of Monitor-DoubleNSglass-17”Lightwell-30’Span-20%SFR 79
Figure 4 Floor plans of (A) single roof monitors (B) double roof monitors ... 80
Figure 5 Location of sensors at (A) Square skylights (B) linear skylights (C) Single roof monitors, and (D) double roof monitors ... 84
Figure 6 Power output curve of the continuous dimming lighitng control used for DAYSIM schedule ... 85
Figure 7 Comparison of Illuminance Levels with two Sets of Parameters in square skylights .. 88
Figure 8 Comparison of illuminance levels with four sets of parameters in single monitors ... 89
Figure 9 Comparison of illuminance levels with four sets of parameters in double monitors .... 89
Figure 10 HVAC System air loop ... 94
Figure 11 Psychrometric Chart ... 96
Figure 12 Floor plans of physical models with 2 and 3 linear apertures. The red line shows five axes, on which illuminance is measured by the sensors (series 1 to 5). ... 106
Figure 13 Sections of the physical models with two and three linear apertures ... 107
Figure 14 Physical model with four linear apertures in the experiment; the surface of the roof is larger than the floor to obstruct unwanted light from the corners ... 107
Figure 15 Experimental equipment and settings ... 110
Figure 16 Experimental equipment and settings ... 110
Figure 17 Interior of the models; the model is moved in a way that sensors collect data in various points along the model’s length ... 111
Figure 19 Illuminance levels in the simulated models with 5.5% AFR, 54% transmissivity in the middle axis: (A) 2x2 square-localized apertures (skylights), (B) 3x3 square-localized apertures (skylights) ... 113 Figure 20 Illuminance levels in the physical models with 10% AFR and sunshades: A) 2 linear apertures, B) 3 linear apertures ... 114 Figure 21 Illuminance levels in the simulated models with 5.5% AFR, 54% transmissivity in the middle axis of the model, horizontal axis shows number of sensors in the space and vertical axis shows illuminance (lx): (A) 2 linear apertures, (B) 3 linear apertures ... 115 CHAPTER 5
Figure 1 Location of sensors at square skylights ... 128 Figure 2 Illuminance distribution [lux] in square skylights with 5.5% AFR in Boston ... 129 Figure 3 Illuminance distribution [lux] in square skylights with 5.5% AFR in Miami ... 129 Figure 4 Average luminance in skylights with different light-well shapes in Boston
and Miami ... 131 Figure 5 Illuminance variations in skylights with different light-well shapes in
Boston and Miami ... 131 Figure 6 Square skylights illuminance distribution on diagonal axis at task level in
Boston and Miami ... 132 Figure 7 Linear skylights illuminance distribution on middle axis in north-south
direction at task level in Boston and Miami ... 133 Figure 8 Location of sensors at (A) Single roof monitors, (B) double roof monitors ... 134 Figure 9 Illuminance distribution [lux] in single roof monitors with 20% AFR in
Boston and Miami ... 134 Figure 10 (A) Illuminance distribution [lux] in double roof monitors with 20%
AFR in Boston ... 135 Figure 10 (B) Illuminance distribution [lux] in double roof monitors with 20%
AFR in Boston and Miami ... 135 Figure 11 Average illuminance in single and double roof monitors with 20%
AFR in Boston and Miami ... 137 Figure 12 Illuminance Variation in single and double roof monitors with 20%
AFR in Boston and Miami ... 138 Figure 13 Illuminance distributions for single monitors with various AFRs in
Boston and Miami ... 139 Figure 14 Illuminance distributions for double monitors with various AFRs in
Boston and Miami ... 139 Figure 15 Daily average lighting electricity use [kwh] in square skylights with
5.5% AFR in Boston ... 140 Figure 16 Daily average lighting electricity consumption for skylights with
various AFRs per month [kWh] in Boston ... 141 Figure 17 Daily average lighting electric consumption of skylights with
various AFRs per month [kWh] in Miami ... 142 Figure 18 Daily average electric lighting Use per Month [kWh] in Boston for
double and single monitors ... 143 Figure 19 Daily average electric lighting Use per Month [kWh] in Miami for
A) South-Facing Surfaces [Btu/sqft], B) North-Facing Surfaces [Btu/sqft] ... 144 Figure 21 Glare in skylights with un-integrated systems and squared-off
light-wells with 5.5% AFR at noon June 21, Boston ... 145 Figure 22 Annual Glare for skylights with un-integrated systems and squared-off
light-wells with 5.5% AFR, Boston ... 146 Figure 23 Glare in skylights with integrated systems and beveled light-wells with
5.5% AFR at noon June 21, Boston ... 147 Figure 24 Annual Glare for skylights with integrated systems and beveled
light-wells with 5.5% AFR, Boston ... 147 Figure 25 Glare in single roof monitors with 25% AFR at noon September 21, Boston ... 148 Figure 26 Annual Glare for Single roof monitors with 25% AFR, Boston ... 149 Figure 27 Glare in single roof monitors with 25% AFR and baffles at noon
September 21, Boston ... 149 Figure 28 Glare in single roof monitors with 25% AFR and banners at noon
September 21, Boston ... 150 Figure 29 Illuminance distribution in single monitor with 25% AFR, in Boston
in Sept 21, 12pm on Middle North-South Axis in the space, 25 sensors are
located at task surface ... 151 Figure 30 Monthly average outdoor day bulb temperatures in Boston and Miami
and zone dry bulb setpoint temperature in occupied hours ... 152 Figure 31 Annual hourly operative temperatures and relative humidity in the
thermal zone designed with skylights in Boston and Miami ... 153 Figure 32 Annual hourly operative temperatures and relative humidity in the
thermal zone designed with a single roof monitor in Boston and Miami ... 154 Figure 33 Monthly Internal Heat Gains [kBtu/h] in the Base Case ... 155 Figure 34 Monthly heating coil gas consumption [kBtu] in square skylights,
Boston and Miami ... 157 Figure 35 Monthly cooling coil electricity [kBtu] in square skylights, Boston
and Miami ... 157 Figure 36 Monthly zone transmitted solar energy [kBtu] in square skylights with
various aperture areas, Boston ... 158 Figure 37 Monthly heating coil gas consumption [kBtu] in linear skylights,
Boston and Miami ... 159 Figure 38 Monthly cooling coil electricity consumption [kBtu] in linear skylights,
Boston and Miami ... 159 Figure 39 Monthly zone transmitted solar energy [kBtu] in linear skylights with
various aperture areas, Boston and Miami ... 160 Figure 40 Monthly heating coil gas consumption [kBtu] in single roof monitors,
Boston and Miami ... 161 Figure 41 Monthly cooling coil electricity [kBtu] in single roof monitors,
Boston and Miami ... 162 Figure 42 Monthly heating gas consumption [kBtu] in single and double roof
monitors in Boston ... 163 Figure 43 Zone transmitted Solar Energy [kWh] for Roof Monitors with 20%
AFR in Boston ... 163 Figure 44 Monthly cooling coil electric consumption [kBtu] in single and double
Figure 45 Monthly heating gas consumption [kBtu] in single roof monitors
with two different orientations in Boston and Miami ... 165
Figure 46 Monthly cooling coil electric consumption [kBtu] in single roof monitors with two different orientations in Boston and Miami ... 166
Figure 47 Monthly zone solar transmitted energy in single roof monitor facing north-south and east-west in Boston ... 166
Figure 48 EUI in the base case and the zones with square apertures in Boston ... 168
Figure 49 EUI in the base case and the zones with square apertures in Miami ... 168
Figure 50 EUI in the base case and the zones with linear apertures in Boston ... 169
Figure 51 EUI in the base case and the zones with linear apertures in Miami ... 169
Figure 52 EUI in the base case and the zone with single and double roof monitors in Boston . 170 Figure 53 EUI in the base case and the zone with single and double roof monitors in Miami .. 171
Figure 54 Summary of EUI in roof monitors with various AFRs in Boston and Miami ... 171
Figure 55 EUI in the zones with single and double roof monitors facing north-south and east-west in Boston ... 172
Figure 56 EUI in the zones with single and double roof monitors facing north-south and east-west in Miami ... 173
Figure 57 Operation cost in square skylights in Boston ... 174
Figure 58 Operation cost in square skylights in Miami ... 175
Figure 59 Operation cost in linear skylights in Boston ... 175
Figure 60 Operation cost in linear skylights in Miami ... 176
Figure 61 Building operation costs [$ per module of 900 sqft or 83.6 m2] in Boston and Miami for square and linear skylights ... 177
Figure 62 Operation cost in roof monitors in Boston ... 178
Figure 63 Operation cost in roof monitors in Miami ... 178
Figure 64 Building operation costs [$ per module of 900 sqft or 83.6 m2] in Boston and Miami for single and double roof monitors with different AFRs facing north-south ... 179
Figure 65 Building operation cost in vertical apertures with 20% AFR facing east and west ... 180
CHAPTER 1:
INTRODUCTION
1.1.
PROBLEM AREA
Daylighting is a crucial element in buildings design due to its psychological and physiological effects, and impact on energy consumption in buildings.
First, human beings need regular exposure to daylight to maintain health. By nature, people prefer rooms with natural light because they are dynamic, creating variability in both space and time. Natural light is also full-spectrum light that provides excellent color rendering. In addition to the sense of well being associated with natural light, there appears to be a correlation between daylight levels in a space and the productivity of the occupants of the space (Heschong Mahone Group, 2003). Moreover, daylighting can reduce energy use in buildings significantly. Buildings in America
consume about 39% of the primary energy use and 70% of the total electricity use (Department of Energy, 2010). Among all building types, commercial buildings are the major consumers of
electricity. In these buildings, approximately a quarter of the total energy is consumed for providing electric lighting (CBECS 2003). Approximately another three percent is consumed for cooling. Furthermore, buildings account for a substantial fraction of the peak electricity demand on U.S. utilities (ASHRAE). All of these issues can be beneficially affected by using daylight as a substitute for electric light to illuminate buildings. Daylighting buildings is attractive for several reasons:
• During most working hours, the solar illumination on a building is several times greater than the required amount to illuminate the interior, indicating that it would be possible to design solar apertures that provide enough illumination to offset most of the lighting electricity consumption.
• The luminous efficacy of sunlight is generally superior to that of commercially available electric lamps with acceptable color rendering, which means that daylight has the potential for reducing building cooling loads by replacing electric light of higher heat content. • Daylight is plentiful during the hot, clear, summer periods when many utilities experience
Roof daylighting systems in particular are an interesting daylighting technique, because:
• The potential impact is very large; on the order of 50% of the commercial building floor area in the United States is in single-story buildings or the top floor of multistory buildings (DOE/EIA 1983).
• The solar exposure is generally good for sprawling single-story buildings or for the top floor of multistory buildings.
• Roof apertures allow a choice of glazing orientation and tilt, which is crucial in using passive techniques to regulate the flow of sunlight into the building; i.e., in compensating for seasonal and diurnal variations in the direction and intensity of solar radiation.
• Roof apertures have both new and retrofit potential.
• The illuminance can be made highly uniform by using closely spaced apertures.
• The quality of lighting can be very high, since: 1) the source of light can be located up out of the primary field of view, thereby avoiding most of the visual discomfort associated with viewing the light source, and 2) diffusing glazing (or other optical treatments) can be used to disperse the light around the space, thereby avoiding the extreme contrast associated with allowing beam sunlight to impinge on the work surface.
However, toplighting has not been extensively used in commercial buildings in the United States because of concerns regarding its daylight and energy performance, liability for water leakage and concerns regarding the initial cost of the system (Lawrance & Roth, 2008). In addition, the energy payback potential is quite high.
One reason for having a limited market is that roof daylighting systems are improperly selected and designed, therefore, the benefits of electric lighting energy reduction are negated due to higher space conditioning requirements and lower visual quality of environment (Yoon, 2008).
Also, prevailing perceptions regarding the performance of roof daylighting systems are strongly influenced by failures of skylights, which are the most widely experienced roof daylighting systems. In addition, most topliting configurations other than skylights require special structural design, which becomes a major hindrance for market penetration in the cost-conscious building industry,
1.2.
RESEARCH GOALS
This study assesses the potential for reducing energy consumption in commercial buildings using simple roof apertures (e.g. skylights and roof monitors) constructed with current technology. The current research provides grounds for a guideline for designers to choose the appropriate
configuration of roof apertures. Research goals could be categorized into the following items: • Investigate the problems that have lowered the quality of lighting and energy performance of
current rooflighting systems and, as a consequence, reduced their market penetration. • Define a range of common or promising rooflighting configurations, including construction
details, structural sizing, and selective construction cost assessments, for a range of climates. • Simulate and evaluate the daylighting effectiveness for special configurations of rooflighting
systems.
• Simulate and evaluate the thermal performance of the special configurations of rooflighting systems.
• Estimate savings in energy consumption and building operation costs through application of the suggested roof daylighting systems
CHAPTER 2:
REVIEW OF THE LITERATURE
2.1. ROOF DAYLIGHTING SYSTEMS: STATE OF THE ART
2.1.1.
Definition of Roof-daylighting Systems
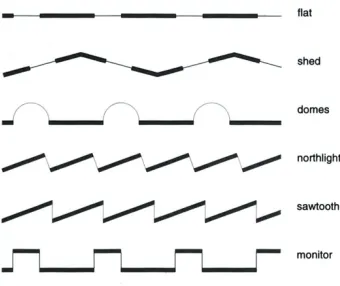
Roof daylighting, also referred to as toplighting, rooflighting and zenithal lighting, by definition is a strategy that permits daylight to enter a space from above, through a glazed opening in the roof that protects the interior from wind and weather (Phillips, 2004). Toplighting is differentiated from clerestories in the literature (Ander, 2003); clerestory is defined as vertical or near-vertical windows whose sill height is above eye level but below ceiling height, whereas, toplighting is defined as apertures located above the ceiling line. In other words, toplighting usually constitutes part of the roof of a building in contrast to clerestory windows, which are located in the upper part of the wall. A rooflighting system typology using nomenclature of the Chartered Institution of Building Services Engineers (CIBSE) is shown in figure 1. It includes: flat, shed, domes, north-light, sawtooth, and monitor.
Figure 1.CIBSERooflights Typology
The resulting illuminance on horizontal surfaces from the toplighting systems is greater than sidelights with the same opening surface area because of four reasons (Tregenza 2011, Place et al. 1886):
• Light is incident on the horizontal aperture at a favorable angle for admission through the aperture.
• The light admitted through the apertures is at a very favorable angle for illuminating the work plane below.
• The openings receive light from a larger area of sky.
• Overcast sky tends to be brightest at the zenith.
In addition, toplighting strategies can resolve many of the problems with light distribution resulted from sidelighting and depth of plan is no longer a limitation (Baker, 2002). It is obvious, however, that only single-story buildings or the top floors of multi-story buildings can be rooflit. Some other typical problems for rooms with rooflighting include (Tregenza, 2011):
• Poor illumination of vertical surfaces and therefore a general dark look of the room unless openings are planned to cast light on walls.
• High brightness contrast on the ceiling between the visible sky and the surrounding ceiling area since it is only illuminated by light reflections.
• Unwanted specular reflections of the sky in horizontal work surfaces in some occasions
Definition of terms:
this section includes some terms used in the literature related to roof daylighting systems and evaluation of their performance.Skylight to Floor Area Ratio (SFR)
Effective Aperture (EA)
EA is defined as the net transmittance of the roof. Effective aperture is product of the skylight-to-floor ration (SFR), the visible transmittance (Tv) and the well factor. Values of EA range from 0 to 1.0, with most practical skylights at less than 0.1 (Heshong Mahone Group 2003).
Effective Visual Transmittance (EVT)
EVT is defined as the ratio of the light transmitted through a daylighting system (skylight+ light well diffusers and etc.) to the light incident on the horizontal projection of the roof’s opening (McHugh et. Al 2004).
Well cavity ratio (WCR)
The well cavity ratio is determined by the geometry of the skylight well and shall be determined using either equation 1 or equation 2.
Equation 1: well cavity ratio for rectangular wells:
WCR = [5 x well height (well length + well width)]/ well length x well width (Equ1)
Equation 2 well cavity ratio for non-rectangular-shaped wells:
WCR= ( 2.5 x well height x well perimeter / well area) (Equ2)
Where the length, width, perimeter, and area are measured at the bottom of the well.
Well Efficiency
Figure 2 Well efficiency as a function of WCR (Well Cavity Ratio) (source: Heshong Mahone Group 2003)
2.1.2.
Case Studies of Roof-daylighting Systems
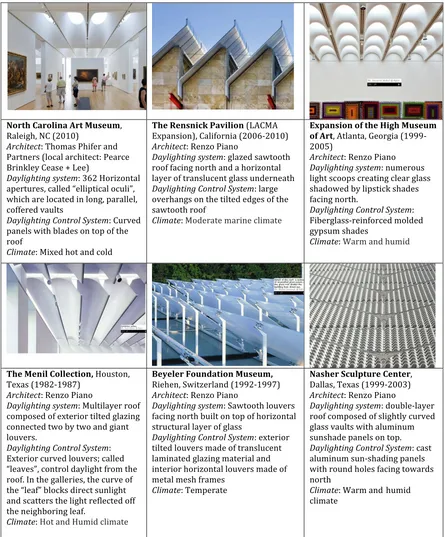
Table 1 Case studies of roof daylighting systems ! ! ! !"#$%&'(#")*+(&,#$&-./0.1"! #$%&'()"!*+!,-./.0! !"#$%&'#&1!2)34$5!6)'7&8!$9:! 6$8;9&85!,%3<$%!$8<)';&<;1!6&$8<&! =8'9>%&?!+&$5&!@!A&&0! ()*+%,$&%-,./*/&'01!BC-!D38'E39;$%! $F&8;G8&5"!<$%%&:!H&%%'F;'<$%!3<G%'I"! J)'<)!$8&!%3<$;&:!'9!%39("!F$8$%%&%"! <377&8&:!K$G%;5! ()*+%,$&%-,.12-&"2+.3*/&'01!+G8K&:! F$9&%5!J';)!L%$:&5!39!;3F!37!;)&! 8337! 1+%0)&'1!M'N&:!)3;!$9:!<3%:!! 2%0&30+/+*45&6(7*)*"+&,AO+MO! PNF$95'390"!+$%'7389'$!,-..CQ-./.0! !"#$%&'#&1!#&9E3!6'$93!! ()*+%,$&%-,./*/&'01!(%$E&:!5$J;33;)! 8337!7$<'9(!938;)!$9:!$!)38'E39;$%! %$?&8!37!;8$95%G<&9;!(%$55!G9:&89&$;)!! ()*+%,$&%-,.12-&"2+.3*/&'01!%$8(&! 3K&8)$9(5!39!;)&!;'%;&:!&:(&5!37!;)&! 5$J;33;)!8337!
1+%0)&'1!M3:&8$;&!4$8'9&!<%'4$;&!
89:(+/*"+&";&$%0&<*=%&-./0.1& ";&,#$"!O;%$9;$"!R&38('$!,/SSSQ -..T0! !"#$%&'#&1!#&9E3!6'$93! ()*+%,$&%-,./*/&'01!9G4&83G5! %'();!5<33F5!<8&$;'9(!<%&$8!(%$55! 5)$:3J&:!L?!%'F5;'<>!5)$:&5! 7$<'9(!938;)U! ()*+%,$&%-,.12-&"2+.3*/&'01! V'L&8(%$55Q8&'9738<&:!43%:&:! (?F5G4!5)$:&5!!
1+%0)&'1!W$84!$9:!)G4':!
! ! ! 2%0&-0+*)&'"))04$*"+>&D3G5;39"! 2&N$5!,/SX-Q/SXY0! !"#$%&'#&1!#&9E3!6'$93! ()*+%,$&%-,./*/&'01!MG%;'%$?&8!8337! <34F35&:!37!&N;&8'38!;'%;&:!(%$E'9(! <399&<;&:!;J3!L?!;J3!$9:!('$9;! %3GK&85U!! ()*+%,$&%-,.12-&"2+.3*/&'01! PN;&8'38!<G8K&:!%3GK&85Z!<$%%&:! H%&$K&5I"!<39;83%!:$?%'();!7834!;)&! 8337U![9!;)&!($%%&8'&5"!;)&!<G8K&!37! ;)&!H%&$7I!L%3<>5!:'8&<;!5G9%'();! $9:!5<$;;&85!;)&!%'();!8&7%&<;&:!377! ;)&!9&'()L38'9(!%&$7U!
1+%0)&'1!D3;!$9:!DG4':!<%'4$;&! ! ?0@0)0#&A".+B($*"+&-./0.1>& #'&)&9"!\J';E&8%$9:&,/SS-Q/SSY0& !"#$%&'#&1!#&9E3!6'$93! ()*+%,$&%-,./*/&'01!\$J;33;)!%3GK&85! 7$<'9(!938;)!LG'%;!39!;3F!37!)38'E39;$%! 5;8G<;G8$%!%$?&8!37!(%$55! ()*+%,$&%-,.12-&"2+.3*/&'01!&N;&8'38! ;'%;&:!%3GK&85!4$:&!37!;8$95%G<&9;! %$4'9$;&:!(%$E'9(!4$;&8'$%!$9:! '9;&8'38!)38'E39;$%!%3GK&85!4$:&!37! 4&;$%!4&5)!78$4&5!! 1+%0)&'1!2&4F&8$;&!! ! !(/%0#&C4.):$.#0&'0+$0#"! ]$%%$5"!2&N$5!,/SSSQ-..B0! !"#$%&'#&1!#&9E3!6'$93! ()*+%,$&%-,./*/&'01!:3GL%&Q%$?&8! 8337!<34F35&:!37!5%'();%?!<G8K&:! (%$55!K$G%;5!J';)!$%G4'9G4! 5G95)$:&!F$9&%5!39!;3FU!! ()*+%,$&%-,.12-&"2+.3*/&'01!<$5;! $%G4'9G4!5G9Q5)$:'9(!F$9&%5! J';)!83G9:!)3%&5!7$<'9(!;3J$8:5! 938;)!
1+%0)&'1!W$84!$9:
!
)G4':! <%'4$;&!Table 1 Continued
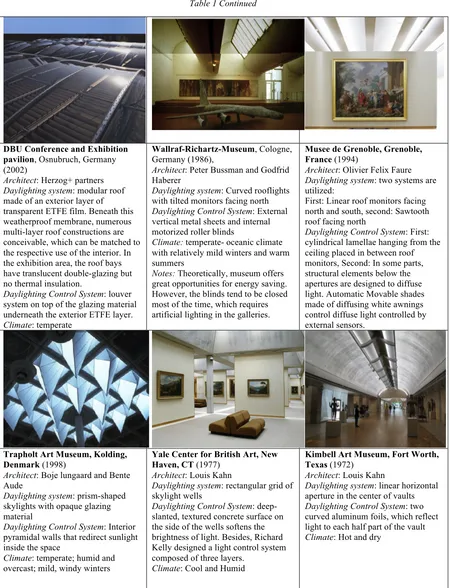
DBU Conference and Exhibition pavilion, Osnubruch, Germany (2002)
Architect: Herzog+ partners
Daylighting system: modular roof made of an exterior layer of transparent ETFE film. Beneath this weatherproof membrane, numerous multi-layer roof constructions are conceivable, which can be matched to the respective use of the interior. In the exhibition area, the roof bays have translucent double-glazing but no thermal insulation.
Daylighting Control System: louver system on top of the glazing material underneath the exterior ETFE layer.
Climate: temperate
Wallraf-Richartz-Museum, Cologne, Germany (1986),
Architect: Peter Bussman and Godfrid Haberer
Daylighting system: Curved rooflights with tilted monitors facing north
Daylighting Control System: External vertical metal sheets and internal motorized roller blinds
Climate: temperate- oceanic climate with relatively mild winters and warm summers
Notes: Theoretically, museum offers great opportunities for energy saving. However, the blinds tend to be closed most of the time, which requires artificial lighting in the galleries.
Musee de Grenoble, Grenoble, France (1994)
Architect: Olivier Felix Faure
Daylighting system: two systems are utilized:
First: Linear roof monitors facing north and south, second: Sawtooth roof facing north
Daylighting Control System: First: cylindrical lamellae hanging from the ceiling placed in between roof monitors, Second: In some parts, structural elements below the apertures are designed to diffuse light. Automatic Movable shades made of diffusing white awnings control diffuse light controlled by external sensors.
Trapholt Art Museum, Kolding, Denmark (1998)
Architect: Boje lungaard and Bente Aude
Daylighting system: prism-shaped skylights with opaque glazing material
Daylighting Control System: Interior pyramidal walls that redirect sunlight inside the space
Climate: temperate; humid and overcast; mild, windy winters
Yale Center for British Art, New Haven, CT (1977)
Architect: Louis Kahn
Daylighting system: rectangular grid of skylight wells
Daylighting Control System: deep-slanted, textured concrete surface on the side of the wells softens the brightness of light. Besides, Richard Kelly designed a light control system composed of three layers.
Climate: Cool and Humid
Kimbell Art Museum, Fort Worth, Texas (1972)
Architect: Louis Kahn
Daylighting system: linear horizontal aperture in the center of vaults
Daylighting Control System: two curved aluminum foils, which reflect light to each half part of the vault
Table 1 Continued
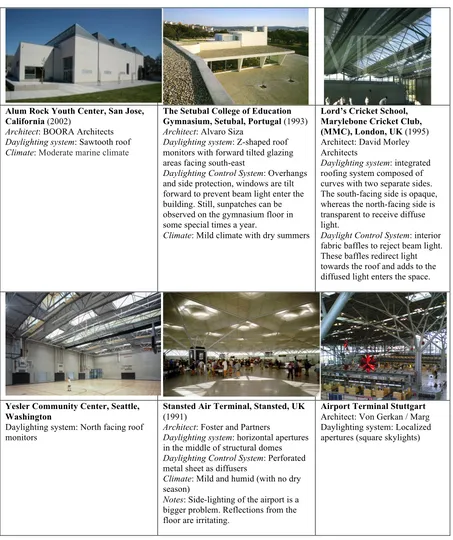
Alum Rock Youth Center, San Jose, California (2002)
Architect: BOORA Architects
Daylighting system: Sawtooth roof
Climate: Moderate marine climate
The Setubal College of Education Gymnasium, Setubal, Portugal (1993)
Architect: Alvaro Siza
Daylighting system: Z-shaped roof monitors with forward tilted glazing areas facing south-east
Daylighting Control System: Overhangs and side protection, windows are tilt forward to prevent beam light enter the building. Still, sunpatches can be observed on the gymnasium floor in some special times a year.
Climate: Mild climate with dry summers
Lord’s Cricket School, Marylebone Cricket Club, (MMC), London, UK (1995) Architect: David Morley Architects
Daylighting system: integrated roofing system composed of curves with two separate sides. The south-facing side is opaque, whereas the north-facing side is transparent to receive diffuse light.
Daylight Control System: interior fabric baffles to reject beam light. These baffles redirect light towards the roof and adds to the diffused light enters the space.
Yesler Community Center, Seattle, Washington
Daylighting system: North facing roof monitors
Stansted Air Terminal, Stansted, UK
(1991)
Architect: Foster and Partners
Daylighting system: horizontal apertures in the middle of structural domes
Daylighting Control System: Perforated metal sheet as diffusers
Climate: Mild and humid (with no dry season)
Notes: Side-lighting of the airport is a bigger problem. Reflections from the floor are irritating.
Airport Terminal Stuttgart
Table 1 Continued
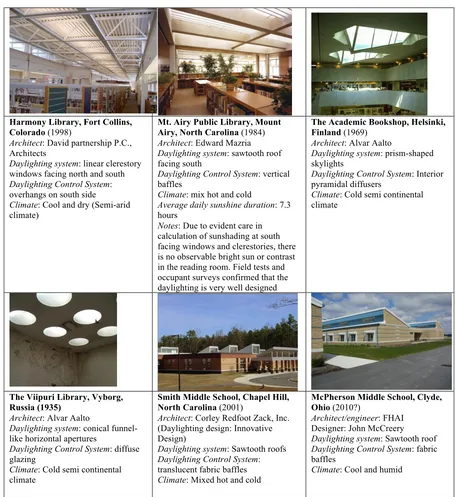
Harmony Library, Fort Collins, Colorado (1998)
Architect: David partnership P.C., Architects
Daylighting system: linear clerestory windows facing north and south
Daylighting Control System: overhangs on south side
Climate: Cool and dry (Semi-arid climate)
Mt. Airy Public Library, Mount Airy, North Carolina (1984)
Architect: Edward Mazria
Daylighting system: sawtooth roof facing south
Daylighting Control System: vertical baffles
Climate: mix hot and cold
Average daily sunshine duration: 7.3 hours
Notes: Due to evident care in calculation of sunshading at south facing windows and clerestories, there is no observable bright sun or contrast in the reading room. Field tests and occupant surveys confirmed that the daylighting is very well designed
The Academic Bookshop, Helsinki, Finland (1969)
Architect: Alvar Aalto
Daylighting system: prism-shaped skylights
Daylighting Control System: Interior pyramidal diffusers
Climate: Cold semi continental climate
The Viipuri Library, Vyborg, Russia (1935)
Architect: Alvar Aalto
Daylighting system: conical funnel-like horizontal apertures
Daylighting Control System: diffuse glazing
Climate: Cold semi continental climate
Smith Middle School, Chapel Hill, North Carolina (2001)
Architect: Corley Redfoot Zack, Inc. (Daylighting design: Innovative Design)
Daylighting system: Sawtooth roofs
Daylighting Control System: translucent fabric baffles
Climate: Mixed hot and cold
McPherson Middle School, Clyde, Ohio (2010?)
Architect/engineer: FHAI Designer: John McCreery
Daylighting system: Sawtooth roof
Daylighting Control System: fabric baffles
Table 1 Continued
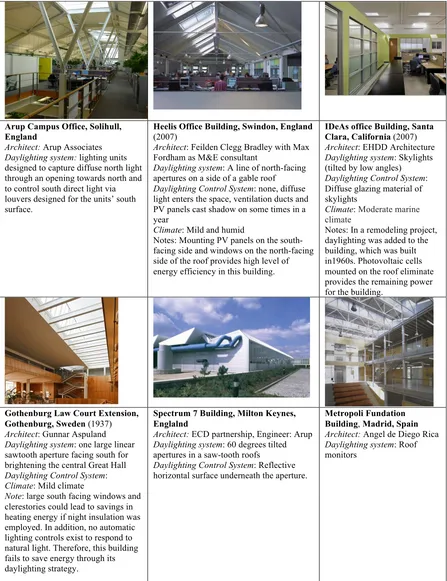
Arup Campus Office, Solihull, England
Architect: Arup Associates
Daylighting system: lighting units designed to capture diffuse north light through an opening towards north and to control south direct light via louvers designed for the units’ south surface.
Heelis Office Building, Swindon, England
(2007)
Architect: Feilden Clegg Bradley with Max Fordham as M&E consultant
Daylighting system: A line of north-facing apertures on a side of a gable roof
Daylighting Control System: none, diffuse light enters the space, ventilation ducts and PV panels cast shadow on some times in a year
Climate: Mild and humid
Notes: Mounting PV panels on the south-facing side and windows on the north-south-facing side of the roof provides high level of energy efficiency in this building.
IDeAs office Building, Santa Clara, California (2007)
Architect: EHDD Architecture
Daylighting system: Skylights (tilted by low angles)
Daylighting Control System: Diffuse glazing material of skylights
Climate: Moderate marine climate
Notes: In a remodeling project, daylighting was added to the building, which was built in1960s. Photovoltaic cells mounted on the roof eliminate provides the remaining power for the building.
Gothenburg Law Court Extension, Gothenburg, Sweden (1937)
Architect: Gunnar Aspuland
Daylighting system: one large linear sawtooth aperture facing south for brightening the central Great Hall
Daylighting Control System:
Climate: Mild climate
Note: large south facing windows and clerestories could lead to savings in heating energy if night insulation was employed. In addition, no automatic lighting controls exist to respond to natural light. Therefore, this building fails to save energy through its daylighting strategy.
Spectrum 7 Building, Milton Keynes, Englalnd
Architect: ECD partnership, Engineer: Arup
Daylighting system: 60 degrees tilted apertures in a saw-tooth roofs
Daylighting Control System: Reflective horizontal surface underneath the aperture.
Metropoli Fundation Building, Madrid, Spain
Architect: Angel de Diego Rica
Lessons Learned From Case Studies
Rooflighting has a long history in museums because of the aesthetic features of light in space. Not only museums, but also other buildings such as airports, terminals, and monumental buildings were designed with daylighting ideas to create a pleasant space for visitors. Case studies indicate that during the last decades, other building types such as schools, offices and retail stores have implemented daylighting ideas for energy saving reasons. In fact, the purpose of daylighting in building has changed from solely aesthetic reasons to comfort and energy conservation goals. However, museums are still avant-garde in the field of rooflighting systems design. Moreover, financial issues are crucial, differentiating some building types with national importance such as museums from other building types.
There is not a specific configuration of roof daylighting system associated with a specific building type. Some configurations are more energy efficient that others, therefore, they are more widely employed in buildings with concerns about building operation costs, such as offices.
Buildings could be categorized in terms of lighting based on their scale and type of use. Daylighting in buildings with high ceilings such as airports differ significantly from buildings with low ceilings such as office buildings. Length of occupants’ stay in the building, their visual task, and their choice of seats in a space are important factors in daylighting design. Subtle and even lighting is required in spaces such as offices, in which people stay for long hours. On the hand, direct light is appreciated in spaces with recreational or leisure purposes due to dynamic character that beam sunlight creates.
In sunny locations, the issue of daylighting control becomes more important than locations with overcast sky conditions. In high latitudes, there are specific problems for daylighting. In such locations, south-facing clerestories with appropriate overhangs are more appropriate than horizontal roof glazings. For such solar altitude angles, daylighting strategies such as using prisms to redirect light into the space are used. There is also a lot of shading from neighbors or other obstructions because of very low solar altitude angle in such locations.
components. Dust, condensation or surface deterioration quickly reduces optical efficiency, sometimes by more than 50%.
In roof daylighting systems, function of space is crucial in evaluation of performance of the system. Some spaces perform well with rather low levels of light or even with direct sunlight hitting surfaces. As an example, circulation spaces do not have high illuminance requirement. Even the daylighting systems that substantially reduce the available illumination provide satisfactory level of performance for such spaces.
Secondary daylit spaces illuminated by atria do not often perform well in terms of efficiency. The reason is associated with the low level of daylight redirected to the secondary daylit spaces. In general, atria are not efficient daylighting ideas despite being architecturally pleasing. In addition to atria, there are other examples of buffer spaces designed for daylighting purposes. In some daylit buildings, a large area of a building is only dedicated for equalizing direct sunlight. However, in contemporary architecture and particularly in commercial buildings in locations with high real estate market, even a square feet of space becomes so valuable that its allocation solely for daylighting purposes is no longer appreciated.
Nowadays, increasing use of computer monitors necessitates the issue of luminance control inside buildings. Rooms with lower illumination are more appreciated to perform computer tasks. As a consequence, the required illuminance has been reduced in office spaces as the visual task has transformed from paper-based work to computer-based work.
This section discussed the lessons learned from cases studies of roof daylighting including some issues related to performance of such design strategies. In the next section, performance of daylighting systems will be discussed in more details.
2.1.3.
Daylighting Systems Performance
Performance is a building criterion that stems from human needs. Building “performance” is divided into six categories (Hartkopf et al., 1986): visual performance, thermal performance, spatial
performance, indoor air quality, acoustical performance and building integrity.
thermal performance in buildings depends on four design factors and all four of these elements constituting our thermal environment contribute significantly to our sense of comfort; spatial
performance includes the design of individual spaces and their furnishing to provide the best support for the individual activity; indoor air quality is defined by providing fresh air, fresh air movement and distribution in a space; acoustical performance is related to Sound Sources, Sound Paths and Sound Receiver and building integrity corresponds to building loads, moisture, temperature, air movement, radiation and light, chemical attack, biological attack, fire, natural disaster and man-made disaster (Hartkopf et al. 1986).
Each of these performance mandates is defined by physiological, psychological, sociological, and economic needs or design limits of acceptability. The first five mandates relates to interior occupants of a building (human, animal, plant, and artifact occupancies) and health, safety and well-being of them in relation to spatial quality, thermal, air, acoustical and visual quality.
The last item, building integrity, relates to the building itself and concerns physical protection of the building’s appearance and its durability against moisture, temperature, air movement, radiation, chemical and biological attack and environmental disaster such as fire, flood, and earthquake. Performance evaluation of a daylighting system is defined based on definition of a properly designed daylit space. A daylit space is defined as “a space that is primary lit with natural light and that combines a high occupant satisfaction with the visual and thermal environment with low overall energy use for lighting, heating and cooling (Reinhart, 2010)”. This definition highlights importance of visual and thermal performance in evaluation of daylighting systems.
Studying visual performance includes both quantity and quality of daylight. In addition to thermal comfort, which is the main goal in evaluation of thermal performance in buildings, energy-efficiency should be considered. Providing comfort with excessive use of energy is unreasonable and unjustified in the current era. In this section, daylight quantity, daylight quality, thermal comfort and energy efficiency will be explained as four main components for performance evaluation of daylighting design.
2.1.3.1. Daylight Quantity
The first goal in daylighting is to provide adequate quantities of natural light on task surfaces within the space. Contrast sensitivity of the eye, visual acuity and visual performance are important
stimulus-response relationship and when the three items provided together, a good measure of the efficiency of the visual process will be achieved (Szokolay, 2008).
Contrast sensitivity of the eye is a characteristic of the eye, which is very good in good lighting. In full daylight a luminance difference between surfaces as little as 1% can be distinguished but under poor lighting conditions surfaces with up to 10% luminance difference may be perceived as equal. In other words, light levels should be enough to distinguish luminance differences.
Visual acuity, or sharpness of vision depends on illuminance. Acuity is measured by the smallest detail perceived, expressed as the reciprocal of the visual angle subtended at the eye by opposite extremes of the least perceptible detail.
Visual performance is a function of time required to see an object, or of the number of items
perceived in unit time. The time required to perform a certain visual task decreases with the increase of illuminance.
2.1.3.2. Daylight Quality and Visual Comfort
The second goal in daylighting design is to provide a visually comfortable space for all the common tasks to be performed (Baker, 2002). The concept of quality with respect to daylight is primarily concerned with the distribution of light at the point of interest. It is also concerned with the distribution of the brightness of surfaces not just those of the task or object of interest, but also the surrounding surfaces, the view of which contribute to a person’s overall perception of the space and satisfaction from it (Baker, 2002). The brightness of a surface is a product of the illuminance and reflectance of the surface.
Discovery of acceptable limits of discomfort glare has been a topic of research for many years. There is a widely consensus that discomfort glare is related to luminance distribution in the field of view of an observer rather than illuminance distribution at task surface.
Acceptable level of light variation in field of view has been a debatable issue in the history of daylighting research. Although low level of light variation in the filed view is required to perform a visual task, human beings appreciate brightness contrasts between surfaces. Occupants seem to be more interested in the visual diversity of their surroundings rather than monotonous built
environment. This raises an important issue in the discussion on contrast and temporal diversity in architecture.
In a study by Slater and Boyce (1990), participants were asked to rate the evenness of the lighting, its acceptability, and its comfort, in relation to various illuminance ratios across a desktop task. It was concluded that for tasks that are primarily in the center of the desk, illuminance ratios as low as 0.5 would be acceptable for most people (Slater and Boyce 1990, Veitch 2001). In a study conducted on the relationship between luminance diversity and the perceived quality of interior space (Steane and Steemers, 2004), "The more diverse the luminance in the field of view, the more 'pleasant', 'cheerful', 'bright', 'radiant', 'clear', 'visually warm', and 'strong' the space was reported to appear." In the same study, it was stated that subject desired to have diversity within their field of view and that was not related to inadequate illuminance levels. Although our codes and recommendations are concerned with task-based illuminance levels, occupants seem to be more interested in the visual diversity of their surroundings, establishing a need for new metrics that can quantify and place value in perceptual qualities.
Baker and Steemers (2002) indicate that daylight quality is influenced by both quantifiable and non-quantifiable parameters as perceived by the subjects based on a research carried out at the Martin Center, University of Cambridge. Subjects were willing to have non-uniformity in their surroundings but not so much between the average of their surroundings and their task. This variation could create visual interest as well as luminance variation.
Based on his observation, Cuttle concludes that illuminance differences lower than 1.5:1 are perceived as uniform lighting.
2.1.3.3. Thermal Comfort
The sensation of thermal comfort in a space depends on environmental factors: air temperature, mean radiant temperature, relative air velocity, and water vapor pressure in ambient air and physiological factors: skin temperature, core or internal temperature, sweat rate, skin wettedness, and thermal conductance between the core and skin (US DOE 2010). Providing thermal comfort is one of the key goals for daylighting design. Large glazing areas could result in large heat transfer via conductance and solar radiation.
2.1.3.4. Energy Efficiency
Energy efficiency is described as using less energy to produce the same amount of services or useful output. The third goal in daylighting is to reduce lighting electricity consumption and heating load from electric lights by switching off or dimming lights in response to the presence of daylight in a space. The purpose is to replace electric lighting by daylight without increasing heating and cooling loads in a building. In daylighting systems, excessive heat gains through the glazing area contribute to extra cooling energy consumption in cooling seasons. Furthermore, heat losses through the glazing and frames contribute to additional heating energy requirement in heating seasons. In a properly designed daylighting system, the advantages of reduced electric lighting due to daylighting overcome the disadvantages of increased conductive heat loss and increased solar heat gain through the glazing material.
In order to conduct accurate energy analysis in buildings, simulations based on hourly local weather data are required to estimate annual daylight availability and building energy use. Moreover, the effects that daylighting has on reducing electric lights and the associated internal heat gains should be accurately calculated.
2.1.4.
Daylighting Performance Metrics
2.1.4.1. Daylight Quantity
Illuminance (E)
Illuminance is the measure of illumination of a surface with the unit of lux (lx). One lux is the
illuminance caused by one lumen incident of one square meter area (Tregenza and Wilson 2011). The physiological limits of accessibility and codes for lighting design are determined by the capabilities of the human eye, given tasks of specific size and contrast. The Illuminating Engineering Society (IES) defines the recommended levels of illuminance for various spaces. Recommended or prescribed illuminance values depend on the visual task, occupants’ age, socio-cultural and economic factor (Szokolay, 2008). Illuminating Engineering Society of North America (IESNA) requires Illuminance level of 200 lux for incidental (secondary) use, 300 lux for general office use, 500-700 lux for task lighting, and 1000 to 1500 lux for highly specialized work such as sewing, color comprehension, or electronic assembly.
Daylight factor (DF)
Daylight factor is the ratio of the indoor illuminance at a point to the outdoor horizontal illuminance, measured under CIE overcast reference sky conditions. Since DF is evaluated under a fixed sky condition that does not change according to the building location or orientation, it is considered a static daylight metric (Reinhart, et. al. 2010).
Daylight autonomy (DA)
Daylight autonomy is defined as the ratio of the total number of hours in the year when the minimum design illuminance is provided by daylighting alone, to the total number of hours of occupancy in a year. As apposed to static daylight factor, daylight autonomy is a dynamic daylighting performance metric because it is derived from models of real sky conditions at each sampling interval throughout the year, rather than on a fixed CIE Overcast sky, which is used for the daylight factor (Reinhart, et. al. 2010). DA metric uses the target illuminance for a space according to IESNA requirements (IESNA 2000) to identify the required level of lighting in a space.
Useful daylight illuminance (UDI)
(100-2000lux), and UDI>2000lux (Reinhart et al., 2006). The upper bin (UDI>2000lux) represent times when an overflow of daylight might lead to visual and/or thermal discomfort in a space, the lower bin (UDI<100lux) characterizes times when there is ‘too little’ daylight available in a space and the intermediate bin (UDI100-2000lux) represents ‘useful’ daylight which provides sufficient
illumination and visual comfort in a space (Reinhart and Wienold, 2010).
2.1.4.2. Daylight Quality and Visual Comfort
Luminance (L)
Luminance is reflected and transmitted light of a material or task level in a given direction and it is measured in candela per square meter (cd/m!) in SI unit. The light leaving the surface can be due to reflection, transmission, and/or emission (Tregenza and Wilson 2011).
Luminance ratio
Some literature relate luminance ratio with human satisfaction with daylighting in luminous
environment. A general rule is that the luminance in a cone of 60° about the line of sight should not exceed three times or be less than one third of the luminance of the main visual task. The luminance in a cone of 120° should not exceed 10 times or be less than a tenth of the luminance of the main visual task (IESNA 2000, CIBSE 1994). In short, the luminance ratios recommended are 1:3:10 in “task: field of work: Environment” (Szokolay, 2008).
However, a universal criterion of good lighting probably does not exist, and even when considering a single region, it is hard to find an obvious rule that guarantees good quality of lighting (Tregenza, 2011).
Vertical-to-Horizontal (VH) illuminance ratio
In order to characterize daylighting in an environment, some researchers focused on
window. It was concluded that the VH ratio could provide information on the presence or absence of direct sun, glare, contrast, and the balance of daylight illumination in a space.
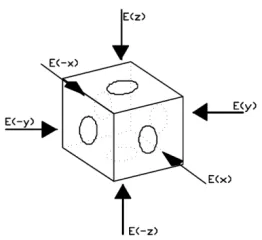
Cubic illumination
Cuttle did one of the first attempts to reach a three-dimensional daylight measurement by proposing the concept of Cubic Illumination (Cuttle 1997). Cubic illumination defines the spatial distribution of illumination about a point in terms of the illuminance on six faces of a small cube centered at a point (figure 3). Cubic illumination was used in Cuttle’s study for arithmetical calculation of two
components of light: vector and symmetric components, with the purpose of predicting the illuminance of a plane normal to the view direction at a point in space.
Figure 3. Cubic Illumination
Daylight glare index (DGI), Daylight glare probability (DGP)
DGI and DGP are metrics to measure discomfort Glare in a space by mathematical formula driven from studies on human subject. The difference between DGI and DGP is in accuracy of estimation of luminous intensity from a source of glare. Daylight glare index is an equation driven from
experiments with artificial glare sources under controlled simulated conditions rather than real sky conditions (Wienold and Christoffersen, 2006). Daylight glare probability (DGP) is a more recent metric proposed for measuring glare driven by laboratory studies in daylit spaces using seventy-two test subjects in Denmark and Germany (Wienold and Christoffersen, 2006).
DGP is defined by the following equation:
Ev : vertical eye illuminance Ls,i : luminance of source i
ωs,i : solid angle of source i
P: position index, a weighing function that varies with the distance of a glare source form the field of vision.
Wienold extended subjective studies to discover levels of acceptability of DGP (Wienold, 2009). Discomfort glare is divided into four ranges based on magnitude of glare and impairment of visual sense caused by glare. DGPs associated with subjective rating of glare were recorded and published in a graph (figure 4). The four categories include: imperceptible glare (DGP<35), perceptible glare (35<DGP<40), disturbing glare (40<DGP<45), and intolerable glare (DGP>45) (Reinhart and Wienold, 2010).
Figure 4 Subjective visual sensations of DGP ranges (Source: Reinhart and Wienold 2010)
2.1.4.3. Energy Efficiency
Technologies to harvest renewable energy such as solar energy and wind power reduce the overall use of fossil fuel in buildings. The goal is to design low-energy buildings to minimize the energy demand at first hand; to lessen the energy consumed to provide comfort condition for occupants, energy efficient buildings utilize highly efficient HVAC and lighting technologies. Net-zero energy buildings are examples of highly efficient buildings, whereby the amount of energy provided by on-site
Energy Use intensity (EUI)
Energy use intensity is a unit of measurement that represents energy use in buildings. EUI is the energy use per unit of floor area per year in units of [kBtu/ft2/yr] or [kWh/m2 /yr] and it is the most commonly accepted metric to measure a building’s absolute energy use performance (ASHRAE 2010). Judgement of energy efficiency of buildings is made based on comparison of EUI between similar types of buildings and reduction of EUI in a single building.
Building Operation Costs
Building operation costs is the sum of annual costs of energy for building operation in units of dollars. Operation costs could be also presented in each unit of floor area [dollars/ft2] or [dollars/m2].
2.1.4.4. Thermal Comfort
The physiological limits of acceptable thermal performance for human occupancy in building have been well established, and documented in ASHRAE (American Society of Heating, Refrigerating and Air conditioning Engineers) Standards, Thermal Environmental Conditions for Human Occupancy. This standard, in turn, has been adopted by BOCA (the Building Officials and Code Administrators International), by state and local codes, and by numerous international codes (Rush, 1986). ASHRAE establishes the high and low limits of air and radiant temperatures, humidity levels, and air speeds within spaces in accordance with metabolic rates (activity levels) and clothing values, set by function and occupancy type. If well understood and followed by the building designer, it should ensure acceptable thermal conditions for 80 percent of the building occupants.
Mean Air Temperature (Ta)
The average air temperature inside a room is defined as mean air temperature, which is one of the elements that affect thermal sensation of occupants in a space.
Mean Radiant Temperature (Tr)
Mean radiant temperature was suggested to express the long-wave radiation energy received by the body when surrounding surface temperatures differ from the air temperature. Mean radiant
temperature could have a significant influence on the heat loss from human body and thus on human comfort (Fanger, 1970).
There are two methods to calculate mean radiant temperature (US DOE 2010). First, mean
the occupant and surfaces. Second, a mean value of surface temperatures is calculated and weighed by their surface areas. In this method mean radiant temperature would be independent to the
occupant’s location in a room. The second method is simplified and it has a wide range of application in practical engineering (Fanger, 1970).
Operative Temperature
To account for the effect of radiation on comfort sensation, operative temperature was suggested rather than mean air temperature to be measured in a space (Fanger, 1970, Arens et al. 1986). Operative temperature is a combination of mean air temperature and mean radiant temperature. Chapter 2.3 will provide more information.
Window surfaces inside a room may cause an occupant feel hot or cold despite a comfortable surrounding air temperature (Lyons et al. 2000). Occupants inside a room feels a different temperature, which is the combined effect of mean air temperature and mean radiant temperature based on ASHRAE Standard 2004 (ASHRAE 2004). This temperature is known as operative temperature (To).
In the two-node comfort model, operative temperature (To) is defined as the average of the mean radiant temperature and mean air temperature, weighted by their respective heat transfer coefficients (US DOE 2010).
To= (hc Ta+ hr Tr)/ hc+ hr
Operative Temperature = (Hc*AirTemp + Hr*RadTemp)/h h = hc+ hr
hc=8.3 !
hr=3.87+0.031 Tr To: Operative Temperature
Ta: Mean Air Temperature Tr: Mean Radiant Temperature
hc: the convective heat transfer coefficient, which varies with the air velocity around body and metabolic rate.
hr: theradiantheat transfer coefficient, which varies with Tr, mean radiant temperature.
To= $ Tr+ (1-$) Ta
To: Operative Temperature Ta: Mean Air Temperature Tr: Mean Radiant Temperature
$: radiative fraction
Radiative fraction ($) is a constant value that depends on relative air velocity and can be determined based on Standard 55- 2004 (ASHRAE 2004). A typical value of $ is 0.5, with maximum value of 0.9 and minimum value of 0.0. Value of 0 means that the operative temperature is similar to the mean air temperature. When air velocities are higher than 0.2 m/s, then lower values for radiative fraction might be used.
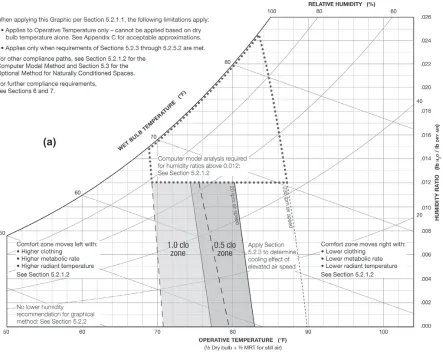
ASHRAE 55-2010 defines acceptable range of operative temperature and air speed for the comfort zone, depicted in figure 5.
Figure 5 Acceptable ranges of operative temperature and air speed for the comfort zone (ASHRAE 55-2010).
energy consumption would not be reported due to differences in real condition that the simulation inputs.
Nu and Burnett (1998) has first investigated the variations in thermal loads and energy consumption when operative temperature was used as a set point versus mean air temperature. These researches reported an increase in heating load in various office buildings when thermostat operative temperature was compared with mean air temperature (Nu and Burnett 1998, Caillet et al. 2009, Kumar 2011, Jain et al. 2011). However, variation is energy consumption depends on location, thermal properties of building envelope, area and distance of radiating surfaces, such as windows, and internal surfaces (Jain et al. 2011).
Predicted Mean Vote (PMV) and Predicted Percentage of Dissatisfied (PPD)
Predicted Mean Vote (PMV) and Predicted Percentage of Dissatisfied (PPD) are two indices to predict the occupants’ thermal sensation and specify acceptable thermal condition for an environment. PMV and PPD are used in the international Standard ISO 7730 (ISO, 2005) and they were originally proposed in Fanger’s model, which is th