ABSTRACT
SWANGNETR, MANIDA. Analysis of Patient-Robot Interaction Using Statistical and Signal Processing Methods. (Under the direction of Drs. David B. Kaber and Yuan-Shin Lee.)
Due to a shortage of nurses in the U.S., future healthcare service robots are expected to interact directly with patients. In such a scenario, patient emotional needs may be equally important as traditional performance measures of patient-robot interaction (PRI), including efficiency and accuracy. Consequently, there is a need to design nursing robots with the capability to detect and respond to patient emotional states and to facilitate positive patient experiences in healthcare. The objective of this research was to understand the effect of different features of service robots on user perceptions and emotional responses in a simulated medicine delivery task. The research also developed a new computational algorithm for human emotional state classification to facilitate effective PRI. Physiological responses, such as heart rate (HR), galvanic skin response (GSR) and facial electromyography (EMG), have been found to be clear and valid indicators of valence and arousal. Such physiological signals from patients can be monitored in real-time in hospitals. It is possible that physiological measures can be extracted and emotional states classified during patient interaction with robots. This information can provide a basis for real-time adaptation of robot behaviors to optimize patient emotional experiences in, for example, medicine delivery tasks.
physiological variables and emotional states. Arousal was significantly explained by GSR features while valence was better explained by HR and a small set of GSR features.
A second experiment was conducted to assess the effect of combinations of robot physical appearance and interface features and to examine facial EMG signals as another physiological measure for predicting patient emotional states. This experiment was conducted with younger participants (<40 years of age) to map a broad range of service robot users in healthcare environments. Results revealed combinations of humanoid features to increase user arousal and valence. However, multiple robot features led to emotional uncertainty (variability) and intensity for the younger participants, which were largely reflected in physiological responses. Strong non-linear relationships were observed between the physiological variables and emotional states with a similar pattern to the first experiment. EMG activity for cheek and brow region muscles also proved to be an effective valence state indicator. However, smiling tended to be more significant in predicting arousal states than frowning.
Analysis of Patient-Robot Interaction Using Statistical and Signal Processing Methods
by
Manida Swangnetr
A dissertation submitted to the Graduate Faculty of North Carolina State University
in partial fulfillment of the requirements for the Degree of
Doctor of Philosophy
Industrial Engineering
Raleigh, North Carolina 2010
APPROVED BY:
Dr. David B. Kaber
Chair of Advisory Committee Dr. Yuan-Shin Lee
DEDICATION
BIOGRAPHY
Manida (May) Swangnetr is the daughter of Somchet and Suda Swangnetr and older sister to Pasapong Swangnetr. She was born in Bangkok, Thailand. May completed her Bachelors degree in Industrial Engineering at Chulalongkorn University, Thailand, in 2000. In 2004, she received a scholarship from the Royal Thai Government to continue studying at the masters and doctoral levels in Industrial Engineering in the United States. After completing her Master degree at North Carolina State University in 2006, she continued with her Ph.D. study under the guidance of Dr. David Kaber and Dr. Yuan-Shin Lee. During her study, she was also supported through teaching assistantships with the Department of Industrial and Systems Engineering and a research assistantship through National Aeronautics and Space Administration (Grant No. NNH06ZNH001) and National Science Foundation (Grant No. IIS-0905505) funding.
ACKNOWLEDGEMENTS
I would like to thank my academic advisor and committee chair Dr. David Kaber for his
continuous support, assistance and guidance throughout my graduate studies and research at NC
State. I am truly grateful for the opportunity to have worked with Dr. Kaber as a teaching and research assistance. His advice in formulating my research topic and his direction and support throughout the process of my dissertation work have been invaluable and will help prepare me for my future career. I would like to thank Dr. Yuan-Shin Lee for his guidance during this work. I would also like to thank Dr. Ezat Sanii, Dr. Jeffrey Thompson, and Dr. Gracious Ngaile for serving on my committee. I appreciate their timeand comments in reviewing this dissertation.
Thank you to my HRI (human-robot interaction) research team (past and present), including: Dr. Tao Zhang, Dr. Prithima Mosaly, Biwen Zhu, and Kinley Taylor. I appreciated their friendship, expertise and support throughout my experimentation, data analysis and research reporting. I would also like to extend my thanks to my other labmates and ISE friends, including Dr. Deyao Ren, Dr. Eui Seok Kim, Plawut Wongwiwat, Apichart Boonma, Dr. Worawut Wangwatcharakul, and Sasitorn Srisawadi, for working through all the exams together. I also thank my friends: Joey, Ginger, P’ A and Ong, for their time serving as pilot subjects, including allowing me to put electrodes on their skin without any payment!
TABLE OF CONTENTS
LIST OF TABLES ... ix
LIST OF FIGURES ... xii
Chapter 1: Introduction... 1
1.1 Motivation for Study... 1
1.2 Background and Literature Review ... 3
1.2.1 Healthcare Service Robots ... 3
1.2.2 Models of Human Emotion... 8
1.2.3 Subjective Measures of Emotion ... 10
1.2.4 Physiological Measures for Indicating Human Cognitive States... 11
1.2.4.1 Cardiovascular Activity... 12
1.2.4.2 Eye Blinks... 15
1.2.4.3 Neurofeedback... 16
1.2.4.4 Electrodermal Activity (EDA) ... 17
1.2.4.5 Skin Temperature ... 19
1.2.4.6 Muscle Activity ... 20
1.2.4.7 Respiration... 22
1.2.4.8 Multiple Measures ... 23
1.2.5 Modeling Approaches for Classifying Human Emotional States ... 24
1.2.5.1 Analysis of Variance Models ... 24
1.2.5.2 Machine Learning Approaches ... 25
1.2.5.3 Fuzzy Logic Approaches... 27
1.2.5.4 Summary... 27
Chapter 3: Experiment 1 – Empirical Work and Statistical Analysis ... 31
3.1 Objective ... 31
3.2 Task Description ... 31
3.3 Participants... 32
3.4 Apparatus ... 32
3.5 Experiment Design and Variables ... 35
3.6 Detailed Research Hypotheses... 36
3.7 Procedure ... 37
3.8 Data Analysis and Result ... 38
3.8.1 Analysis of Subjective Emotional Response Measures ... 38
3.8.2 Analysis of Physiological Response Measures ... 42
3.8.2.1 Heart Rate Measures... 43
3.8.2.2 Galvanic Skin Response Measures ... 47
3.8.2.3 Discussion on Physiological Measures ... 48
3.8.3 Correlation Analyses... 49
3.9 Post-Experiment Interview ... 50
3.10 Conclusion ... 50
Chapter 4: Experiment 1 – Emotional State Classification... 52
4.1 Event Selection and Analytical Procedure... 52
4.2 Detailed Research Hypotheses... 54
4.3 Physiological Feature Extraction: Heart Rate Analysis... 55
4.4 Physiological Feature Extraction: Galvanic Skin Response Analysis... 56
4.4.1 Wavelet Selection... 56
4.4.2 Noise Elimination... 60
4.4.2.1 High Frequency Noise Elimination... 60
4.4.2.2 Mid-band Frequency Noise Elimination... 60
4.5 Feature Selection... 65
4.6 Emotional State Classification... 68
Chapter 5: Experiment 2 – Empirical Work and Statistical Analysis ... 77
5.1 Objective ... 77
5.2 Task Description ... 79
5.3 Participants... 79
5.4 Apparatus ... 79
5.5 Experiment Design and Variables ... 82
5.6 Detailed Research Hypotheses... 83
5.7 Procedure ... 84
5.8 Statistical Analysis... 86
5.8.1 Post-processing of Emotional Response Measures ... 86
5.8.2 MANOVA Modeling ... 87
5.8.3 Analysis of Subjective Response Measures ... 88
5.8.4 Analysis of Physiological Response Measures ... 90
5.8.4.1 Heart Rate Measures... 90
5.8.4.2 Galvanic Skin Response Measures ... 91
5.8.4.3 Facial Electromyography Activity Measures... 91
5.8.4.4 Discussion on Physiological Measures ... 92
5.8.5 Correlation Analysis... 93
5.9 Perception of Healthcare Service Quality... 95
5.10 Post-Experiment Interview ... 96
5.11 Conclusion ... 97
Chapter 6: Experiment 2 – Emotional State Classification... 99
6.1 Detailed Research Hypotheses... 99
6.2 Physiological Feature Extraction: Electromyography Analysis ... 100
6.2.1 Wavelet Selection... 100
6.2.2 Noise Elimination... 101
6.3 Feature Selection and Emotional State Classification ... 105
6.3.1 Discussion ... 108
6.4.1 Detailed Research Hypotheses... 110
6.4.2 Analytical Methodology ... 112
6.4.2.1 Analysis of Age Effect ... 112
6.4.2.2 Analysis of Emotional Uncertainty with Multiple Robot Humanoid Features ... 113
6.4.2.3 Analysis of Emotional Intensity due to Multiple Robot Humanoid Features ... 113
6.4.3 Discussion ... 115
6.4.4 Conclusion... 117
6.5 Further Non-linear Feature Reduction ... 118
6.6 Comparison with Other Feature Input Sets for Classification Models ... 120
6.7 Discussion ... 123
Chapter 7: General Discussion... 127
7.1 Effects of Robot Anthropomorphic Features on Emotional Responses ... 127
7.1.1 Experiment 1 – Examination of Individual Robot Anthropomorphic Features... 127
7.1.2 Experiment 2 – Examination of Multiple Robot Anthropomorphic Features ... 129
7.2 Classification of Emotional States ... 131
7.2.1 Wavelet Technology for Feature Extraction and Denoising ... 131
7.2.2 Statistical Feature Selection and Machine Learning for Emotion Classification ... 132
7.3 Relationships Between Physiological Responses and Emotional States ... 133
7.3.1 Heart Rate... 133
7.3.2 Galvanic Skin Response... 134
7.3.3 Facial Electromyography ... 134
Chapter 8: Conclusion ... 136
8.1 Research Assessment ... 136
8.2 Limitations ... 138
8.3 Future Research ... 140
LIST OF TABLES
Table 3.1. Levels of robot design features investigated in experiment. ... 35
Table 3.2. ANOVA results on arousal and valence with feature type as a predictor. ... 39
Table 3.3. ANOVA results on arousal and valence ratings for each robot feature... 40
Table 3.4. ANOVA results on HR for each event across feature types... 44
Table 3.5. ANOVA results on HR for the levels of each feature type at each event... 45
Table 3.6. Friedman’s test on GSR across feature types at each event. ... 47
Table 3.7. Friedman’s test on GSR at each event for the various feature types. ... 48
Table 3.8. Correlations between physiological measures and subjective ratings. ... 49
Table 3.9. Correlations between subjective ratings. ... 50
Table 4.1. ANOVA results on HR for levels of valence and arousal at specific events... 52
Table 4.2. ANOVA results on GSR for levels of valence and arousal at specific events. ... 53
Table 4.3. MSEs calculated on the differences between the reconstructed GSR signals for various dbN wavelets. ... 59
Table 4.4. Goodness-of-fit tests for wavelet detail coefficients for Normal and Laplace distributions. ... 63
Table 4.5. Significant high frequency de-noised GSR and HR features for predicting arousal and valence selected based on regression analysis. ... 67
Table 4.6. Significant total de-noised GSR and HR features for predicting arousal and valence selected based on regression analysis... 67
Table 4.7. Overall PCCs for arousal and valence classification networks using high frequency de-noised wavelet features selected based on backward elimination regression analysis. ... 71
Table 4.8. Overall PCCs for arousal and valence classification networks using total de-noised wavelet features selected based on backward elimination regression analysis... 72
Table 4.10. Overall PCCs for arousal and valence classification networks using all total
de-noised wavelet features. ... 74
Table 5.1. Robot configurations and degrees of humanness investigated in experiment. ... 83
Table 5.2. MANOVA results on subjective and physiological responses... 88
Table 5.3. ANOVA results on arousal and valence ratings for main effects... 88
Table 5.4. Correlations between pre-defined order of robot humaness and subjective ratings. ... 89
Table 5.5. ANOVA main effects results for transformed HR. ... 90
Table 5.6. Friedman’s test on GSR across robot conditions... 91
Table 5.7. ANOVA results on transformed EMGs for main effects. ... 92
Table 5.8. Correlation coefficients among the responses (numbers in parentheses are p values).. .94
Table 6.1. MSEs calculated on the differences between the reconstructed EMG signals for various dbN wavelets ... 101
Table 6.2. Goodness-of-fit test for wavelet detail coefficients from EMG signal compared with Normal and Laplace distributions. ... 103
Table 6.3. Significant GSR, EMG and HR features for predicting three-level arousal and valence states selected based on regression analysis... 106
Table 6.4. Overall PCCs for three-level arousal and valence classification networks using wavelet features selected based on backward elimination regression analysis... 107
Table 6.5. Significant GSR, EMG and HR features for predicting two-level arousal and valence states selected based on regression analysis... 107
Table 6.6. Overall PCCs for two-level arousal and valence classification networks using wavelet features selected based on backward elimination regression analysis. ... 107
Table 6.7. Robot configurations investigated in the two experiments... 110
Table 6.8. Sets of robot conditions from Experiment 2 induced different degrees of emotion... 111
Table 6.9. Bartlett's test results on SAM ratings and physiological responses across experiments. 112 Table 6.10. Bartlett's test results on SAM ratings and physiological responses across three levels of robot conditions... 113
Table 6.11. Standard t-test results on the range of individual SAM ratings and physiological responses across two studies. ... 114
Table 6.13. Overall PCCs and sensitivity analysis for two-level arousal classification networks after using non-linear reduction. ... 119 Table 6.14. Overall PCCs and sensitivity analysis for two-level valence classification networks after using non-linear reduction. ... 120 Table 6.15. Overall PCCs for two-level arousal and valence classification networks using all physiological features... 121 Table 6.16. Significant GSR and HR features for predicting two-level arousal and valence states selected based on regression analysis... 122 Table 6.17. Overall PCCs for two-level arousal and valence classification networks using GSR and HR features selected based on backward elimination regression analysis... 122 Table 6.18. Significant EMG features for predicting arousal states obtained from linear and
non-linear feature selection... 125 Table 6.19. Significant EMG features for predicting valence states obtained from linear and
LIST OF FIGURES
Figure 1.1. HelpMate robot (from Engelberger, 1998)... 4
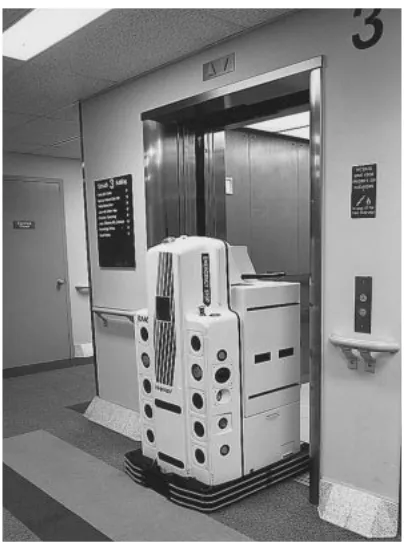
Figure 1.2. TUG robot (from Aethon Inc.). ... 4
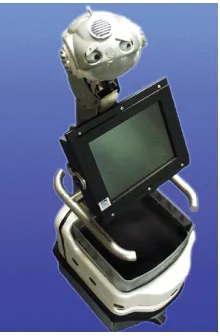
Figure 1.3. Pearl robot (from Pollack et al., 2002). ... 5
Figure 1.4. Hug robot (from DiSalvo et al., 2003). ... 6
Figure 1.5. DO-U-MI robot (from Park et al., 2001)... 6
Figure 1.6. Sister Mary robot (from Imperial College London, 2005). ... 7
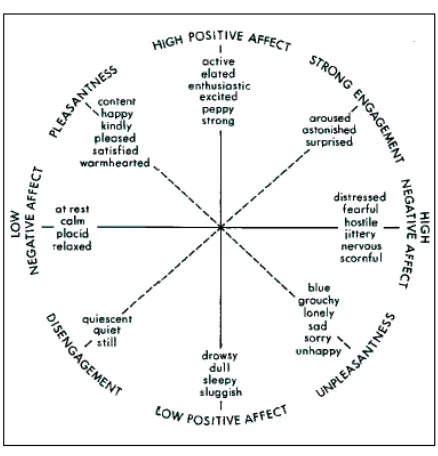
Figure 1.7. A two-dimensional structure of affect (from Watson & Tellegen, 1985). ... 10
Figure 1.8. SAM questionnaire for assessment of (a) valence; and (b) arousal. ... 11
Figure 1.9. ECG waveform... 12
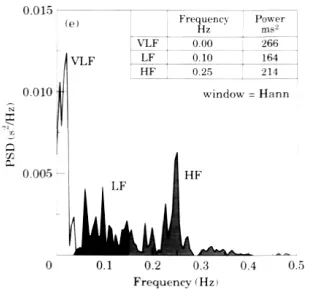
Figure 1.10. HRV frequency distribution. ... 14
Figure 1.11. GSR waveform. ... 17
Figure 1.12. EMG signal acquisition and MUAP generation... 21
Figure 3.1. PeopleBot platform... 33
Figure 3.2. Additional anthropomorphic features: (a) abstract face configuration; (b) human-like face configuration; (c) tablet PC for voice and interactivity features... 33
Figure 3.3. Heart rate monitor... 34
Figure 3.4. GSR measurement device... 34
Figure 3.5. Post-hoc results on arousal and valence for all feature types... 39
Figure 3.6. Post-hoc results on arousal and valence ratings for levels of face. ... 40
Figure 3.7. Post-hoc results on arousal and valence ratings for levels of voice. ... 41
Figure 3.8. Post-hoc results on arousal and valence ratings for levels of interactivity... 41
Figure 3.9. Post-hoc results on HR for Events 2, 4 and 5 for each feature type... 44
Figure 3.10. Post-hoc results on HR for face types at Event 6. ... 46
Figure 3.11. Post-hoc results on HR for voice types at Events 1 and 4... 46
Figure 3.12. Post-hoc results on HR for interactivity types at various Events. ... 46
Figure 4.2. Post-hoc results on HR for levels of valence at significant stimulus events. ... 54
Figure 4.3. Procedure to development of emotional state classification algorithm... 54
Figure 4.4. Box plot of HR for 100 random samples... 56
Figure 4.5. The wavelet decomposition tree... 58
Figure 4.6. Daubechies (dbN) wavelet family. ... 59
Figure 4.7. Power spectrum of GSR occurring during subject rest period. ... 62
Figure 4.8. Laplace distribution fit to wavelet detail coefficients from the GSR data collected during the subject rest period... 63
Figure 4.9. Noisy GSR and de-noised GSR comparison. ... 65
Figure 4.10. Residual plots for (a) arousal and (b) valence models, including significant physiological signal features... 68
Figure 4.11. Basic artificial neural network architecture... 70
Figure 4.12. Sensitivity analysis of arousal states to ANN inputs... 73
Figure 4.13. Sensitivity analysis of valence states to ANN inputs ... 73
Figure 5.1. Overall research procedure... 78
Figure 5.2. Detail on physiological feature extraction (A3) step... 78
Figure 5.3. Detail on emotional states classification (A5) step. ... 78
Figure 5.4. Myopac sytem for recording EMG signals. ... 80
Figure 5.5. EMG electrode placement ... 81
Figure 5.6. Post-hoc results on arousal and valence ratings for robot conditions. ... 89
Figure 5.7. Post-hoc results on HR for robot conditions. ... 90
Figure 5.8. Post-hoc results on GSR for robot conditions. ... 91
Figure 5.9. Post-hoc results on EMGSmile for robot conditions... 92
Figure 5.10. Average rating of perceived healthcare quality for different robot conditions. ... 95
Figure 6.1. Optimal mother wavelet generated for EMG signal (from Brechet et al., 2007)... 100
Figure 6.2. A typical EMG power spectrum with the shaded area indicating the signal lost when notch filtering is used to eliminate 60-Hz noise (from Day, 2002). ... 102
Figure 6.4. Laplace distribution fit to wavelet detail coefficients from the EMG data collected
during the subject rest period... 104
Figure 6.5. Comparison of noisy EMG and de-noised EMG signals. ... 104
Figure 6.6. Sensitivity analysis for NN inputs predicting two level of arousal. ... 108
Figure 6.7. Sensitivity analysis for NN inputs predicting two level of valence. ... 108
Figure 6.8. Sensitivity analysis for two-level arousal state model based on HR and GSR inputs. . 122
Figure 6.9. Sensitivity analysis for two-level valence state model based on HR and GSR inputs.. 123
Chapter 1:
Introduction
1.1
Motivation for Study
Globally, the number of persons aged 65 years and older in the United States is expected to increase by about 51%, from 477 million in 2005 to 719 million by 2020. Within this group, the number of persons aged 80 years and older is projected to increase nearly 64%, from 88 million in 2005 to 144 million in 2020 (United Nations Population Division, DESA, 2008). These increases in the number of elderly people will lead to an increase in demand for healthcare services; for example, hospitals, nursing homes and assisted-living facilities will require larger staffs of registered nurses (RNs). However, according to the Heath Resource and Services Administration (HRSA), there is a projected shortage of nurses in the United States relative to estimated demand amounting to 340,000 nurses by 2020. This is three times larger than the size of the historical peak shortage that occurred in 2001(Auerbach, Buerhaus, & Staiger, 2007).
This situation has led to use of overtime and extended work shifts for existing nursing staffs. Rogers et al. (2004) found that more than 80% of nurses worked longer than scheduled and approximately 40% of nurse work shifts exceed 12 hours. They found that the risk of nurses making errors was significantly increased when shifts were longer. For shifts lasting 12.5 hours or more, error rates were three times higher than for normal work shifts. When nurses worked overtime, or when they worked more than 40 hours per week, errors were more likely.
One possible solution to the nursing shortage is to increase the workforce by educating and recruiting more nurses, providing additional programs for nurse training and for retaining currently employed nurses (Goodin, 2003). Technology integrated in healthcare operations, such as using service robots, is another potential solution to reduce nurse workload for critical health care tasks and to increase reliability in basic tasks, including medication administration. Service robots have been developed to assist nurses in routine patient services. There are a number of tasks related to healthcare that service robots currently perform, including: material and supply delivery, cognitive prosthetics, social interaction, intelligent walker and telemedicine (Zhang, Zhu, Lee, & Kaber, 2008).
In considering delivery robots as a potential technology for reducing nurse workload and errors (e.g., medication administration errors), it is important to note that current commercially available service robots do not deliver medicines directly to patients. Related to this, existing robot designs do not support close interaction with patients. Due to the increasing shortage of nurses, it is possible that future service robots will be required to interact with patients, directly. Previous research (e.g., Cialdini, 2001) has indicated that patient acceptance of service robots may occur when positive emotions replace negative ones. Since emotions play an important role for patients in communication and interaction with hospital staff, there is a need to design service robots with features that facilitate not only effective task performance but positive patient emotional experiences. In order to account for patient emotions through robot design, sensitive, reliable and valid measures of human emotional states are needed. The capability to classify patient emotional states in real-time is also necessary to ensure that robots can adapt behaviors and expressions in interacting with patients to ensure perceptions of quality healthcare.
1.2
Background and Literature Review
1.2.1 Healthcare Service Robots
Figure 1.1. HelpMate robot (from Engelberger, 1998).
Figure 1.2. TUG robot (from Aethon Inc.)
Pearl has the capability to present different facial expressions by modifying the angle of its mouth and/or eyebrows. Motorized eyes are incorporated to suggest saccadic movement when tracking a human user’s face. It also has the capability of synthesized speech with speech recognition. It includes a touch screen display located at eye height for a sitting patient to make input. Results from an experiment by Pineau et al. (2003) demonstrated that the robot could autonomously provide reminders and guidance for elderly residents.
Figure 1.3. Pearl robot (from Pollack et al., 2002).
Figure 1.4. Hug robot (from DiSalvo et al., 2003).
Intelligent walker robots provide mobility and navigation guidance to patients in need of walking assistance to reduce fall risk and confusion in healthcare environments. The DO-U-MI (Figure 1.5) is an example of a research prototype intelligent walker robot (Park, Hong, Kwon, & Chung, 2001). This robot has the capability to determine user position by using a camera programmed with a face detection module for tracking a user’s face. Two microphones are also used for receiving and localizing sounds made by a user. The DO-U-MI also provides a touch screen interface for entertainment services. It was successfully demonstrated in a test scenario that the robot could accept a command from a user, autonomously move towards a user, and provide walking assistance (Park, Hong, Kwon, & Chung, 2001).
Robots have also been used for telemedicine, including remote consultations and examinations, by transferring real-time multimedia medical information from patients to remote doctors. The Sister Mary robot (Figure 1.6) developed by Imperial College London has been tested at St. Mary's hospital in London, UK (Imperial College London, 2005). It is controlled with a joystick by a doctor from a remote site. An LCD screen mounted a top the robot, similar to a robot face, presents an image of a doctor to the patient. In addition, the doctor can view the patient, ask questions, read patient records, view X-rays and test results from the console. This is similar to a multimedia teleconference. Although such robots are not able to replace direct care from doctors, they are communication tools that allow doctors to have remote interaction with their patients, if necessary.
Figure 1.6. Sister Mary robot (from Imperial College London, 2005).
presence of a face and/or head; (2) voice capabilities; and (3) the manner in which a user interacts with the robot (e.g., keypad to acknowledge medicine delivery or a screen displaying relevant prescription information).
To ultimately reduce nurse workload and improve quality of healthcare operations, it is important to understand what types of robot capabilities and features, as well as combinations, have the greatest impact on human (emotional) responses. This research focuses on robots in medicine delivery scenarios. Related to this, patient perceptions of healthcare quality are not only dependent upon whether the robot successfully performs tasks, but whether it provides positive emotional experiences for the patient during tasks.
1.2.2 Models of Human Emotion
There are two main types of human emotion theories in the psychology literature: discrete emotion models (Ekman, 1999) and dimensional emotion models (Russell, 1980; Watson & Tellegen, 1985). Discrete emotion theories claim the existence of a universal, basic set of emotions. The most widely accepted theory consists of six basic emotions: anger, disgust, fear, happiness, sadness, and surprise. These basic emotions are distinguishable from one another and other affective phenomena. Ekman (1999) also proposed that each primary emotion represents a theme or a family of related emotion states from which other emotions can be constructed by variations. His research was mainly based on facial expressions of the six emotions. However, some research has found that there are differences in expressions by subjects from different cultures. Moreover, many studies regarding activities of the autonomous nervous system (ANS) have failed to show distinct patterns for the six basic emotions (Peter & Herbon, 2006).
Dimensional emotion theories argue that all emotions can be organized in terms of continuous dimensions. Russell (1980) developed a two-dimensional emotion space, including
individual automatically perceives this change in their core affective state in terms of pleasure-displeasure and arousal-sleep; and (3) the individual seeks to label the emotional state within a dimensional space.
Based on Russell’s model, Watson and Tellegen (1985) suggested that the emotion space axes should pass through regions where emotional labels used by individuals are most densely clustered. They conducted a factor analysis with varimax rotation resulting in a model, including
Figure 1.7. A two-dimensional structure of affect (from Watson & Tellegen, 1985).
1.2.3 Subjective Measures of Emotion
Subjective measures of emotion include self-reports, interviews on emotional experiences, and questionnaires on which a participant identifies images of expressions or phrases that most closely resemble their current feelings. Feldman-Barrett and Russell (1998) collected self-reports on subject current emotional states in terms of arousal and valence. In this study, subjects were given a list of emotion words and rated them on Likert-type scales in different ways ranging from ‘not at all’ to ‘extremely’, ‘strong disagreement’ to ‘strong agreement’ or ‘describes me not at all’ to ‘describes me very well’.
to identify a person’s state by simply using dimensions (valence and arousal) without using emotion words. An emotional response also can be labeled by its position in the emotion coordinate system defined by the dimensions.
Using image-based self-reports of arousal and valence dimensions, such as the Self-Assessment Manikin (SAM) (Bradley & Lang, 1994) can overcome the disadvantage of subjects naming emotions. The SAM consists of pictures of manikins that represent five states of arousal (ranging from ‘excited’ to ‘bored’) and five states of valence (ranging from ‘very happy’ to ‘very unhappy’). Subjects can rate their current emotional state by either selecting a manikin or marking in the space between two manikins, resulting in a 9-point scale (see Figure 1.8).
(a)
(b)
Figure 1.8. SAM questionnaire for assessment of (a) valence; and (b) arousal.
1.2.4 Physiological Measures for Indicating Human Cognitive States
“fight” response) and the parasympathetic nervous system (tends to conserve and store bodily resources – “flight” response). Several physiological measures providing indicators of human emotional state, based on ANS activity are described in the following sections.
1.2.4.1 Cardiovascular Activity
In a review of applied physiological measurement techniques, Fahrenberg and Wientjes (2000) ranked cardiovascular activity measurement as most suitable for field studies due to its reliability, unobtrusiveness and ease of recording. Heart rate (HR), heart rate variability (HRV) and blood volume pulse (BVP) are common cardiovascular responses used as measures of emotional states.
Heart Rate (HR)
For a normal heartbeat, a continuous electrocardiographic (ECG) record, as presented in Figure 1.9, consists of a P wave, a QRS wave complex, a T wave and a small U wave. Heartbeat is usually measured in milliseconds by detecting each QRS wave complex and determining the intervals between adjacent R wave peaks. This is referred to as the RR interval, normal-to-normal (NN) interval, or inter-beat interval (IBI). Heart rate, in beats per minute (bpm), can be directly calculated from RR intervals.
Figure 1.9. ECG waveform.
intervals (SDNN, ms); the square root of the mean-squared difference of successive NN intervals (RMSSD, ms); mean heart rate (MeanHR, bpm); and the standard deviation of heart rate (SDHR, bpm). Lee et al. (2005) examined the relationship between MeanNN, SDNN and RMSSD of heartbeat and various emotional states (sad, calm pleasure, interesting pleasure, and fear). They found that MeanNN showed no difference among the emotions while SDNN and RMSSD were highest for fear and lowest for interesting pleasure. Amershi et al. (2006) selected MeanHR and SDHR, based on previous research, in studying user affective states in educational game playing. Their results showed that both measures of HR were relevant.
HR has been previously used to differentiate between user positive and negative emotions in human-computer interaction (HCI) tasks. Mandryk and Atkins (2007) developed fuzzy rules, based on a literature review, defining how physiological signals related to the psychological concepts of arousal and valence. Basically, they established that when HR is high, arousal (excited) and valence (happy) are also high (and HR is low when a user is bored and sad). However, other studies have shown that there are no observed HR differences between positive and negative emotions (Neumann & Waldstein, 2001; Ritz & Thöns, 2002; Peter & Herbon, 2006). Most studies of anger and fear using HR indicated that both emotions produced large increases in HR. Lisetti and Nasoz (2004) also found that HR was more related to anger and fear than to sadness and amusement; however, their results showed that HR increased when a subject felt fear and decreased when they felt angry. Detenber et al. (1998) found a deceleration in HR for negative valence stimuli and they found the same for positive stimuli, although not as strong. In addition, HR deceleration had higher correlations with high and low arousal states than for medium arousal. On this basis, the relationships between HR and valence and arousal may not be definite. Because of the practicality of the use of HR for emotion state classification, further assessment of these relationships was conducted as part of this study.
Heart Rate Variability (HRV)
the autonomous nervous system. Three main spectral components distinguished in the spectrum are presented in Figure 1.10 including: 1) a very low frequency component (VLF, 0.0033 - 0.04 Hz), representing slower changes in heart rate; 2) a low frequency component (LF, 0.04-0.15 Hz), associated with sympathetic nervous system activity; and 3) a high frequency component (HF, 0.15-0.4 Hz), primarily due to parasympathetic inhibition (Mandryk, 2005).
Figure 1.10. HRV frequency distribution.
Measurement of VLF, LF and HF components is usually computed in absolute values of power (ms2). LF and HF may also be measured in normalized units (n.u.), which represent the relative value of each component in proportion to the total power minus the VLF component. The measure of LF and HF in n.u. tends to minimize the effect of total power on the values of LF and HF (Malik et al., 1996). Another common statistical measure of HRV is a ratio of the low frequency and high frequency component (LF/HF). The LF/HF ratio is an index of autonomic balance, representing the relative influences of sympathetic to parasympathetic activity on the heart (Mandryk, 2005).
and emotions (sad, calm pleasure, interesting pleasure, and fear). They found that the LF/HF ratio was relatively higher for fear and interesting pleasure than for sad and calm.
Although HRV directly correlates to sympathetic and parasympathetic nervous system activity, the measures of HRV are obtained from analysis of continuous ECG recordings for at least 2 to 5 minutes. Related to this, Ekman (1984) observed that emotional responses typically last between 0.5 and 4 seconds. Emotions might be missed with shorter data recording periods or mixed emotions might be observed with substantially longer periods of measurement. In general, heart rate data recording durations less than 2 min. are not sufficient for determining HRV or other HR features in the frequency domain.
Blood Volume Pulse (BVP)
Blood volume reflects slow changes in the tonic level of an appendage while pulse volume is a phasic measure of the pulsatile change in blood flow related to both the pumping of the heart and to the dilation and constriction of blood vessels in the periphery. Blood volume pulse (BVP) is collected using a technique known as photoplethysmyography by using the light absorption characteristics of blood to measure the flow through skin capillary beds in the finger. These small capillaries tend to contract upon subject experience of an anxiety-provoking stimulus, causing BVP increases in response to pain, hunger, fear and rage as well as decreases in response to relaxation (Stern, Ray, & Quigley, 2001). However, the drawbacks of using BVP as a physiological measure of emotional state include: it is affected by room temperature; it is very sensitive to placement and motion of the measurement device; and it is not possible for real-time measurement and comparison between subjects (Mandryk, 2005).
1.2.4.2 Eye Blinks
derived from eye blink recordings include: eye blink rate, variability of blink rate, blink amplitude, and closure duration. Prior research on workload assessment generally has suggested that eye blink rate decreases as visual workload increases (Scerbo, Freeman, Mikulka, Parasuraman, Di Nocera, & Prinzel, 2001). However, a number of previous studies indicated a weak effect of arousal and valence on eye blink conditioning or no effect whatsoever (Grillon & Hill, 2003).
1.2.4.3 Neurofeedback
Electro-encephalography (EEG) measures the electrical activity produced by the brain. The recording of EEG is obtained by placing electrodes on the scalp with a conductive gel or paste, usually after preparing the scalp area by light abrasion to reduce impedance due to dead skin cells. Many systems typically use electrodes, each of which is attached to an individual wire. Some systems use caps or nets into which electrodes are embedded; this is particularly common when high-density arrays of electrodes are needed. However, these technologies are not easy to use and also cause moderate intrusiveness for subjects (Scerbo, Freeman, Mikulka, Parasuraman, Di Nocera, & Prinzel, 2001).
1.2.4.4 Electrodermal Activity (EDA)
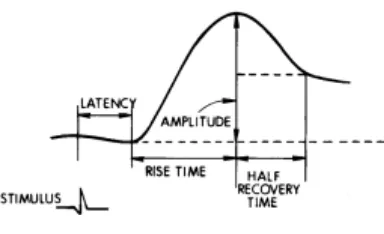
Galvanic skin response (GSR) measures the electrodermal activities at the skin in terms of changes in electrical resistance across two regions. The GSR amplifier applies a constant, imperceptible voltage between two electrodes attached to the skin. Since the voltage is constant, the current flowing between the electrodes is proportional to the skin conductance (SC, µSiemens), or inversely proportional to the skin resistance (µOmhs). The response is typically large and varies slowly over time; however, it has been found to fluctuate quickly during mental, physical, and emotional arousal. The sweat glands in the skin produce ionic sweat, in response to sympathetic nervous system activity. This results in decreasing the resistance of the skin and increasing conductivity. A GSR signal consists of two main components: skin conductance level (SCL) or tonic level - this refers to the baseline level of response; and skin conductance response (SCR) or phasic response - this refers to changes from baseline causing a momentary increase in SC (i.e., a small wave superimposed on the SCL). SCR normally occurs in the presence of a stimulus; however, a SCR that appears during rest periods, or in absence of a stimulus, is referred to as “spontaneous” or “nonspecific” SCR (NS-SCR). Figure 1.11 presents a typical waveform and parameters of GSR.
Figure 1.11. GSR waveform.
activity. Unlike most ANS responses, which change due to either sympathetic or parasympathetic activity, the neural control of the eccrine sweat glands is entirely under sympathetic control. Moreover, GSR is a sensitive physiological measure. As sweat rises in a particular gland, the resistance of that gland decreases even though the sweat may not overflow onto the surface of skin (Stern, Ray, & Quigley, 2001). Another advantage of SCR signals is that occurrence is generally distinguishable, without interference from other physiological signals. Although changes in SC can be disguised by motion, movement artifacts in signals are usually easy to detect (Peek, 2003).
The most commonly used GSR measure of emotion is the amplitude of SCR. Amershi et al. (2006) investigated several possible GSR features for indicating emotion in educational game playing; for example, mean, standard deviation, number of response peaks above threshold, sum of areas under peaks, etc. They found that peaks in signals were unimportant, and only means and standard deviations were relevant. In contrast, the temporal characteristics of SCR are not commonly measured and their relationship to psychophysiological processes is not well understood. Although the correlations among GSR parameters are generally not very high, there appear to be consistently high correlations between SCR rise time and half recovery time. Dawson et al. (2007) suggested rise time as the preferred SCR measure.
with negative valence (Lee, Yoo, Park, Kim, Jeong, & Lee, 2005; Amershi, Conati, & Maclaren, 2006).
Unfortunately, relatively few studies have examined the psychological significance of SCL and NS-SCRs produced during the performance of ongoing tasks. Dawson et al. (2007) reported relations between these GSR measures and task engagement as well as emotions. Typically, SCL increases about 1 µSiemen above resting level during anticipation of a task and then increases another 1 - 2 µSiemens during performance of the task. Similar to other SCR measures, SCL and the frequency of NS-SCRs increase during both fear and anger while decreases have been observed during relaxation. SCL increases more during fear than anger; whereas, the number of NS-SCRs increases more during anger than fear. Pecchinenda and Smith (1996) measured NS-SCR rate, maximum amplitude and slope of SCL during a difficult problem-solving task. Their results showed that SC activity increased at the start of all trials but decreased by the end (under the most difficult condition).
Finally, when considering use of GSR as an indicator of emotional state or other cognitive processes of interest, changes in electrodermal activity do not occur in isolation. Rather, they occur as part of a complex of responses mediated by the ANS (Dawson, Schell, & Filion, 2007). For example, stimuli that have an effect of increasing SCL and/or NS-SCR rates also generally increase heart rate and blood pressure and produce peripheral vasoconstriction.
1.2.4.5 Skin Temperature
1.2.4.6 Muscle Activity
As natural emotional behaviors go, facial expressions are the most visible and distinctive of behaviors. In order to measure changes in facial expressions that reflect emotional experience, Ekman & Friesen (1978) developed the Facial Action Coding System (FACS), which codes observable facial muscle movements. However, even a well-researched system, like the FACS, may not be sensitive enough to pick-up many emotional responses. It is a language-based measure requiring cognitive effort to relate emotional experiences to words. Therefore, a more precise, sensitive and effortless method is needed to measure changes in facial expressions associated with changes in emotional states.
A special neural feature of the facial muscles is that their contractions are not only under voluntary control, but they also spontaneously contract in patterns characteristic for different kinds of emotions (Lapatki, Stegeman, & Jonas, 2003). Examination of facial muscle responses by means of non-invasive surface electromyography (EMG) has shown activity to be reflective of emotional stimuli even when no changes in facial displays have been observed (Cacioppo, Bush, & Tassinary, 1992).
Figure 1.12. EMG signal acquisition and MUAP generation.
Facial EMGs have been used to distinguish between positive, neutral, and negative emotions (valence). Many studies have determined that there are two major facial muscles directly related to human emotional states (Nakasone, Prendinger, & Ishizuka, 2005; Hazlett, 2006; Hazlett & Benedek, 2007; Mandryk & Atkins, 2007). The zygomaticus major muscle (located over the cheek region), which controls smiling, has been found to be significantly more active during positive events as compared to negative. The corrugator supercilii muscle (located over the brow region) lowers the eyebrow and controls frowning. It has been found to be significantly more active during negative events. Frown muscle activity has also been used as a measure of mental effort (Hazlett, 2006; Mandryk & Atkins, 2007).
There are three main parameters for EMG signal analysis: amplitude parameters; frequency parameters; and time parameters (Peek, 2003; Konrad, 2005). Raw EMG signals oscillate with a mean of zero. Before performing quantitative amplitude analysis, these signals must be preprocessed using signal processing methods such as full wave rectification (converting all negative amplitudes to positive amplitudes) and smoothing (outlining the mean trend of the signal) by moving average or root mean square (RMS) techniques. The standard amplitude parameter, such as mean, peak, minimum value, area and slope, can then be calculated.
adopted the mean of rectified EMG signals for smiling to indicate positive, first impression responses to software application design; however, they used the number of peak EMG responses in frowning as an indicator of frustration during active use of the software. Mandryk and Atkins (2007) calculated smoothed EMG with moving average and used the amplitude of a normalized version of EMG for valence classification. Amershi et al. (2006) examined several EMG smile and frown features and found that only mean and standard deviation were important; whereas, the peak signal was irrelevant to emotion in educational game playing.
Frequency contents of EMG signals can be determined by transformation techniques such as Fast Fourier Transform (FFT). The common frequency parameters are: mean frequency (mean of the spectrum curve); total power (the integral under the spectrum curve); median frequency (the parameter that divides the total power area into two equal parts); and peak power (the maximum value of the total power spectrum curve).
Another important class of EMG parameters addresses timing characteristics within the EMG signal. Time to peak (the duration from the beginning of the analysis period or beginning of contraction to the peak amplitude value); onset (attack, how much time a muscle requires to activate); apex (or sustain of activity); and offset (relaxation or the EMG exhibited during the offset period) of signals are all common parameters of time analysis.
1.2.4.7 Respiration
Respiration is another physiological function that has been measured for inferring operator cognitive states. It is measured as the rate or volume at which an individual exchanges air in the lungs. Respiration can be measured by directly recording gas exchange in the lungs or by observing chest activity expansion. There are some respiratory measures, for example, tidal volume (the volume that is displaced in a single breath), duration of inspiration, duration of expiration, and total cycle duration. However, the commonly used measures in psychophysiological research are simply the rate of respiration and depth (i.e., amplitude) of breath (Stern, Ray, & Quigley, 2001).
with hyperventilation. However, startle events and tense situations may result in momentary respiration cessation. Negative emotions also cause irregularity in the respiration pattern. A number of studies related to mental workload indicate that mental effort, stressful mental task performance, and high cognitive activity have been associated with an increase in respiration rate and with a decrease in depth of respiration (Scerbo, Freeman, Mikulka, Parasuraman, Di Nocera, & Prinzel, 2001). Besides its psychological aspect, respiration is affected by physical activity. Also, a deep breath can affect cardiovascular measures because respiration is closely linked to cardiac functioning.
1.2.4.8 Multiple Measures
Several of the studies covered in this review directly compared the value of two or more of the previous physiological measures for assessing cognitive and emotional states. In general, research indicates that the following measures provide the clearest, valid correlations with valence and arousal as emotional states: (1) cardiovascular activity, typically HR (HRV has limitations for emotional state classification due to the required data recording duration); (2) electrodermal activity (EDA) or GSR, measured in terms of skin conductance (SC); and (3) facial muscle activity, measured using EMG signals. Other measures have shown less reliable indications of the identified emotions. Besides the prior research findings, the identified physiological signals are relatively simple and inexpensive measures with minimal intrusiveness to subject behavior.
Dawson et al. (2007) stated that in studying ANS activity, GSR and HR are the two most commonly observed physiological responses for indicating arousal and valence. GSR can be used as a predictor of arousal based on its neuroanatomical simplicity, trial-by-trial visibility, and utility for general arousal/attention indication. HR can be used as a predictor of valence based on its potential differentiation of positive and negative emotions and it can be used to predict extremely high and low values of arousal (Mandryk & Atkins, 2007). However, in some previous studies, it appears that the relationships between HR and GSR and valence and arousal are not definite. Therefore, further assessment of these relationships needs to be conducted.
of emotional state since they mostly reflect arousal and not emotional valence. He also suggested that many studies have validated facial EMG as the best indicator of valence. In order to assess patient emotional experiences in, for example, interacting with robots and for robot behavior to be adapted for effective service task performance, real-time measures of emotion need to be captured during the interaction and emotional states need to be classified in real-time. In hospital environments, HR, GSR and facial EMG signals can be made readily available through existing patient monitoring systems. Such data can be used for real-time prediction of patient emotional states during interaction with a robot by using an emotional state classification algorithm. There is a need to develop such a system in order to ensure future service robot effectiveness in nurse assistance in healthcare operations.
1.2.5 Modeling Approaches for Classifying Human Emotional States
Although physiological measures can be noisy and some may lack definitive relationships with human emotional states,numerous research studies have been conducted on emotional state classification based on physiological data. Modeling approaches, which vary in terms of both physiological variable inputs and classification methods, are summarized below.
1.2.5.1Analysis of Variance Models
the assumption of linear relationships between physiological measures and emotional states, which may not be the case.
1.2.5.2 Machine Learning Approaches
Machine learning is an alternative classification approach to deal with non-linear relationships and uncertainty among various system inputs and outputs. Machine learning algorithms can automatically generate models, including rules and patterns, from data. Supervised learning algorithms are used to identify functions for mapping inputs to desired outputs based on training data. Such algorithms are later validated against test data. Artificial neural networks (ANN) are a commonly used approach of supervised learning for human emotional state classification. Lee at el. (2005) applied a multilayer perceptron (MLP) network to recognize emotions from SDNN, RMSSD and meanHR of heart rate, LF/HF ratio of HRV and SC magnitude of GSR. By using ratings from the SAM questionnaire as desired outputs, the network was able to learn sadness, calm pleasure, interesting pleasure and fear with correct classifications of 80.2%. Lisetti and Nasoz (2004) compared three different machine learning algorithms: k-nearest neighbor (KNN); discriminant function analysis (DFA); and a neural network using a Marquardt backpropagation (MBP) algorithm, for emotion classification in a human-computer interaction application. They used minimum, maximum, mean, and variance values of normalized GSR, temperature and HR as the algorithm inputs; while emotion outputs (sadness, anger, fear, surprise, frustration and amusement) were derived from seeing movie clips that had been studied prior to eliciting the emotions. Results showed that overall the correct emotion recognition of the KNN was 72.3% accurate, the DFA was 75.0% accurate and the MBP NN was 84.1% accurate.
increased to 90%, but the network was much less complicated. It is important to know that all of these studies have focused on cognitive workload state classification; whereas, the present study is focused on the use of machine learning algorithms for emotional state classification.
Other supervised machine learning approaches have been used for emotional state recognition. Nakasone et al. (2005) constructed a Bayesian network for real-time emotion recognition using the mean EMG and GSR signal value for 5-second segments as well as subjective user perception of valence as network inputs. In their two-layer network structure, the first layer related signal variables to arousal and valence and the second layer further related arousal and valence to the emotions of fear, frustration, relaxation, joy and excitement. The probabilities used in the Bayesian network were set in accord with the literature.
Liu et al. (2006) examined several features from several physiological signals (e.g., cardiac activity, heart sound, EDA, EMG, etc.) in an attempt to classify mental stress when humans interacted with robots. A regression tree approach was employed to classify levels of anxiety by using self-reports of affective state as labeled outputs. An anxiety classification model was developed during video game play and achieved accuracy of 88.54%. The model was then tested to predict user anxiety in real-time during human-robot interaction task (basketball playing task), which resulted in 70% of correct classification.
Instead of learning from labeled data, Amershi et al. (2006) applied an unsupervised clustering technique to automatically discover patterns of affective expressions in educational games. They identified several possible influential features from SC, HR and EMG for smile and frown muscles. Results of the analysis showed that only a few of the features were relevant in defining clusters. In addition, clustering was able to identify several meaningful patterns of reactions within data.
suggested that signal processing features may be useful for this purpose (Najarian & Splinter, 2006).
1.2.5.3 Fuzzy Logic Approaches
In addition to statistical methods and learning algorithms, fuzzy logic approaches have been evaluated for quantitatively assessing the emotions of a user based on physiological data. Fuzzy logic approaches can be used to represent continuous processes that are not easily divided into discrete segments; that is, when a change from one linguistically-defined state to another is not clear. Mandryk and Atkins (2007) developed a fuzzy logic model to transform HR, GSR and facial EMG for smiling and frowning activity into arousal and valence states during video game play. A second fuzzy logic model was then used to classify arousal and valence into five lower level emotional states related to the gaming situation, including: boredom, challenge, excitement, frustration and fun. Results from the fuzzy logic models exhibited the same trends as self-reported emotions for fun, boredom and excitement.
From an emotion analysis perspective, this approach has the advantage of describing variations among specific states during the course of a complete emotional experience. The major drawback of this approach is that fuzzy rules used in a fuzzy system for classification problems must be constructed manually by experts in the problem domain. However, as described above, when analyzing human emotions, previous research has not been able to clearly define some relationships between physiological responses (e.g., HR and GSR) and specific states (valence and arousal).
1.2.5.4 Summary
Chapter 2:
Problem Statement
Use of service robots in healthcare operations represents a potential technological solution to reducing overloaded nursing staffs in hospitals for critical tasks. Use of robotic systems may also lead to increased accuracy and reliability in nursing task performance (e.g., medication administration). Service robots have been developed to assist nurses in routine patient services. Current commercially available systems do not deliver medicines directly to patients; therefore, robot designs do not support close interaction with patients. Due to the major shortage of nurses in the U.S., it is likely that future service robots will be required to interact with patients directly. To ultimately reduce nurse workload and improve the quality of healthcare operations, there is a need to design service robots with features that not only support effective task performance but facilitate positive patient emotional experiences. It is important to understand what type of robot features and which combinations have the greatest impact on human emotional responses in medicine delivery scenarios. To achieve this understanding, sensitive, reliable and valid physiological measures and classification models for recognizing human emotional state need to be identified. Certain physiological response measures and emotional state classification algorithms may be use in experimentation to identify robot features that are most useful for encouraging positive emotional experiences in the robot design stage.
Although there are several on-going research studies on emotional state identification based on physiological data, the literature review shows that currently there are relatively few classification models developed for recognizing human emotional states when interacting with robots, especially in medicine delivery scenarios. It also appears that the relationships between physiological responses (e.g., HR and GSR) and emotional states (valence and arousal) are not well-defined. Therefore, further assessment of these relationships is needed through sensitive physiological feature identification and robust emotional state classification modeling.
An inevitable problem when analyzing physiological signals is noise interference. Noise present in physiological signals can be generated from external sources (e.g., power line noise, motion artifacts, etc.) or internal sources (e.g., noise within the circuits of measurement device amplifiers; (Peek, 2003; Konrad, 2005). Additional signal processing must be applied in order to attenuate these noises without distorting the regular physiological signal characteristics. Furthermore, the nature of physiological signals is non-stationary (Najarian & Splinter, 2006). Non-stationary signals may include many random artifacts and other unpredictable phenomena; therefore, they are problematic for several signal processing methods, such as Fast Fourier Transform (FFT). A wavelet transform, which is a tool for analysis of transient, non-stationary, or time-varying phenomena, is often useful for such signal processing.
period, which is an informative feature in detection of disease, is in fact very closely related to the mathematical concept of signal power in the high frequency band. Related to using knowledge-based (statistical) features to represent a stochastic physiological signal, there may be some information loss since several simplifying assumptions are made. These include assuming that the probability density function of the data is known. Instead of using knowledge-based physiological features, a set of wavelet coefficients can represent an entire signal and reveal the location (time), amplitude and scale (frequency) of the signal.
Based on the above research issues, the objectives of this study were to:
(1)Examine the utility of advanced signal processing features, such as wavelets, for representing physiological signals in human emotional state identification - Wavelet coefficients can be used as a compressed representation of an entire physiological signal and for revealing location (time), amplitude and scale (frequency) parameters of signals. (2)Develop a wavelet-based de-noising algorithm – Non-stationary and noisy physiological
signals can be further processed using wavelet analysis. An algorithm needs to have the capability to eliminate noise, overlapping with the informative signal frequency, and increase accuracy of emotional state classification.
(3)Identify significant wavelet-based features for emotional states classification - Since the number of wavelet coefficients representing a signal can be large (based on available data), using all coefficients as inputs to a classification model may lead to model over-specification (and the need for a large number of learning samples to ensure validity in testing). Therefore, a statistical approach (backward elimination regression) was used to reduce the classification algorithm complexity but still ensure selected physiological features have utility for predicting emotional states.
(4)Assess the relationships between physiological responses, including HR, GSR and facial EMG, and emotional states in terms of valence and arousal; and
Chapter 3:
Experiment 1 – Empirical Work and Statistical Analysis
3.1
Objective
Prior research on service robots indicated three key robot features facilitating social interaction: a face and/or head; voice capabilities; and interactivity with the robot. Experiment 1 was conducted to determine what types of robot features have the greatest impact on human emotional responses in medicine delivery scenarios. The emotions of valence and arousal were identified by subjective response measures and various physiological measures were recorded. Previous studies indicated that HR and GSR are the most common choices to indicate arousal and valence emotion states. Therefore, this first experiment attempted to assess human emotional states when interacting with a robot by using HR and GSR variables.
3.2
Task Description
Typical medication administration performed by nurses includes: (1) assessing patients
health conditions and problems; (2) planning and making goals for care; (3) administering and
monitoring the effects of medications; (4) providing patient education and discharge planning;
(5) interdisciplinary collaboration with other healthcare units; (6) evaluating desired and adverse
effects of medications; and (7) documenting the process (Manias, Aitken, & Dunning, 2004). Nurses may ask patients how they feel and record observations on patient states as a form of
monitoring, provide explanations about medications and procedures to patients, and remain with
patients until they take their medication.
facial features, speech capability, and the degree of required user interactivity. Once the robot notified subjects of its arrival, it released the bottle of medicine (empty) from the gripper for the subject. Depending on the experimental conditions, subjects pressed a button on a tablet PC touch screen (mounted atop the robot) to confirm delivery of the simulated medicine, or they simply took the medicine from the robot gripper. The robot then waited for a short period of time before it turned around and moved out of the room. The average length of a trial was approximately 3 minutes. Each subject was exposed to a total of 14 trials.
3.3
Participants
With the aging U.S. population and age-related healthcare needs, the elderly are expected to be the largest user group of service robots in the future. In Experiment 1, 24 residents at senior centers (17 females and 7 males) in Cary, North Carolina were recruited. They ranged in age from 63 to 91 years with a mean of 80.5 years and a standard deviation of 8.8 years. Although 9 participants said they knew about robots through books, movies or television, and another 2 participants said they were familiar with the mechanisms of robots, none of the 24 participants had any experience in interacting with robots.
3.4
Apparatus
Robot and Tablet PC: A PeopleBot platform (Figure 3.1) was used in this experiment. The
Figure 3.1. PeopleBot platform.
(a) (b) (c)
Figure 3.2. Additional anthropomorphic features: (a) abstract face configuration; (b) human-like face configuration; (c) tablet PC for voice and interactivity features.
Heart Rate Monitor: A Polar HR monitor (Polar Electro Inc.), including a Polar S810i
Figure 3.3. Heart rate monitor.
Galvanic Skin Response Measurement Device: The iWorx GSR-200 amplifier (iWorx
Systems, Inc.) was used to apply a constant, imperceptible voltage between a pair of electrodes that were placed on the surface of the index and ring fingertips of subjects (Figure 3.4). The amplifier detected the current flowing between the electrodes and converted it into voltages. The GSR amplifier was factory calibrated so that a voltage of 1 volt was equivalent to a skin conductance of 5 µSiemens. The output voltages of the GSR signal were transmitted to a DT9834 data acquisition system (Data Translation Inc.). They were then recorded in a computer using the quickDAQ software (Data Translation Inc.) with a sampling rate of 1024 Hz.
3.5
Experiment Design and Variables
A single factor, randomized complete block (RCB) design with replication was used in this study. Each subject was exposed to all levels of robot configuration in random order. Interface features were varied on the robot. Physiological and subjective response measures on each subject, collected during repeated trials under a single condition, were considered as replicates.
Independent Variables: The robot feature manipulations included face, voice and
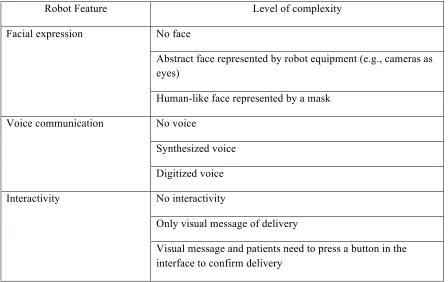
interactivity. Prior research has demonstrated that these features greatly affect people’s expectations of a service robot (Zhang, Zhu, Lee, & Kaber, 2008). Face refers to either an abstract or human-like face represented by the physical form of certain components or attachments to the robot. Voice communication refers to the ability of the robot to use voice messages during the delivery task. Interactivity was manipulated by the additional user interface presented on the tablet PC screen, allowing patients to confirm the delivery of medicine before the robot rendered the medicine. The levels of each robot feature were manipulated as within-subject variables and are presented in Table 3.1.
Table 3.1. Levels of robot design features investigated in experiment. Robot Feature Level of complexity
No face
Abstract face represented by robot equipment (e.g., cameras as eyes)
Facial expression
Human-like face represented by a mask No voice
Synthesized voice Voice communication
Digitized voice No interactivity
Only visual message of delivery Interactivity
Dependent Variables:The response measures collected during the experiment included: 1) subjective emotional ratings of arousal and valence, collected using the SAM questionnaire; 2) HR, measured in RR intervals with the Polar heart rate monitor, and then converted to bpm; and 3) GSR, measured in terms of current (volts) flowing between a pair of electrodes, and then converted to SC in µSiemens.
3.6
Detailed Research Hypotheses
Based on previous research, the following research hypotheses were formulated:
Hypothesis 1: Different robot configurations (face, voice and interactivity) were expected to
lead to different emotional responses, in terms of both subjective valence and arousal (measured with the SAM questionnaire) and objective (i.e., physiological) measures including HR and GSR.
Burgoon et al. (2000) reported that participants playing a desert survival task in an experiment felt their performance was better understood in the task when more anthropomorphic faces and voices appeared in the interface. Burgard et al. (1999) said an interactive robot may also have the potential for stimulating human excitement and enthusiasm