How Small Are the Smallest Selectable Domains of Form?
K.
E.
Weber'
Department of Ecology, Evolution and Behavior, University of Minnesota, Minneapolis, Minnesota 55455 Manuscript received January 14, 1991
Accepted for publication October 14, 1991
ABSTRACT
T w o lines of Drosophila melanogaster from the same base population were selected in opposite directions to produce simultaneous antagonistic changes in two very small (<0.2 mm) and closely adjacent (<0.3 mm) dimensions within the base of the wing. Wing dimensions near the targeted area
became differentiated by large positive and negative percentage differences, while only small homo- geneous percentage changes occurred in the remainder of the wing. If very small regions of morphology (less than 100 cells across) can respond to selection almost independently, even in small population samples, then the control of developmental detail must involve many genes, and the diversity of possible outcomes in development and adaptation must be large.
I
NSECT wings undergo complex deformations dur- ing flight, which are passively controlled by the locations of the wing veins. In wings at rest, the veins maintain a topography of panels and corrugations in the wing membrane and are often hinged and rein- forced at various points, all in such a way as to suggest that the deformations occurring in flight may be ad- vantageous. Functional studies of wing morphology in diverse taxa, using high speed photography and principles of aerodynamics, confirm that many details in the way wings pleat, buckle and warp during flight can be interpreted provisionally in terms of optimal design (NORBERG 1972; NACHTIGALL 1981; BRODSKIY and IVANOV 1983; ENNOS 1988; WOOTTON 198 1,1990). Indeed, in some of these studies the idea of optimality is so pervasive that nearly every feature of contour and venation is automatically referred to as an adaptation, even where authors disagree or have no theory regarding the feature's function.
In a broad and membranaceous structure such as the insect wing, only two cells thick, a network of stiffening veins has obvious utility. But that every detail in such an irregular pattern represents the
realization of mechanical perfection via natural selec- tion, just as a cast form reflects its mold, is an inter- pretation that should attract the interest of geneticists, because of the high density of genetic information this would demand. Some developmental biologists already favor the view that morphological differentia- tion may be controlled by a relatively small number of genes (GARC~A-BELLIDO 1983; RAFF and KAUFMAN
1983), or by a limited number of developmental out- comes (GOODWIN 1984), with much final detail sup- plied automatically by epigenetic mechanisms (HoR-
I Present address: Department of Biological Sciences, University of South-
e m Maine, Portland, Maine 04103. Genetics 130: 345-353 (February, 1992)
DER 198 1). Thus one could not, as a rule, change small individual parts autonomously (ALBERCH 1980), nor achieve fine-grained adaptive optimization. Yet this seems incompatible with the view of functional morphologists, that natural selection is able to fashion detailed wing morphologies which satisfy strict local design requirements at almost every point.
Studies of natural variation in wing form sometimes suggest a nonfunctional component. A purely descrip- tive study of wing morphology in several butterfly taxa suggested strong developmental constraints on some aspects of form (STRAUSS 1990). A study of wing form variation in cicadas (SIMON 1983) found diver- gences among isolated broods that could be due to genetic correlations or to drift. A related observation is that mimicry in butterflies often involves not only coloration but also some convergence in wing outline, indicating that the outer contours of the wing may not be under the strict control of aerodynamic re- quirements. But these are only interpretations and cannot clearly refute the idea that most details of contour and venation reflect precise mechanical de- mands.
A key question, then, is whether the necessary ge- netic potential exists for dense, fine-grained, autono- mous and localized adaptive change all over the insect wing; or whether the potential for localized remodel- ing is only coarse-grained and scattered here and there. Common sense dictates that there is some lower limit to the size of the smallest morphological domains that can typically be altered independently by mass selection. However, very few experiments have ex- plored this lower limit.
Several selection experiments have demonstrated localized polygenic effects on specific bristles in Dro- sophila (MAYNARD SMITH and SONDHI 1960; REEVE
demonstrated the existence of modifiers of small gaps in wing veins caused by several mutations (MILKMAN
1970; THOMPSON 1974a; COHAN 1984; SCHARLOO
1987). But all these cases show variation only in a structure's presence or absence at a fixed location, not in the location itself. This was already familiar, at a larger scale, in major mutations (most described in LINDSLEY and GRELL 1968) that add or subtract bris- tles (PLUNKETT 1926; ASHBURNER 1982) or wing veins (THOMPSON 1974b; DIAZ-BENJUMEA and GARC~A-BEL- LIDO 1990) in predetermined regions. A distinction has often been made between such variation, and variations in form (BATESON 1894; COCK 1966;
ample, the necks of giraffes and dolphins differ in form but not in plan, both having seven vertebrae. Most differences in wing venation among related in- sects involve considerable changes in form, i.e., in the relative locations of homologous landmarks. Most of the fine adjustments presumably necessary to achieve optimization consist of shifts in form (WOOTTON
1990).
Interspecific crosses have shown that sibling species of Drosophila, differing in the form of individual parts, are fixed for multiple factors affecting the form of those parts (TEMPLETON 1977, analyzed in LANDE
1981; COYNE 1983; COYNE, Rux and DAVID 1991;
SPICER 199 1). A few selection experiments have also demonstrated within-population genetic variation af- fecting the proportions of inter-landmark distances in Drosophila. SCHARLOO (1 987) changed the locations
of dorsocentral bristles, and HAYNES (1 988) changed the ratios of various wing dimensions to wing length. WEBER (1 990) selected on pairs of major wing dimen- sions antagonistically, and produced rapid change in every tested dimension, with paired dimensions re- sponding in opposite directions simultaneously. Well defined allometries of the wing were easily broken. This plasticity of wing form in response to selection on major dimensions raised the question of how small the lower limits of localized selectable effects would
be.
T h e selection experiment reported here aimed to find such a limit. T h e selected trait involves the small- est region of external insect morphology that has been tested for the presence of segregating genes with localized effects on form. T h e region was chosen because it presented the tightest cluster of good land- marks that could be identified on the wing of Dro- sophila melanogaster, but it was otherwise chosen at random. A metric was devised to distinguish localized variations inside this region from variations of the surrounding wing.
CHERRY et al. 1979; GARCiA-BELLIDO 1983): for ex-
MATERIALS AND METHODS
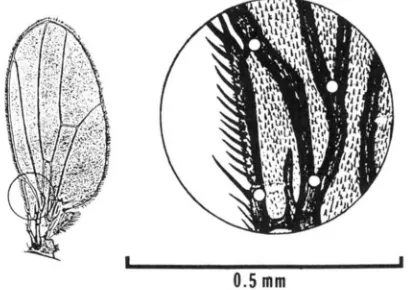
At high magnification, many landmarks on the wing are grainy and hard to pinpoint, but the four points in Figure
I I
0.5 mm
FIGURE 1 .-Full wing and enlargement, showing the target area with four landmark points. Dl is the distance between the upper pair of points; Ds is the distance between the lower pair. Selection was for large D,/small D? in population E' and for small D,/large
D2 in population E-.
1 are reasonably distinct. Two small adjacent dimensions (Dl and On), derived from these points, were the objects of selection. Both dimensions are transverse to the long axis of the wing. Dimension D l extends from the junction of vein L1 and the inner costal margin, to the junction of veins L2 and L3; D2 extends from the inner proximal edge of the costal gap at the base of the costal cell, to the junction of L1 with L2. These two dimensions are around 0.15 mm (Dl) and 0.1 1 mm ( D 2 ) in control flies cultured at 24" with
uncrowded larvae. The number of cell diameters in each dimension can be estimated at about 35 (Dl) and 20 (D'L),
since each wing cell bears a single bristle; however, changes in shape are analyzed here in terms of distance only.
T o detect the segregation of genes which affect primarily a single local dimension, it is necessary to normalize the variations in that dimension against the variations common to the surrounding area. T h e simplest approximation of this idea is to normalize a pair of neighboring dimensions against each other, by applying selection perpendicularly to the major axis of the joint distribution of the two dimensions. If the two dimensions are isometrically related, this could be done approximately by selecting on their ratio. If not, then the ratio is correlated with size, and correction must be made to avoid selecting for differences which are merely the allometric effect of change in overall size. In pilot experiments (K. WEBER, unpublished results) with selection on the ratios of allometrically related wing dimensions, much of the response was attributable simply to change in overall wing size, confounding the high heritability of wing size with the autonomous heritabilities of subregions.
The bivariate distributions of Drosophila wing dimen- sions are usually allometric and the major axis can be con- veniently approximated by a polar equation (0 = or" ) derived by the regression of the log of 0 on the log of r ,
where 0 = arctan(D2/Dl) and r = ( D l s
+
Dp2)IP2 (WEBER 1990b). (The two dimensions are assumed to be near each other and positively correlated.) The angular offset of indi- vidual points from this curve, in radians, then provides an allometrically corrected antagonistic scale of selection. On this scale, flies with large D l or small Dn have positive (clockwise) offsets, while flies with small Dl or large D2 have negative (counterclockwise) offsets. This method allows si- multaneous antagonistic selection on both dimensions using a single scale. The method is more fully explained in WEBER(1 990), as is the system used to measure live anesthetized
E+
I
I I I I I I I I I I I
1 2 3 4 5 6 7 8 9 1 0 1 1 generation
FIGURE 2.-Selection response in males, in radians of angular offset from the control baseline. Bars give two standard errors above and below generation means. Sample sizes were either 100 or 150.
Two divergent selection lines (designated E' and E-) were founded from a long established wild-type base population (LF350), which originated from a large sample of wild flies and has been maintained at large size. A baseline equation
of 8 = 0.527 r "0.08' was derived for D l and D 2 in this
population. Flies were selected for positive angular offset from this baseline in line E+ and for negative offset in line
E - , with the offset (4) of each fly calculated by subtracting its true angle from the angle predicted by the baseline for its r . In each selection line the most extreme 20% of 100- 150 unmated flies of each sex were selected each generation for 10 generations. Controls were the large base population (designated here as CN1) and a subline of the base popula- tion (CN2) which has been maintained for more than 70 generations.
In generation 11 both selected lines were cultured under identical conditions and measured to determine propor- tional differences over the whole wing. The coordinates of
17 landmarks were digitized from left or right wings at random, from 100 live flies of each sex in each line. The landmarks included breaks, notches and intersections of veins, and were defined with detailed drawings. Each of the 17 points had been digitized by the author on several thousand flies, in other work, before final measurements in the present study were taken, so that interpretations had become habitual and fully standardized.
To evaluate the pattern of change, 26 inter-landmark dimensions were extracted and compared between lines E+
and E-, in each sex. All significance levels given here are corrected for the total number of comparisons (52) between the oppositely selected populations, by a modification of the "sequential Bonferroni" method (HOLM 1979; RICE 1989). Dimensional differences were ranked not by exact probabil- ities, but by their probability cutoff points (P = 0.05, 0.01,
. . .
, 0.000001) up to the limits of Table 26.10 in ABRA-MOWITZ and STECUN (1972), using the &distribution with
d.f. = 198. Then these significance levels were corrected by the sequential Bonferroni method, as if all P values in each category were identical to the cutoff maximum. This mod- ification gives lower significance levels than could be claimed with more exact methods.
RESULTS
Figures 2 and 3 show the course of selection re- sponse in both sexes, on the angular offset scale of
E+
I I I I I I I l l I I
1 2 3 4 5 6 7 8 9 1 0 1 1 generation
FIGURE 3.-Selection response in females, in radians of angular offset. As in Figure 2, with two standard errors of the means, and sample sizes of 100 or 150.
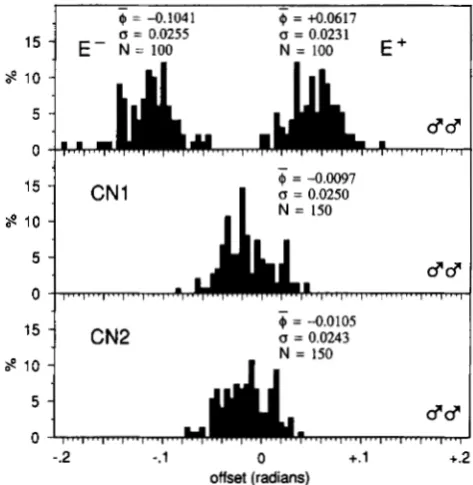
1
- 6 = -0.1041 - 6 = +0.0617u = 0.0255
l 5
1
E-
N = I O O N = 100E
+ u = 0.0231-
$ = -0.0097
s
10 -5 -
i
l 5
1
CN2-
@ = -0.0105
u = 0.0243
N = 150
0
-.2 -.l 0 +.l +.2
offset (radians)
FIGURE 4.-Distribution of angular offsets. Males of both se- lected lines in generation 1 1, and of both control lines.
selection. After several generations, mean offsets al- ready diverged significantly from the baseline in both directions. Selection was continued to the eleventh generation to intensify any correlated changes in the surrounding wing, and to determine the shape of the response curves. Response was continuous but asym- metrical, as might be caused for example by moderate asymmetries in allele frequencies (FALCONER 198 1).
T h e realized heritabilities of angular offset were 0.12 & 0.02 in line E + , and 0.24 & 0.02 in line E- (standard errors by the method of HILL 1972).
from either control. T h e distributions of the selected lines are nonoverlapping, and the mean divergence between them in generation 11 is 6.7 times the mean standard deviation of controls. The variances have cbanged little.
During selection most measurements were made by an assistant, whose interpretations of the precise lo- cations of landmarks underwent some readjustment during the first generation. This explains the signifi- cant first-generation difference between males of the two selection lines (Figure 2). All final measurements were made by the author. A small but consistent difference in interpretation of landmarks is detectable in the endpoint data: the distributions of the control populations (Figures 4 and 5) are not centered pre- cisely on zero angular offset but are all slightly nega- tive, and a similar negative shift appears in the selected lines between generations 10 and 11 in Figures 2
and 3.
The increased offset from the reference baseline, in both selected lines, shows that the bivariate distri- bution of
Dl
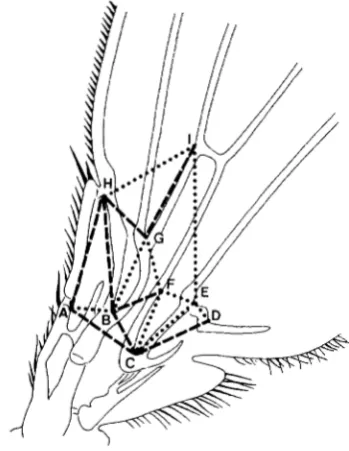
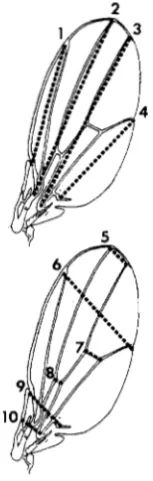
and 02was relocated in both lines, inopposite directions. T h e divergence between the se- lected lines can be analyzed in terms of the changes in Dl and 02and in other adjacent dimensions 'of the wing. Figure 6 shows nine landmarks (designated
A
through I ) in the vicinity of the selection targets, connected by lines to form a solid framework of small dimensions. Dimensions
H G
andAB
are the selected dimensions, D l and D2. Dashed lines indicate dimen- sions which are larger in population E+ than in E - ,and dotted lines show dimensions which are larger in population E- than in E + .
Table 1 gives the magnitudes of the most significant differences indicated in Figure 6. The differences in Table 1 are obtained by subtracting the mean size of each dimension in population E - from the mean in population E+. This gives a positive sign to the differ- ence in those dimensions in which population E+ ex- ceeds population E- (dashed lines in Figure 6), and a negative sign to those dimensions in which E- exceeds
IP
(dotted lines in Figure 6). Table 1 also gives the standard error of the difference in means for each dimension, and the difference as a percent of the lineE- mean. The significance levels of the differences in means were corrected for the total number of com- parisons in this study, as explained in MATERIALS AND
The two selected populations are extremely differ- entiated in the target area. T h e differences in individ- ual local dimensions are highly significant, and the pattern of percentage differences is similar in both sexes. The most important point is that many signifi- cant differences are opposite in sign, even between adjacent dimensions.
The complex reconstruction that would now be METHODS.
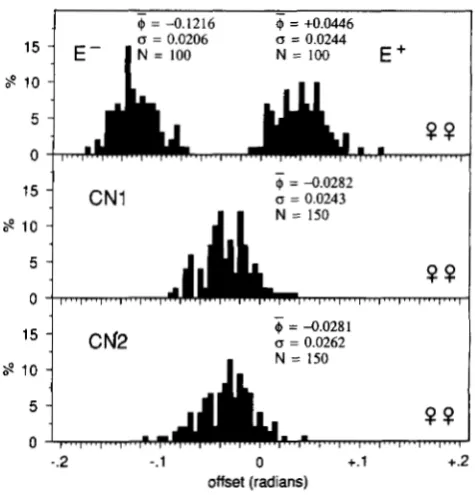
@ = -0.1216
IS = 0.0206
@ = +0.0446
IS = 0.0244
l 5
/
E - I N = 100 N = 100 E +-
@ = -0.0282
IS = 0.0243 N = 150
5
15
4
CM2-
Q = -0.0281
IS = 0.0262
N = 150
0
-.2 -.l 0 +.l +.2
offset (radians)
FIGURE 5.-Distribution of angular offsets. Females of both se- lected lines in generation 1 1 , and of both control lines.
required to change the wing of either selected popu- lation into the wing of the other, can only be under- stood by visualizing both expansions and contractions of adjacent dimensions. Moving in the direction E - to
E+, for example (as indicated in Figure 6), dimensions
IH
and IE decrease, while the dimensionIG
lying between them increases by 15%. This is accomplished by the independent lowering of pointG
relative to I ,reducing both dimensions
GF
andGB.
(For simplicity all directions are given with reference to the orienta- tion of the wing in Figure 6.) T h e relative downward relocation of pointG
increases the selected dimensionH G
( D l ) . At the same time, the dimensionsHA
andH B
increase, so that pointH
moves upward whileG
moves downward, both relative to
I.
T h e net effect is a difference between populations E- and E+ of around 40% in dimensionH G
( D l ) , and a corresponding dif- ference in the angleHBG,
which is about 10% larger in line E+ in both sexes. AlthoughDl
is 40% larger inE+ than in E - , D2
(AB)
is 3-4% smaller (Table 1). Thus it is possible to produce significant differences in opposite directions simultaneously, -by localized re- arrangements, in these two neighboring parallel di- mensions.Table 2 and Figure
7
show differences between the selected populations over the remainder of the wing, in dimensions aligned with either length or width. All the percent changes in length and width are very small. They are also consistently positive (E+>
E-).Localized Morphological Variability 349
TABLE 1
Differences in local dimensions in the target area
Dimension" Males (mm) Percent Females (mm) Percent
IH -0.0131
*
0.0016 -5,6**** -0.0163 f 0.0019 -5.g****IG +0.0329 2 0.002 1 +15.0**** +0.0432 f 0.0022 +16.2****
GF -0.0345 & 0.0010 -24.4**** -0.0402 f 0.0013 -25.1****
G B -0.0383 f 0.0014 -18.1**** -0.0444 f 0.0017 -18.2****
H A +0.0209 f 0.0019 +7.8**** +0.0263 f 0.0019 +8.7****
H B +0.0313 f 0.0018 +11.6**** +0.0375 f 0.0019 +12.2****
H G ( D I ) +0.0484 f 0.0012 +39.6**** +0.0560 f 0.0013 +41.0****
AB(&) -0.0041
*
0.0006 -3,g**** -0.0034 f 0.0006 -2,8****BF +0.0040 f 0.0010 +3.4** +0.0053 f 0.0010 +3.7****
C D +0.0056
*
0.0010 +3.2**** +0.0038 f 0.001 1 +1.9*a Dimensions as shown in Figure 6. * 0.01 < P < 0.05; ** 0.001 < P < 0.01; *** 0.0001 < P < 0.001; **** P < 0.0001.
FIGURE 6,"Differences in generation 11 between oppositely se- lected populations, in distances separating 9 landmarks ( A - I ) in the target area. Dimensions marked with dashed lines are larger in population E+ than in population E-; dimensions marked with dotted lines are larger in population E- than in population E + . All measurements are from the same wings as in generation 1 1 in Figures 2, 3, 4 and 5 . (See Table 1 for magnitudes of individual differences.)
simply say that the wings of population E+ are every- where slightly longer and slightly wider than the wings of E-.
T h e small overall increase in wing width in E+
relative to E- cannot account for the disproportion- ately large percent increase in D l . Figure 6 shows that the small width increase in dimension 9 (point H to point D ) is actually the net of a large local expansion within HG ( D l ) , and compensating reductions in GF, FE and ED. T h e largest reduction is in GF (Table 1). Clearly point G , the junction of veins L2 and L3, has undergone an independent shift in its position on the wing in E+ relative to E-, moving downward and to
the right in Figure 6. This relocation is a major source of the difference in Dl.
Especially to be noted is that although dimension 8 (Table
2
and Figure7)
is very near D l , parallel to it, and within the same distal anterior wing compartment (GARC~A-BELLIDO 1975), it does not change in the same proportion as D l . In fact dimension 8 exhibits no greater percent width change than dimension 7,which is farther away and in the posterior compart- ment. This shows that the large percent difference in
Dl cannot be explained by a homogeneous change in the width of one whole compartment, but must be limited to a more localized area.
T h e negative difference in 0 2 is significant and in
the direction predicted by the selection protocol, and is a localized difference in the opposite direction to the surrounding positive divergence. Thus line E+,
relative to E-, achieves a reduction in 0 2 in spite of
expansion of the wing overall (Table 2 and Figure
7),
and in spite of surrounding local expansion in H A , H B , AC and BC (Figure 6). These antagonistic changes must reduce the percentage magnitude of the simul- taneous reduction that can be achieved independently in 0 2 in line E+.
T h e intrusion of some overall wing size divergence in these rearrangements is not surprising since other selection experiments have shown that wing size pos- sesses much additive genetic variance (ROFF and MOUSSEAU 1987). By using a more constraining index, with D l selected antagonistically to both D2 and overall size, the divergence in wing size might be reduced, thereby decreasing all dimensions in E+ relative to E-
and making the difference less positive in D l , more negative in D2.
DISCUSSION
TABLE 2
Differences in length and width dimensions
Dimension" Males (mm) Percent Females (mm) Percent
1 +0.0194 f 0.0053 +1.8* +0.0285 f 0.0058 2
+2.2*** +0.0262 f 0.0071 +1.5* +0.0470 f 0.0078 +2.4****
3 +0.0218 f 0.0069 +1.3 NS +0.0352 k 0.0075 +1.8*** 4 +0.0058 f 0.0042 +0.6 NS +0.0080 f 0.0049 5
+0.7 NS
+0.0017 f 0.0021 +0.8 NS +0.0067 f 0.0022 +3.0 NS
6 +0.0415 f 0.0043
7 +0.0100 f 0.0012 +5.9**** +0.0068 f 0.0013 +3.3**** 8 +0.0026 f 0.0006 +3.3*** +0.0035 f 0.0006 +3.8****
+0.0274 f 0.0020 +7.4**** +0.0293 f 0.0021 +7.0**** +4.8**** +0.0477 f 0.0044 +4.9****
9
10 +0.0025 f 0.0009 +1.3 NS +0.0017 f 0.001 1 +0.8 NS
Dimensions as shown in Figure 7. * 0.01 < P < 0.05;
**
0.001 < P < 0.01; *** 0.0001 < P < 0.001;****
P < 0.0001.2
1
FIGURE 7.-Dimensions aligned with either the length (1-4) or the width (5-10) of the wing. See Table 2 for magnitudes of differences in these dimensions.
harbor its own differentiable genetic variability, so that its form is subject to selection. Small neighboring elements can shrink and expand inversely. There were certain constraints on this response, in that the antag- onistic changes were not evenly distributed and the response was not entirely free of correlated effects; but response was certainly disproportionately local- ized in the targeted area of the phenotype. Given this result one might expect that even greater resolution and control of detail could be achieved in larger populations over longer times.
T o the functional morphologist, or to anyone with a reflexive and literal belief that everything is select- able, such a result might seem too predictable to require any demonstration. T h e simplest adaptationist reasoning would assert that (1) any functional element (however minor) must be optimal, almost as a condi- tion of life; (2) its optimality results from selection,
presupposing the existence of additive genetic vari- ance; and therefore (3) it is bound to display additive genetic variance again if subjected to artificial selec- tion. This logical chain breaks down at all three points for the following corresponding reasons: (1) as the continual improvement of human inventions illus- trates, many mechanisms already function extremely usefully even in an imperfect state; (2) in theory at least, even strongly adaptationist accounts of evolu- tionary change need not be based on mass-selectable, additive genetic variance (this is well stated in WRIGHT 1965); and (3) even adaptive changes arising from additive variability need not retain their original ge- netic polymorphism, and in traits involving few loci would often lose it all. (For that matter, an absence of immediate selectability in critical structures could be predicted just as reasonably on adaptationist grounds.) Thus no fair claim can be made that the present results were inevitable, as if this were a corollary of the theory of evolution itself. On the other hand these results, as far as they go, clearly support the assumption of fine- grained selectability that underlies strictly functional- istic interpretations of insect wing morphology.
Localized Morphological Variability
per trait, usually employing lines of 5-25 pairs se- lected for 10-1 5 generations, or about the same as in the present study.
T h e question of primary interest, however, is the extent to which the rest of the fly is also readily deformable by selection at the same small scale. Such experiments have been impossibly tedious by conven- tional methods. Can adjacent dimensions within leg, haltere or antenna be changed in opposite directions simultaneously? How fine-grained is the mosaic of the smallest selectable variations? In more general terms, as trait definitions approach identity within some con- stricting domain, how rapidly does their genetic dif- ferentiability tend to vanish? It would be useful to have more information about the lower limits of mor- phological detail that can be altered semi-independ- ently by mass selection. Inferences about the genetic and developmental bases of morphology arise from such information. It is already apparent (MILKMAN 1970; THOMPSON 1980; SCHARLOO 1987; HAYNES 1988; WEBER 1990) that the system of pattern for- mation and cell determination that generates the Dro- sophila wing is capable of many localized adjustments
by selectable genes. For the first time since WADDING-
TON (1939, 1940) surveyed known wing mutants-all rare and with drastic effects-these more recent studies show that many genes with minor effects on wing development are common in all populations. Even in the tiny domain of form studied here, it appears that more loci than one contribute to the genetic variance, because (1) with a single locus and common alleles, line means would not evolve beyond the phenotypic range of the base population, and
(2)
with a single locus and rare alleles, bidirectional response would not continue at steady rates. It would seem improbable anyway that simultaneously opposed effects on growth would be due to a single locus. T h e total number of loci that could affect the region in the long term is likely to be even larger than the number that hap- pened to be polymorphic in two selection lines with 60 founding parents apiece.T h e existence of a large number of positionally responding loci is compatible with theories of field differentiation based on concentration thresholds in gradients of diffusing morphogens (FRENCH, BRYANT and BRYANT 1976; MEINHARDT 1983). Whatever the mechanism of pattern formation, there should be no obstacle to a belief in fine-grained evolutionary plas- ticity based on genes of localized effect. Cuticle grafts on large hemimetabolous insects have already re- vealed that cuticle cells retain fine-grained positional identity, and can intercalate small local structures (LOCKE 1959; BULLIBRE 197 1). Other evidence as well (reviewed in LEWIS and WOLPERT 1976) suggests a high density of positional information controlling 10- calized developmental outcomes. In complex meta-
zoans, late-acting genes with localized effects may form a large component of the genome (see BAILEY
1985, 1986). As the number of discrete selectable domains increases, so must the number of such loci.
Information about the smallest quanta of independ- ent localized variability can also strongly influence ideas of adaptation. Only to the extent that the genetic system permits fluid regional subdivisibility of mor- phology, can the details of organisms adjust gradually and precisely to multidimensional selective pressures. At present, for example, it can be argued that if some fossil feature exhibits a prolonged interval of stasis as an apparent oddity, or within a larger pattern of directional change, the best explanation is a lack of genetic variance in the face of continued natural se-
lection (e.g., BAKKER 1983; BUERCIN et al. 1989). This presupposes an integral genetic system and a paucity of mutable sites with independent, fine-grained local effects.
T h e smallest details of morphology may reveal the most about the versatility of developmental mecha- nisms, and the corresponding scope of potential ad- aptation. For example, although natural selection on the beaks of birds has only been demonstrated in their most obvious aspects such as length and width (GRANT
1986; SMITH 1990), the same agency has clearly shaped much finer bill features with unambiguous functions. Thus in both the woodcock and the kiwi, with their convergent flexible earth-probing beaks, the tip of the upper mandible is extended and en- larged to occupy the same cross-sectional form as the combined upper and lower mandibles occupy more proximally. This small structural detail allows the bills of both species to be thrust into resistant substrates without being forced open. Such a feature could only evolve where the localized genetic variability of mor- phology is extremely fine-grained.
But occasional details whose optimality seems ob- vious do not prove that all details are easily selectable, especially not when the scale is much smaller as in the present case. T h e tips of woodcock and kiwi bills are three to four orders of magnitude larger in volume than the speck of tissue that was investigated in this study. Many biological systems undergo much simpli- fication in the process of miniaturization (RENSCH 1948). Therefore it would have been easy to suppose that the edge of the base of a fruit fly’s wing would be missing a few degrees of developmental freedom.
digits and short central ones, while hoofs of equids have a single symmetrical toe (HOLDER 1983). In other striking examples, the hands of both the lemuriform genus Daubentonia and the phalangerid genus Dacty-
lopsila possess one greatly attenuated finger (the third finger in the first case, the fourth finger in the second), which is highly differentiated from adjacent fingers on either side, as a convergent adaptation for the extraction of wood-boring insect larvae (CARTMILL
1974). These and many other cases argue that the detailed form of the tetrapod limb is not strongly constrained. T h e clustered distribution of morpholo- gies is not patent proof of internal constraints that limit functional optimality: toolboxes also contain clus- tered distributions of shapes.
I t is sometimes assumed that, if we knew the rules of development, we could explain organic forms in terms of limited developmental repertoires. But per- haps adaptive evolution rarely exhausts the morpho- genetic potential of developmental systems. Investi- gation of the autonomous selectabilities of small do- mains addresses this issue.
Useful comments on this paper were given by J. BEATTY, F. COHAN, L. DIGGINS, H. FUKUI, R. LEWONTIN, G . MAYER, H. TOR-
DOFF, D. TOWNSEND, M. TURELLI and five anonymous reviewers, and careful technical assistance was rendered by E. POST. This research was supported by National Institutes of Health grants 5- ROI.GM 21,179; KO4.HD 00638; and ROl.GM 40907.
LITERATURE CITED
ABRAMOWITZ, M., and I . A. STEGUN, 1972 Handbook of Mathe- matical Functions. U.S. Government Printing Office, Washing- ton, D.C.
RLBERCH, P., 1980 Ontogenesis and morphological diversifica- tion. Am. Zool. 2 0 653-667.
ALBERCH, P., 1982 Developmental constraints in evolutionary processes, pp. 31 3-332 in Evolution and Development, edited by J. T . BONNER. Springer-Verlag, Berlin.
ASHBURNER, M., 1982 The genetics of a small autosomal region of Drosophila melanagaster containing the structural gene for alcohol dehydrogenase. 111. Hypomorphic and hypermorphic mutations affecting the expression of Hairless. Genetics 101: 447-459.
BAILEY, D. W., 1985 Genes that affect the shape of the murine mandible. J. Hered. 7 6 107-114.
BAILEY, D. W., 1986 Genes that affect morphogenesis of the murine mandible. J. Hered. 77: 17-25.
BAKKER, R. T., 1983 The deer flees, the wolf pursues: incon- gruencies in predator-prey coevolution, pp. 350-382 in Coe- volution, edited by D. J. FUTUYMA and M. SLATKIN. Sinauer, Sunderland, Mass.
BATESON, W., 1894 Materials f o r the Study of Variation. Macmillan, New York.
BRODSKIY, A. K . , and V. D. IVANOV, 1983 Functional assessment of wing structure in insects. Entomol. Rev. 62: 35-52.
BUERGIN, T., 0 . RIEPPEL, P. M. SANDER and K . TSCHANZ, 1989 The fossils of Monte San Giorgio. Sci. Am. 260: 74- 81.
BULLI~RE, D., 1971 Utilisation de la rkgtnkration intercalaire pour I’ttude de la dktermination cellulaire au cours de la morphogentse chez Blabera craniqer. Dev. Biol. 25: 672-709.
CADE, W. H., 1981 Alternative male strategies: genetic differ-
CARTMILL, M., 1974 Daubentonia, Dactylopsila, woodpeckers and klinorhynchy, pp. 655-670 in Prosimian Biology, edited by R.
D. MARTIN, G . A. DOYLE and A. C. WALKER. Duckworth, London.
CASTLE, W. E., and J. C. PHILLIPS, 1914 Piebald Rats and Selection: An Experimental Test of the Effectiveness of Selection and of the Theory of Gametic Purity in Mendelian Crosses. Carnegie Inst. Wash. Publ. 195.
CHERRY, L. M., S. M. CASE, J. G . KUNKEL and A. C. WILSON, 1979 Comparisons of frogs, humans, and chimpanzees. Sci- ence 204: 435.
CHINNICI, J. P., 1971 Modification of recombination frequency in Drosophila. I. Selection for increased and decreased crossing over. Genetics 6 9 71-83.
CLARKE, J. M., J. MAYNARD SMITH and K. C. SONDHI, 1961 Asymmetrical response to selection for rate of devel- opment in Drosophila subobscura. Genet. Res. 2: 70-81. COCK, A. G., 1966 Genetical aspects of metrical growth and form
in animals. Q. Rev. Biol. 41: 131-190.
COHAN, F. M., 1984 Genetic divergence under uniform selection. I. Similarity among populations of Drosophila melanogaster in their responses to artificial selection for modifiers of E?’. Evo- lution 38: 55-71.
COYNE, J. A,, 1983 Genetic basis of differences in genital mor- phology among three sibling species of Drosophila. Evolution 37: 1101-1 118.
COYNE, J. A,, J. Rux and J. R. DAVID, 1991 Genetics of morpho- logical differences and hybrid sterility between Drosophila se- chellia and its relatives. Genet. Res. 57: 1 13-1 22.
DIAZ-BENJUMEA, F. J., and A. GARC~A-BELLIDO, 1990 Genetic analysis of the wing vein pattern of Drosophila. Roux’s Arch. Dev. Biol. 198: 336-354.
DOBZHANSKY, T., and B. SPASSKY, 1967 Effects of selection and migration on geotactic and phototactic behaviour of Drosophila. I. Proc. R. SOC. Ser. B 168: 27-47.
ENNOS, A. R., 1988 The importance of torsion in the design of insect wings. J. Exp. Biol. 140: 137-160.
FALCONER, D. S . , 1981 Zntroduction to Quantitative Genetics, Ed. 2.
Longman, London.
FRENCH, V., P. J. BRYANT andS. V. BRYANT, 1976 Pattern regu- lation in epimorphic fields. Science 193: 969-980.
GARC~A-BELLIDO, A., 1975 Genetic control of wing disc develop- ment in Drosophila, pp. 161-182 in Cell Patterning (CIBA Foundation Symp. 29). Elsevier, Amsterdam.
GARC~A-BELLIDO, A,, 1983 Comparative anatomy of cuticular pat- terns in the genus Drosophila, pp. 227-255 in Development and Evolution, edited by B. C. GOODWIN, N. HOLDER and C. C. WYLIE. Cambridge University Press, Cambridge.
GOODWIN, B. C., 1984 Changing from an evolutionary to a gen- erative paradigm in biology. pp. 99-1 20 in Evolutionary Theory: Paths into the Future, edited by J. W. POLLARD. W y k New York.
GRANT, p. R., 1986 Ecology and Evolution of Darwin’s Finches. Princeton University Press, Princeton, N.J.
HAYNES, A. K., 1988 Developmental constraints in the Drosophila wing. Ph.D. thesis, Harvard University.
HILL, w . G . , 1972 Estimation of realised heritabilities from selec- tion experiments. 11. Selection in one direction. Biometrics 28: 767-780.
HOLDER, N . , 1983 Developmental constraints and the evolution of vertebrate digit patterns. J. Theor. Biol. 104: 45 1-47 1.
HOLM, S . , 1979 A simple sequentially rejective multiple test pro- cedure. Scand. J . Stat. 6 65-70.
HORDER, T . J., 198 1 On not throwing the baby out with the bath water. Evol. Today 2: 163-180.
directed movement) in laboratory and wild-caught populations of Drosophila. Behav. Genet. 12: 281-293.
LANDE, R., 198 1 The minimum number of genes contributing to quantitative variation between and within populations. Ge- netics 9 9 541-553.
LEWIS, J. H., and L. WOLPERT, 1976 The principle of non- equivalence in development. J. Theor. Biol. 6 2 479-490. LINDSLEY, D. L., and E. H. GRELL, 1968 Genetic Variations of
Drosophila melanogaster. Carnegie Inst. Wash. Publ. 627. LOCKE, M., 1959 The cuticular pattern in an insect, Rhodnius
prolixus Stal. J. Exp. Biol. 3 6 459-477.
MACDOWELL, E. C., 1917 Bristle inheritance in Drosophila. 11. Selection. J. Exp. Zool. 23: 109-146.
MASRY, A. M., and F. W. ROBERTSON, 1978 Cell size and number in the Drosophila wing. I. The use of selection to study the interrelations between cell size and number and body size. Egypt. J. Genet. Cytol. 7: 137-165.
MAYNARD SMITH, J., and K. C. SONDHI, 1960 The genetics of a pattern. Genetics 45: 1039-1050.
MEINHARDT, H., 1983 Cell determination boundaries as organiz- ing regions for secondary embryonic fields. Dev. Biol. 9 6 375- 385.
MILKMAN, R., 1970 The genetic basis of natural variation in Drosophila melanogaster. Adv. Genet. 15: 55-1 14.
NACHTIGALL, W., 198 1 Der Vorderfluegel grosser Heuschrecken als Luftkrafterzeuger. J. Comp. Physiol. 142: 127-134. NORBERG, R. A., 1972 The pterostigma of insect wings an inertial
regulator of wing pitch. J. Comp. Physiol. 81: 9-22.
PATERNIANI, E., 1969 Selection for reproductive isolation be- tween two populations of maize, Zea mays L. Evolution 23: 534-547.
PENNYCUIK, P. R., and J. M. RENDEL, 1977 Selection for constancy of score and pattern of secondary vibrissae in TalTa-Ta/Y and
Tu/+ mice. Aust. J. Biol. Sci. 3 0 303-317.
PLUNKETT, C. R., 1926 The interaction of genetic and environ- mental factors in development. J. Exp. Zool. 46: 181-244. RAFF, R. A., and T. C. KAUFMAN, 1983 Embryos, Genes, and
Evolution. Macmillan, New York.
REEVE, E. C. R., 1961 Modifying the sternopleural hair pattern in Drosophila by selection. Genet. Res. 2: 158-160.
RENDEL, J. M., and B. L. SHELDON, 1960 Selection for canalization of the scute phenotype in Drosophila melanogaster. Aust. J. Biol. Sci. 13: 36-47.
RENSCH, B., 1948 Histological changes correlated with evolution- ary changes of body size. Evolution 2: 2 18-230.
RICE, W. R., 1989 Analyzing tables of statistical tests. Evolution
ROBERTSON, F. W., 1957 Studies in quantitative inheritance. X. Genetic variation of ovary size in Drosophila. J. Genet. 55: 410- 427.
ROBERTSON, F. W., 1962 Changing the relative size of the body parts of Drosophila by selection. Genet. Res. 3: 169-180. ROFF, D. A., and T. A. MOUSSEAU, 1987 Quantitative genetics
and fitness: lessons from Drosophila. Heredity 58: 103-1 18. 43: 223-225.
SCHARLOO, W., 1964 The effect of disruptive and stabilizing selection on the expression of a cubitus interruptus mutant in Drosophila. Genetics 50: 553-562.
SCHARLOO, W., 1987 Constraints in selection response, pp. 125- 149 in Genetic Constraints on Adaptive Evolution, edited by V.
LOESCHKE. Springer-Verlag, Berlin.
SIMON, C., 1983 Morphological differentiation in wing venation among broods of 13- and 17-year periodical cicadas. Evolution 37: 104-115.
SMITH, T. B., 1990 Natural selection on bill characters in the two bill morphs of the African finch Pyrenestes ostrinus. Evolution
SPICER, G. S., 1991 The genetic basis of a species-specific charac- ter in the Drosophila virilis species group. Genetics 128: 331- 337.
SPICKETT, S. G . , 1963 Genetic and developmental studies of a quantitative character. Nature 1 9 9 870-873.
STOCK, G. B., and S. V. BRYANT, 1981 Studies of digit regenera- tion and their implications for theories of development and evolution of vertebrate limbs. J. Exp. 2001. 216 423-433. STRAUSS, R. E., 1990 Patterns of quantitative variation in Lepi-
dopteran wing morphology: the convergent groups Heliconi- inae and Ithomiinae (Papilionoidea: Nymphalidae). Evolution 4 4 86-103.
TEMPLETON, A. R., 1977 Analysis of head shape differences between two interfertile species of Hawaiian Drosophila. Evo- lution 31: 630-641.
THOMPSON, J. N., 1974a Studies on the nature and function of polygenic loci in Drosophila. I . Comparison of genomes from selection lines. Heredity 33: 373-387.
THOMPSON, J. N., 1974b Studies on the nature and function of polygenic loci in Drosophila. 11. The subthreshold wing vein pattern revealed in selection experiments. Heredity 33: 389- 401.
THOMPSON, J. N., 1980 Pattern compensation in Drosophila wing vein development. Heredity 44: 93-102.
TRYON, R. C., 1940 Genetic differences in maze-learning ability in rats. Yearb. Natl. SOC. Study Educ. 39: 11 1-1 19.
WADDINGTON, C. H., 1939 Preliminary notes on the development of the wings in normal and mutant strains of Drosophila Natl. Acad. Sci. Proc. 25: 299-307.
WADDINGTON, C. H., 1940 Urganisers and Genes. Cambridge Uni- versity Press, Cambridge.
WEBER, K. E., 1988 A system for rapid morphometry of whole, live flies. Drosopila Inform. Serv. 67: 97-102.
WEBER, K. E., 1990 Artificial selection on wing allometry in Drosophila melanogaster. Genetics 126: 975-989.
WOOTTON, R. J., 1981 Support and deformability in insect wings.
J. 2001. 193: 447-468.
WOOTTON, R. J., 1990 The mechanical design of insect wings. Sci. Am. 263: 114-120,
WRIGHT, S., 1965 Factor interaction and linkage in evolution. Proc. R. SOC. Ser. B 162: 80-104.
44: 832-842.