Division I
Statistical Analysis of Weibull Estimation Uncertainty for Crack Initiation
Testing Through Monte Carlo Simulation
Jae Phil Park1, and Chi Bum Bahn2
1 Graduate Student, Mechanical Engineering, Pusan National University, Korea 2 Professor, Mechanical Engineering, Pusan National University, Korea
ABSTRACT
Because a large time spread in most crack initiation tests makes it a daunting task to predict the initiation time of cracking, a probabilistic model, such as the Weibull distribution, has been usually employed to model it. In this case, although it might be anticipated to develop a more reliable cracking model under ideal cracking test conditions (e.g., large number of specimen, narrow censoring interval, etc.), it is not straightforward to quantitatively assess the effects of these experimental conditions on model estimation uncertainty. Therefore, we studied the effects of some key experimental conditions on estimation uncertainties of the Weibull parameters through the Monte Carlo simulations. Simulation results suggested that the estimated scale parameter would be more reliable than the estimated shape parameter from the tests. It was also shown that increasing the number of specimen would be more efficient to reduce the uncertainty of estimators than the more frequent censoring.
1. INTRODUCTION
It is widely known that stress corrosion cracking (SCC) can result in loss-of-coolant accidents in nuclear reactors [Scott and Meunier (2007), Lunceford et al. (2013), Kim and Do (2015)]. Thus, the prediction of the SCC initiation time is a very important task for several researchers in nuclear science. However, it is very difficult due to the complex mechanism of SCC initiation, which is not clearly identified yet. Therefore, empirical SCC initiation models are generally adopted for this purpose [Amzallag et al. (1999), Garud (2009), Erickson et al. (2011)].
However, most SCC experiments showed non-negligible scatter with respect to cracking time [Troyer et al. (2015)], although all of the experimental conditions (e.g., temperature, tensile stress, etc.) were strictly controlled. Therefore, a probabilistic model was frequently used as an SCC initiation model to quantitatively consider the time scatter. Particularly, the Weibull distribution [Weibull (1951)], which can generally consider the effect of the time-dependent degradation of a material, is widely accepted as a probabilistic model of SCC initiation time [Hwang et al. (2001), Eason (2005), Erickson et al. (2011)].
To obtain the model parameters of SCC initiation (i.e., Weibull parameters in this case), a cracking test must be performed. The typical procedure of a cracking test involves an interval-censored reliability test. This implies that several stressed specimens (e.g., U-bend or constant tensile stress specimens) are exposed to a corrosive environment and censored at every scheduled time. Following the test, the testing results can be used to estimate the Weibull parameters typically using the maximum likelihood estimation (MLE) [McCool (2012)]. It is expected that the reliability of the estimated Weibull parameters would increase with an increase in the number of test specimens and a smaller length of the censoring interval (LCI). However, there is no theory yet available to calculate the exact estimation uncertainties for the estimated Weibull parameters with interval-censored data [McCool (2012)]. Therefore, in this study, the effects of some key experimental conditions on estimation uncertainties of Weibull parameters were investigated through the Monte Carlo simulation.
A two-parameter Weibull distribution that is frequently used as a cracking probability model can be represented with the following cumulative distribution function (CDF):
𝐹(𝑡; 𝛽, 𝜂) = 1 − exp [− (𝑡 𝜂)
𝛽
], (1)
where 𝑡 ≥ 0 denotes time, 𝛽 > 0 denotes the shape parameter and 𝜂 > 0 denotes the scale parameter of the Weibull distribution.
As previously mentioned, maximum likelihood estimation (MLE) is usually used to estimate the Weibull parameters from the given test data for its good estimation efficiency [Genschel and Meeker (2010), Park and Bahn (2016)]. MLE method uses the cracking time information of each specimen. The MLE method estimates the parameters of the Weibull distribution directly by using the likelihood function. The likelihood function for the interval-censored case is given by:
𝐿(𝛽, 𝜂) = ∏[1 − 𝐹(𝑠𝑖; 𝛽, 𝜂)] ∙ ∏[𝐹(𝑐𝑗𝑈; 𝛽, 𝜂) − 𝐹(𝑐𝑗𝐿; 𝛽, 𝜂)]
𝐶
𝑗=1 𝑆
𝑖=1
(2)
where S is the number of suspended specimens, 𝑠𝑖 is the last censoring time of ith suspended specimen, C is the number of interval-censored cracked specimens, and 𝑐𝑗𝑈 and 𝑐𝑗𝐿 are the upper and lower bound times, respectively, of the censoring interval for the jth cracking. The sum of S and C is equal to the total number of specimens N.
The use of log-likelihood is convenient to determine the Weibull parameters that maximize the likelihood function (i.e., arg max
(𝛽,𝜂) 𝐿(𝛽, 𝜂)). The log-likelihood function is as follows:
𝑙(𝛽, 𝜂) = ln 𝐿(𝛽, 𝜂)
= ∑𝑆 ln[1 − 𝐹(𝑠𝑖; 𝛽, 𝜂)]
𝑖=1 + ∑ ln[𝐹(𝑐𝑗𝑈; 𝛽, 𝜂) − 𝐹(𝑐𝑗𝐿; 𝛽, 𝜂)] 𝐶
𝑗=1 .
(3)
The maximum likelihood point is obtained where both partial derivatives of 𝑙(𝛽, 𝜂) reach zero. Therefore, the maximum likelihood point is given by:
{ 𝜕
𝜕𝛽𝑙(𝛽, 𝜂) = 0 𝜕
𝜕𝜂𝑙(𝛽, 𝜂) = 0
(4)
Substituting Equations (1) and (3) into Equation (4), we can obtain the final simultaneous equation:
{
∑ [− (𝑠𝑖 𝜂)
𝛽
ln (𝑠𝑖 𝜂)] 𝑆 𝑖=1 + ∑ [ − (𝑐𝑗𝐿 𝜂 ) 𝛽
ln (𝑐𝑗𝐿
𝜂 ) exp [− ( 𝑐𝑗𝐿 𝜂 ) 𝛽 ] + (𝑐𝑗𝑈 𝜂 ) 𝛽
ln (𝑐𝑗𝑈
𝜂 ) exp [− ( 𝑐𝑗𝑈
𝜂 )
𝛽
]
exp [− (𝑐𝑗𝐿
𝜂 )
𝛽
] − exp [− (𝑐𝑗𝑈
𝜂 ) 𝛽 ] ] = 0 𝐶 𝑗=1 ∑ [(𝛽 𝜂) ( 𝑠𝑖 𝜂) 𝛽 ] 𝑆 𝑖=1 + ∑ [ (𝛽 𝜂) (𝑐𝑗𝐿 𝜂 ) 𝛽
exp [− (𝑐𝑗𝐿
𝜂 )
𝛽
] − (𝑐𝑗𝑈
𝜂 )
𝛽
exp [− (𝑐𝑗𝑈
𝜂 )
𝛽
]
exp [− (𝑐𝑗𝐿
𝜂 )
𝛽
] − exp [− (𝑐𝑗𝑈
𝜂 ) 𝛽 ] ] 𝐶 𝑗=1 = 0 (5)
It would be extremely difficult to determine a general analytical solution for Equation (5); therefore, we used a numerical approach. In this case, the MATLAB (R2015b, MathWorks, Natick, MA, USA, 2015) offers the numerical nonlinear simultaneous equation solver fsolve.
3. MONTE CARLO SIMULATION
effects. The experimental factors considered in the simulation study include (1) true Weibull parameters; (2) the number of specimens; (3) end cracking fractions (ECF); and (4) length of censoring interval (LCI).
3.1. True Weibull Parameters
It could be reasonably assumed that the inherent cracking probability was Weibull distributed at a macroscopic scale [Park et al. (2017)]. The study investigated as to whether the estimation uncertainties were affected by the parameters of the given Weibull distribution (i.e., inherent cracking probability behavior). These were termed as the true Weibull parameters (𝛽𝑡𝑟𝑢𝑒, 𝜂𝑡𝑟𝑢𝑒), which are generally unknown to experimenters.
It should be noted that the scale parameter 𝜂 was considered as a nuisance parameter in several applications [Hampel et al. (2011)]. For example, if the relative errors (RE) of estimators that were defined as follows:
RE(𝛽̂) = 𝛽̂ − 𝛽𝑡𝑟𝑢𝑒
𝛽𝑡𝑟𝑢𝑒 ; RE(𝜂̂) =
𝜂̂ − 𝜂𝑡𝑟𝑢𝑒
𝜂𝑡𝑟𝑢𝑒 ,
(6)
were affected by the value of the true scale parameter (𝜂𝑡𝑟𝑢𝑒), then only changing the time unit (e.g., hours to seconds) could affect the relative estimation errors. This is contradictory. Therefore, the 𝜂𝑡𝑟𝑢𝑒 is just a scale factor, and relative estimation errors should not be affected by the value of 𝜂𝑡𝑟𝑢𝑒 [Genschel and Meeker (2010)]. Without loss of generality, the value of 𝜂𝑡𝑟𝑢𝑒 was fixed at 100 in this simulation study.
Nevertheless, the value of the true Weibull shape parameter (𝛽𝑡𝑟𝑢𝑒) could be a factor affecting the relative estimation errors. Therefore, the shape parameter was a main parameter of the Weibull distribution [Hampel et al. (2011)]. Several values of 𝛽𝑡𝑟𝑢𝑒 (2, 3 and 4) were selected as the simulation inputs. In previous studies, the value of the estimated Weibull shape parameter for an SCC initiation time ranged from two to four [Dozaki et al. (2010), Erickson et al. (2011), Hong et al. (2012), Garud (2010)].
3.2. Number of Specimens
It is expected that the estimated Weibull parameters (i.e., 𝛽̂, 𝜂̂) could be reliable with a large number of specimens. However, the SCC initiation test for nuclear reactor materials requires a corrosive environment with high temperatures and pressures. Thus, it is difficult to test a large number of specimens simultaneously. Hence, the simulation range of the specimen number was set from 5 to 50.
3.3. End Cracking Fraction
During the performance of the SCC test, cracking does not necessarily occur for every specimen within the available testing time. Thus, the test duration was considered as a factor of estimation uncertainties in an earlier study [Park and Bahn (2016)]. However, the results indicated that there were deficiencies to using the test duration as a factor of estimation uncertainties. First, experimenters do not know their relative test duration (RTD), which is defined as follows:
RTD =(Test duration)
𝜂𝑡𝑟𝑢𝑒 , (7)
this is because the experimenters do not know the exact value of 𝜂𝑡𝑟𝑢𝑒. Additionally, it is possible to continue the simulation even after all of the specimens cracked when the test duration is used as a fixed input for a simulation study [Park and Bahn (2016)]. Therefore, the end cracking fraction (ECF) is considered as an alternative factor of estimation uncertainties. For example, if the value of ECF corresponded to 0.6, then the test ended when more than or equal to 60% of the specimens cracked. The simulation range for ECF was set from 0.6 to 1.0.
It is expected that a shorter LCI is better to estimate reliable Weibull parameters. However, frequent censoring causes inconveniences for experimenters. Thus, it is important to set a reasonable LCI for a cracking test. In order to investigate the general effect of LCI, the simulation range for startingLCIwas set from 5% to 50% of 𝜂𝑡𝑟𝑢𝑒, although the value of 𝜂𝑡𝑟𝑢𝑒 was unknown in the real testing case. It is assumed that length of censoring interval does not vary with time.
3.5. Simulation Range
Table 1 shows the simulation range of the study. A total of 900 (= 1 × 3 × 10 × 3 × 10) experimental cases were considered, and 20,000 random iterations were performed for each experimental case. From the resulting simulation data, the Weibull estimators (i.e., 𝛽̂, 𝜂̂) were calculated by the MLE method.
Table 1: Experimental factors considered in the Monte Carlo simulation
True Weibull Parameters
Number of Specimens ECF LCI
(% of 𝛈𝐭𝐫𝐮𝐞) 𝜼𝒕𝒓𝒖𝒆
(Dim’less Time) 𝜷𝒕𝒓𝒖𝒆
100 2 5 0.6 5
- 3 10 0.8 10
- 4 15 1.0 15
- - 20 - 20
- - 25 - 25
- - 30 - 30
- - 35 - 35
- - 40 - 40
- - 45 - 45
- - 50 - 50
4. Results and Discussion
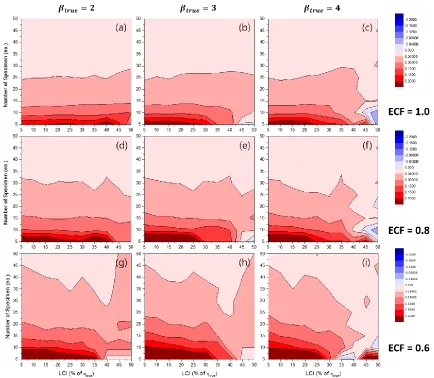
Figure 2. Effects of the number of specimens and LCI on RE50%(𝛽̂𝑀𝐿𝐸) when ECF = 1.0 and (a) 𝛽𝑡𝑟𝑢𝑒 =
2, (b) 𝛽𝑡𝑟𝑢𝑒 = 3, (c) 𝛽𝑡𝑟𝑢𝑒= 4; when ECF = 0.8 and (d) 𝛽𝑡𝑟𝑢𝑒= 2, (e) 𝛽𝑡𝑟𝑢𝑒= 3, (f) 𝛽𝑡𝑟𝑢𝑒 = 4; when ECF = 0.6 and (g) 𝛽𝑡𝑟𝑢𝑒 = 2, (h) 𝛽𝑡𝑟𝑢𝑒 = 3, (i) 𝛽𝑡𝑟𝑢𝑒 = 4 [Park et al. (2017)].
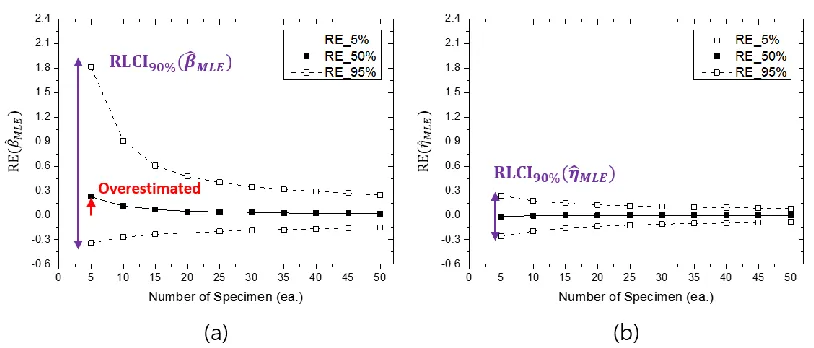
From the random simulation results, the 5th, 50th and 95th percentiles (𝛽̂5%, 𝛽̂50%, 𝛽̂95%; 𝜂̂5%, 𝜂̂50%,
𝜂̂95%) of 20,000 replicates of Weibull estimates could be derived for each case. The selected median estimates (i.e., 𝛽̂50%, 𝜂̂50%) were converted to the relative error (RE50%) to represent the bias of estimators, which is defined as follows:
RE50%(𝛽̂) = RE(𝛽̂50%) =
𝛽̂50%− 𝛽𝑡𝑟𝑢𝑒
𝛽𝑡𝑟𝑢𝑒 ; RE50%(𝜂̂) = RE(𝜂̂50%) =
𝜂̂50%− 𝜂𝑡𝑟𝑢𝑒
𝜂𝑡𝑟𝑢𝑒 . (8)
In order to quantify the dispersion of estimators, a relative length of a 90% confidence interval (RLCI90%) was utilized, which is defined as follows:
barely noticeable even when the number of specimens is low (i.e., SE50%(𝜂̂MLE) ≈ 0). The relative length of 90% confidence interval (i.e., RLCI90%(𝜂̂𝑀𝐿𝐸)) are much lower than that of the shape parameter β (i.e.,
RLCI90%(𝛽̂𝑀𝐿𝐸)).
4.1. Uncertainty of 𝜷̂𝑴𝑳𝑬
Figure 2 shows the contour plots of RE50%(β̂MLE), indicating a relative estimation bias in the Weibull shape parameter. It was likely that 𝛽̂𝑀𝐿𝐸 showed a tendency to be overestimated irrespective of the value of ECF and 𝛽𝑡𝑟𝑢𝑒 when the number of specimens was relatively small. It is shown that the value of LCI does not much affect RE50%(𝛽̂𝑀𝐿𝐸) especially when the ECF is relatively high. The unusual result that occurred in the long LCI region may not be reliable due to the low convergence ratio [Park et al. (2017)].
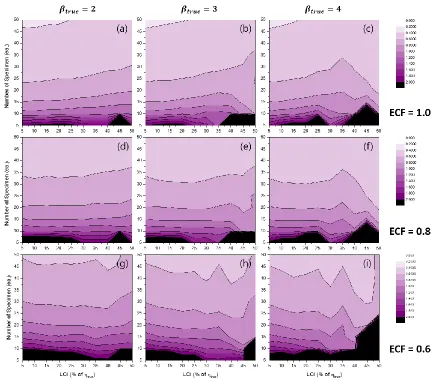
Figure 3. Effects of the number of specimens and LCI on RLCI90%(𝛽̂𝑀𝐿𝐸) when ECF = 1.0 and (a)
𝛽𝑡𝑟𝑢𝑒 = 2, (b) 𝛽𝑡𝑟𝑢𝑒 = 3, (c) 𝛽𝑡𝑟𝑢𝑒 = 4; when ECF = 0.8 and (d) 𝛽𝑡𝑟𝑢𝑒 = 2, (e) 𝛽𝑡𝑟𝑢𝑒= 3, (f) 𝛽𝑡𝑟𝑢𝑒 =
4; when ECF = 0.6 and (g) 𝛽𝑡𝑟𝑢𝑒= 2, (h) 𝛽𝑡𝑟𝑢𝑒 = 3, (i) 𝛽𝑡𝑟𝑢𝑒= 4 [Park et al. (2017)].
(2016)]. The gradients of RLCI90%(𝛽̂) were very high around the critical region. It is likely that this critical region was an inherent behavior of estimation uncertainty because another estimation method, which a unity convergence ratio for the same experimental condition, also showed the critical region [Park et al. (2017)]. Experimenters should plan the crack initiation testing so that they can avoid this critical region.
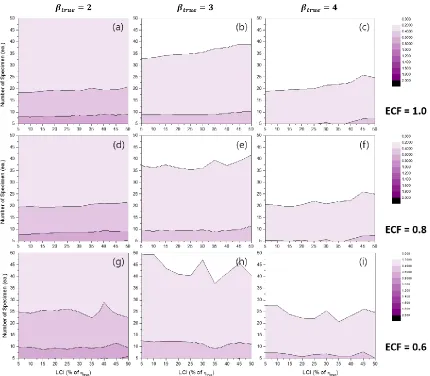
4.2. Uncertainty of 𝜼̂𝑴𝑳𝑬
Figures 4 shows the contour plots of RE50%(𝜂̂𝑀𝐿𝐸). The simulation results indicated that the value of
RE50%(𝜂̂𝑀𝐿𝐸) was almost zero in every experimental condition. This suggests that 𝜂̂𝑀𝐿𝐸 is always reliable irrespective of the combination of experimental conditions in the simulation study.
Figure 4. Effects of the number of specimens and LCI on RE50%(𝜂̂𝑀𝐿𝐸) when ECF = 1.0 and (a) 𝛽𝑡𝑟𝑢𝑒 =
2, (b) 𝛽𝑡𝑟𝑢𝑒 = 3, (c) 𝛽𝑡𝑟𝑢𝑒= 4; when ECF = 0.8 and (d) 𝛽𝑡𝑟𝑢𝑒= 2, (e) 𝛽𝑡𝑟𝑢𝑒= 3, (f) 𝛽𝑡𝑟𝑢𝑒 = 4; when ECF = 0.6 and (g) 𝛽𝑡𝑟𝑢𝑒 = 2, (h) 𝛽𝑡𝑟𝑢𝑒 = 3, (i) 𝛽𝑡𝑟𝑢𝑒 = 4 [Park et al. (2017)].
low; and (3) the value of 𝛽𝑡𝑟𝑢𝑒 was small. LCI showed no noticeable effect on RLCI90%(𝜂̂𝑀𝐿𝐸). The critical region did not appear in the case of RLCI90%(𝜂̂𝑀𝐿𝐸).
Figure 5. Effects of the number of specimens and LCI on RLCI90%(𝜂̂𝑀𝐿𝐸) when ECF = 1.0 and (a)
𝛽𝑡𝑟𝑢𝑒 = 2, (b) 𝛽𝑡𝑟𝑢𝑒 = 3, (c) 𝛽𝑡𝑟𝑢𝑒 = 4; when ECF = 0.8 and (d) 𝛽𝑡𝑟𝑢𝑒 = 2, (e) 𝛽𝑡𝑟𝑢𝑒= 3, (f) 𝛽𝑡𝑟𝑢𝑒 =
4; when ECF = 0.6 and (g) 𝛽𝑡𝑟𝑢𝑒= 2, (h) 𝛽𝑡𝑟𝑢𝑒 = 3, (i) 𝛽𝑡𝑟𝑢𝑒= 4 [Park et al. (2017)].
5. Conclusions
The main goal of this study is to provide quantitative estimation uncertainties for experimenters developing a Weibull distribution model via cracking tests. The MLE method was performed with respect to the Weibull estimation. Monte Carlo simulations were used in order to quantify uncertainties estimators in various experimental conditions by considering the effects of: (1) true Weibull parameters; (2) the number of specimens; (3) end cracking fractions; and (4) length of censoring interval. The following conclusions were drawn from the study:
In most cases, 𝛽̂𝑀𝐿𝐸 showed a tendency to be overestimated and dispersed when the number of specimens was small and the value of ECF was low. The value of LCI does not much affect bias of
𝜂̂𝑀𝐿𝐸 showed almost zero bias in all simulation ranges. In most cases, the LCI did not affect the estimation uncertainty of 𝜂̂. The overall bias and dispersion of 𝜂̂ were much lower than those of 𝛽̂ in the simulation study range. Therefore, the estimated scale parameter would be more reliable than the estimated shape parameter from the cracking tests. It was also shown that increasing the number of specimen would be more efficient to reduce the uncertainty of estimators than the more frequent censoring.
ACKNOWLEDGMENTS
This work was supported by “Nuclear Safety Research Program” through the Korea Foundation of Nuclear Safety (KOFONS) granted financial resource from the Nuclear Safety and Security Commission (NSSC), Republic of Korea (No. 1403006), and was supported by “Human Resources Program in Energy Technology” of the Korea Institute of Energy Technology Evaluation and Planning (KETEP), who granted the financial resources from the Ministry of Trade, Industry & Energy, Korea. (No. 20164010201000).
REFERENCES
Amzallag, C., S. L. Hong, C. Pages and A. Gelpi (1999). “Stress Corrosion Life Assessment of Alloy 600 PWR Components,” 9th International Symposium on Environmental Degradation of Materials in
Nuclear Power Systems - Water Reactors, The Minerals Metals and Materials Society.
Dozaki, K., D. Akutagawa, N. Nagata, H. Takihuchi and K. Norring (2010). "Effects of dissolved hydrogen condtent in PWR primary water on PWSCC initiation property," E-Journal of Advanced Maintenance
2: 65-76.
Eason, E. (2005). Materials Reliability Program: Effects of Hydrogen, pH, Lithium and Boron on Primary Water Stress Corrosion Crack Initiation in Alloy 600 for Temperatures in the Range 320 – 330°C
(MRP-147). Palo Alto, CA, USA, EPRI.
Erickson, M., F. Ammirato, B. Brust, D. Dedhia, E. Focht, M. Kirk, C. Lange, R. Olsen, P. Scott, D. Shim, G. Stevens and G. White (2011). Models and Inputs Selected for Use in the xLPR Pilot Study. Palo Alto, CA, USA, EPRI.
Garud, Y. S. (2009). Stress Corrosion Cracking Initiation Model for Stainless Steel and Nickel Alloys. Palo Alto, CA, USA, EPRI.
Garud, Y. S. (2010). “SCC initiation model and its implementation for probabilistic assessment,” ASME Pressure Vessels & Piping Division.
Genschel, U. and W. Q. Meeker (2010). "A comparison of maximum likelihood and median-rank regression for Weibull estimation," Quality Engineering 22(4): 236-255.
Hampel, F. R., E. M. Ronchetti, P. J. Rousseeuw and W. A. Stahel (2011). Robust statistics: the approach based on influence functions, John Wiley & Sons.
Hong, J. D., C. Jang and T. S. Kim (2012). "PFM APPLICATION FOR THE PWSCC INTEGRITY OF Ni-BASE ALLOY WELDS - DEVELOPMENT AND APPLICATION OF PINEP-PWSCC,"
Nuclear Engineering and Technology 44(8): 961-970.
Hwang, I. S., S. U. Kwon, J. H. Kim and S. G. Lee (2001). "An Intraspecimen Method for the Statistical Characterization of Stress Corrosion Crack Initiation Behavior," Corrosion 57(9): 787-793.
Kim, K. J. and E. S. Do (2015). Technical Report: Inspection of Bottom Mounted Instrumentation Nozzle
(in Korean). Daejeon, Korea, Korea Institute of Nuclear Safety (KINS).
Lunceford, W., T. DeWees and P. Scott (2013). EPRI Materials Degradation Matrix, Rev. 3. Palo Alto, CA, USA, EPRI.
McCool, J. (2012). Using the Weibull Distribution: Reliability, Modeling, and Inference. Hoboken, N.J., USA, John Wiley & Sons.
Park, J. P., C. Park, J. Cho and C. B. Bahn (2017). "Effects of Cracking Test Conditions on Estimation Uncertainty for Weibull Parameters Considering Time-Dependent Censoring Interval," Materials
10(1): 3.
Scott, P. and M.-C. Meunier (2007). Materials Reliability Program: Review of Stress Corrosion Cracking
of Alloys 182 and 82 in PWR Primary Water Service (MRP-220). Palo Alto, CA, USA, EPRI.
Troyer, G., S. Fyfitch, K. Schmitt, G. White and C. Harrington (August 9-13, 2015). “DISSIMILAR METAL WELD PWSCC INITIATION MODEL REFINEMENT FOR XLPR PART I: A SURVEY OF ALLOY 82/182/132 CRACK INITIATION LITERATURE,” 17th International Conference on
Environmental Degradation of Materials in Nuclear Power Systems - Water Reactors, Ottawa,
Ontario, Canada.
Weibull, W. (1951). "A statistical distribution function of wide applicability," Journal of applied mechanics