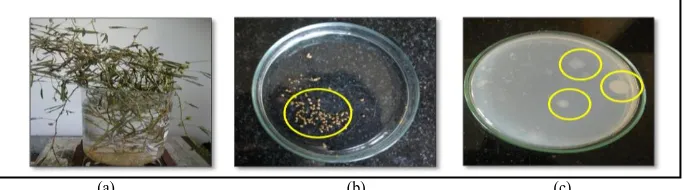
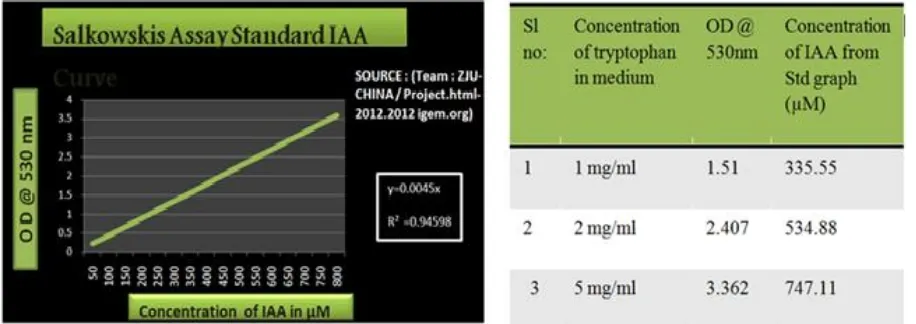
A Study on Plant Growth Promoting Activity of the Endophytic Bacteria Isolated from the Root Nodules of Mimosa Pudica Plant
Full text
Figure


Related documents
Autologous serum application containing doxycycline shows the influence on the improvement of acne vulgaris lesions where we know that the pathogenesis of acne
The power absorption dynamics of electrons and the electrical asymmetry effect in capacitive radio-frequency plasmas operated in CF4 and driven by tailored voltage waveforms are
There may be effective technologies helping the management in managing the talent, but the employees will expect great piece of technology at their disposal for performing
Astaxanthin can protect against damage from ischemia (Ischemia is the condition where there is a deficient supply of blood to the brain as a result of an
Furthermore, at all doses myostatin caused a larger increase in mean luciferase activ- ity in the presence of FHL1 than in its absence ( Fig. These data show that FHL1 increases
Since the operating cost is insensitive to reactive loading of a generator, the manner in which the reactive load of the station is shared among various online generators does
Following the correction of soil acidity on parts of the experiment in the 1950s a review of the treatments and management led to a number of modifications being introduced in 1968.
Table 1 Number of initially positive plots (among the 40 initial random plots per zone), added positive plots, added negative plots (from ACS), and individual trees ≥ 6cm of the
