ABSTRACT
FRANKL, BERNARD ANTHONY. Structural Behavior of Insulated Precast Prestressed Concrete Sandwich Panels Reinforced with CFRP Grid. (Under the direction of Sami H. Rizkalla, Ph.D.)
Precast prestressed concrete sandwich wall panels are typically used for the construction
of building envelopes. Such panels consist of two layers of concrete separated by a layer of
rigid foam insulation. Panels are typically designed to carry gravity loads from floors and
roofs, to resist transverse lateral loads due to wind, to insulate a structure, and to provide
specific interior and exterior finished wall surfaces.
Insulated concrete sandwich panels may be designed to resist gravity and lateral loads in
a non-composite, partially composite or fully composite action. A fully composite panel is
designed to allow utilization of the two concrete wythes acting in composite action to resist
the applied loads. For panels designed as fully non-composite, each of the concrete wythes
act independently to resist the applied loads. The partially composite panel has an
intermediate behavior.
This thesis summarizes a research program undertaken to study the behavior of
prestressed concrete sandwich panels reinforced with carbon fiber reinforced polymer
(CFRP) shear grid to achieve the composite action between the two concrete wythes. The
experimental program consists of six precast prestressed concrete sandwich panels measuring
20 ft tall by 12 ft wide by 8 in thick that were tested vertically in a steel frame. The panels
were subjected to gravity loads and reverse-cyclic lateral loading to simulate 50 years service
life of the structure. The various parameters considered in the experimental program were
and the presence of solid concrete zones. Each panel was instrumented to measure gravity
and lateral loads, lateral deflections, and concrete strains to evaluate the behavior as affected
by these parameters.
Test results and observed behavior of the panels under applied load indicates that the
stiffness and the panel degradation behavior are dependant on the relative wythe thicknesses,
the quantity of carbon shear grid and the type of foam. In general, an increase in relative
wythe thickness or quantity of carbon shear grid increases the stiffness and reduces the
degradation behavior. Ultimate load carrying capacity and composite action can be increased
by using Expanded Polystyrene foam (EPS) in comparison to Extruded Polystyrene foam
(XPS).
Typical failure mode was characterized by failure at the top of the panel near the corbels.
Failure of the adequately reinforced panels with CFRP grid exhibited simultaneous
flexural-shear cracking followed by separation of the concrete wythes.
The degree of composite action was evaluated with respect to deflection. The percent
composite action with respect to deflection is based on comparing the measured deflection to
the theoretical composite and non-composite deflections of the panel. Results indicated that
EPS foam exhibited superior bond than XPS foam resulting in a higher level of composite
action. It was also found that a 4-2-2 configuration (4 inch inner concrete wythe thickness)
significantly showed improved behavior in comparison to a 2-4-2 (2 inch inner concrete
wythe thickness) configuration and solid zones of concrete were the most structurally
Structural Behavior of Insulated Precast Prestressed Concrete Sandwich Panels
Reinforced with CFRP Grid
by
Bernard Anthony Frankl
A thesis submitted to the Graduate Faculty of North Carolina State University
in partial fulfillment of the requirements for the Degree of
Master of Science
Civil Engineering
Raleigh, North Carolina
2008
APPROVED BY:
________________________________ ____________________________
Rudolf Seracino, Ph.D. Michael L. Leming, Ph.D.
DEDICATION
To my loving wife Nicole Marie Carr Frankl and my son Keith Driver Frankl. Without the love and support of my family, this thesis would not have been possible. They are the
light, meaning and inspiration of my life. I would also like to dedicate this thesis to my
BIOGRAPHY
Bernard Anthony Frankl received his Master of Science in Civil Engineering (MSCE) at
North Carolina State University (NCSU), Summa Cum Laude, in 2008, with an emphasis in
structural design. He received his Bachelor of Science in Civil Engineering (BSCE) at South
Dakota School of Mines and Technology (SDSM&T), Summa Cum Laude, in 2006, with an
emphasis in structural and geotechnical design.
Bernard had the opportunity to develop his technical skills when he began working for
Dick Anderson Construction in Montana the summers of 2000 through 2003. With
construction experience and excellent grades, he was honored by interning with
Morrison-MaierleInc. the summer of 2004. While his primary duties included site survey work, he
learned the value of design specifications, construction oversight, and technical data
collection. He then accepted a research position at SDSM&T with Dr. Sangchul Bang as
well as with the Advanced Materials Processing Center. Along with planning and executing
research experiments, he had the opportunity to develop his teaming and leadership abilities
by becoming a leader of the SDSM&T organization Center of Excellence for Advanced
Manufacture and Production (CAMP), as well as accepting a leadership role within the
ASCE Steel Bridge team. These activities ultimately lead to his induction into the SDSM&T
Leadership Hall of Fame in 2006. Along with technical, teaming and leadership
achievements, Bernard received his Fundamentals of Engineering certification in the spring
ACKNOWLEDGEMENTS
I would like to extend my highest appreciation to my graduate advisor, Dr. Sami Rizkalla,
as well as Dr. Rudolf Seracino and Dr. Michael Leming. They have been supportive and
understanding throughout my experience at North Carolina State University. I am also ever
grateful to my undergraduate research advisors at South Dakota School of Mines and
Technology, Dr. Sangchul Bang, Dr. Anil Patnaik, and Bill Arbegast who presented me the
opportunity to conduct undergraduate research, for which I inspired to pursue my graduate
degree in Civil Engineering.
I would like to thank Greg Lucier for his guidance in the laboratory as well as advising
me in my analytical pursuits. I would also like to extend my gratitude to Harry Gleich of
Metromont Corporation and Steve Brock of Gate Precast who produced the wall panels as
well as Altus Group for providing the research funding to investigate the behavior of precast
prestressed concrete sandwich panels.
Finally I would like to thank the Constructed Facilities Laboratory personnel. Without
their help and assistance, this research would not have been possible.
Jerry Atkinson – Providing day to day assistance in the laboratory
Bill Dunleavy – Providing electronic assistance in capturing test data
Lee Nelson – Providing technical assistance during testing
Amy Yonai – General office paper work support and purchase order assistance
Diana Lotito– General office paper work support and purchase order assistance
TABLE OF CONTENTS
ABSTRACT... i
LIST OF TABLES ... viii
LIST OF FIGURES ... ix
LIST OF SYMBOLS ... xiv
1 INTRODUCTION ...1
1.1 BACKGROUND ... 1
1.2 RESEARCH OBJECTIVE ... 3
1.3 PROGRAM SCOPE ... 3
2 LITERATURE REVIEW ...5
2.1 DEVELOPMENT OF SANDWICH WALL PANELS... 5
2.2 BENEFITS OF PRECAST INSULATED WALL PANELS ... 7
2.3 PRECAST INSULATED WALL PANEL CHARACTERISTICS... 10
2.4 DESIGN PHILISOPHIES ... 16
2.5 CONCLUSIONS ... 20
3 EXPERIMENTAL PROGRAM ...21
3.1 TEST PROGRAM ... 21
3.2 LOAD SEQUENCE ... 27
3.3 TEST SETUP... 31
3.4 INSTRUMENTATION ... 37
3.5 FAILURE MODES AND CRACK PATTERNS... 42
3.7 RELATIVE VERTICAL AND HORIZONTAL DISPLACEMENTS ... 65
3.8 SURFACE STRAINS OF CONCRETE... 72
3.9 STRAIN ACROSS THE PANEL THICKNESS AT MID-HEIGHT ... 77
3.10 STRAIN ACROSS THE PANEL THICKNESS AT 7/8-HEIGHT ... 87
3.11 AS-BUILT CONDITIONS... 91
4 ANALYSIS AND DISCUSSION...96
4.1 INTRODUCTION ... 96
4.2 ANALYTICAL MODEL ... 96
4.3 PERCENT COMPOSITE ACTION BASED ON DEFLECTION CRITERION .. 98
4.4 ANALYSIS OF THE TEST RESULTS ... 107
4.5 DESIGN PROCEDURES... 108
5 SUMMARY AND CONCLUSIONS ...111
5.1 SUMMARY... 111
5.2 CONCULSIONS ... 113
5.3 RECOMMENDATIONS... 114
6 BIBLIOGRAPHY...116
7 APPENDIX A...118
7.1 LATERAL DEFLECTIONS ... 119
7.2 PANEL SIDE STRAIN MEASUREMENTS AT QUARTER-HEIGHT ... 122
8 APPENDIX B ...128
9 APPENDIX C ...137
9.1 EPS 1 CALCULATIONS ... 138
9.3 XPS 1 CALCULATIONS ... 167
9.4 XPS 2 CALCULATIONS ... 181
9.5 XPS 3 CALCULATIONS ... 195
LIST OF TABLES
Table 2-1: Percent composite action ...19
Table 3-1: Test specimens ...25
Table 3-2: Concrete strength during tests...26
Table 3-3: Proposed loading sequence ...27
Table 3-4: Rayleigh probability of exposure at or above given wind speeds ...31
Table 3-5: Loading sequence for EPS 1 ...43
Table 3-6: Loading sequence for EPS 2 ...44
Table 3-7: Loading sequence for XPS 1 ...46
Table 3-8: Loading sequence for XPS 2 ...48
Table 3-9: Loading sequence for XPS 3 ...49
Table 3-10: Loading sequence for XPS 4 ...51
Table 3-11: Summary of test results...52
Table 4-1: Percent composite action associated with each tested panel ...106
LIST OF FIGURES
Figure 2-1: Foam core microstructure ... 9
Figure 2-2: Theoretical fully composite and fully non-composite strain profiles...12
Figure 2-3: Typical shear transfer mechanisms ...13
Figure 3-1: Cross-section labels ...21
Figure 3-2: Typical 2-4-2 specimen cross section...22
Figure 3-3: Photograph of cut 2-4-2 panel showing an internal pilaster ...22
Figure 3-4: Typical 4-2-2 specimen cross section...23
Figure 3-5: Photograph of cut 4-2-2 panel showing wythe thickness ...23
Figure 3-6: Specimen elevation C-GRID layouts ...24
Figure 3-7: C-GRID sample...26
Figure 3-8: Probability distribution function...30
Figure 3-9: Overview of test setup...32
Figure 3-10: Details of the inner wythe loading system...33
Figure 3-11: Details of the outer wythe loading system ...33
Figure 3-12: Spreader beam orientation and lower boundary condition ...34
Figure 3-13: Bottom panel support ...35
Figure 3-14: Top hinge configurations ...36
Figure 3-15: Top hinge system ...37
Figure 3-16: Location of deflection instruments ...39
Figure 3-17: LVDT to measure relative vertical displacement...39
Figure 3-18: LVDT to measure relative horizontal displacement for XPS 3 and 4...40
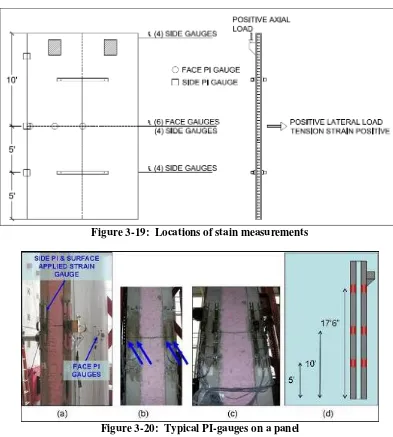
Figure 3-19: Locations of stain measurements ...41
Figure 3-21: Failure of EPS 1 ...43
Figure 3-22: Views of EPS 1 at failure ...44
Figure 3-23: Crack pattern of ESP 2 outer (Left) and inner (Right) wythes at failure...45
Figure 3-24: Close-up photograph of upper shear crack at failure for EPS 2 ...45
Figure 3-25: Crack width at top of ESP 2...46
Figure 3-26: Failure of XPS 1 ...47
Figure 3-27: Top views of XPS 1 at failure ...47
Figure 3-28: Crack pattern of XSP 2 localized failure ...48
Figure 3-29: Outer wythe cracking at connection failure of XPS 2 ...49
Figure 3-30: Failure of XPS 3 ...50
Figure 3-31: Internal view of XPS 3 at failure ...50
Figure 3-32: C-GRID failure investigation of XPS 3 ...50
Figure 3-33: Failure of XPS 4 ...52
Figure 3-34: Top view of XPS 4 failure ...52
Figure 3-35: Individual lateral displacement of EPS 1...54
Figure 3-36: Deflection profiles of EPS 1...55
Figure 3-37: Individual lateral displacement of EPS 2...56
Figure 3-38: Deflection profiles of EPS 2...57
Figure 3-39: Individual lateral displacement of XPS 1...58
Figure 3-40: Deflection profiles of XPS 1...59
Figure 3-41: Individual lateral displacement of XPS 2...60
Figure 3-42: Deflection profiles of XPS 2...61
Figure 3-43: Individual lateral displacement of XPS 3...62
Figure 3-44: Deflection profiles of XPS 3...63
Figure 3-46: Deflection profiles of XPS 4...65
Figure 3-47: Relative vertical displacement of EPS 1 ...66
Figure 3-48: Relative vertical displacement of EPS 2 ...67
Figure 3-49: Relative vertical displacement of XPS 1 ...68
Figure 3-50: Relative vertical displacement of XPS 2 ...68
Figure 3-51: Relative horizontal displacement at mid-height of XPS 2...69
Figure 3-52: Relative vertical displacement of XPS 3 ...70
Figure 3-53: Relative horizontal displacement of XPS 3 ...71
Figure 3-54: Relative vertical displacement of XPS 4 ...71
Figure 3-55: Relative horizontal displacement of XPS 4 ...72
Figure 3-56: Face strains of EPS 1...74
Figure 3-57: Face strain of EPS 2 ...74
Figure 3-58: Face strains of XPS 1...75
Figure 3-59: Face strain of XPS 2 ...76
Figure 3-60: Face strain of XPS 3 ...76
Figure 3-61: Face strain of XPS 4 ...77
Figure 3-62: Strain Profile Orientations...78
Figure 3-63: Mid-height side strain gauges of EPS 1...79
Figure 3-64: Mid-height side strain profile of EPS 1...79
Figure 3-65: Mid-height side strain gauges of EPS 2...80
Figure 3-66: Mid-height side strain profile of EPS 2...81
Figure 3-67: Mid-height side strain gauges of XPS 1...82
Figure 3-68: Mid-height side strain profile of XPS 1...82
Figure 3-69: Mid-height side strain gauges of XPS 2...83
Figure 3-71: Mid-height side strain gauges of XPS 3...85
Figure 3-72: Mid-height side strain profile of XPS 3...85
Figure 3-73: Mid-height side strain gauges of XPS 4...86
Figure 3-74: Mid-height side strain profile of XPS 4...87
Figure 3-75: 7/8-height side strain gauges of XPS 3...88
Figure 3-76: 7/8-height side strain profile of XPS 3...89
Figure 3-77: 7/8-height side strain gauges of XPS 4...90
Figure 3-78: 7/8-height side strain profile of XPS 4...90
Figure 3-79: Gap between insulation and outer wythe for XPS 1 and XPS 2 panels ...91
Figure 3-80: Solid zones of panel XPS 1 ...92
Figure 3-81: Shear grid and solid zone locations for XPS 1...92
Figure 3-82: Investigation of panel XPS 2 ...93
Figure 3-83: Shear grid and solid zone locations for XPS 2...94
Figure 3-84: Separation of the concrete wythes for XPS 2 ...94
Figure 3-85: Interior surface conditions of XPS 2 ...95
Figure 4-1: Percent composite action ...98
Figure 4-2: Cross-sectional dimensions...99
Figure 4-3: Applied load dimensions ...99
Figure 4-4: Theoretical boundary curves ...102
Figure 4-5: Experimental EPS failure cycle ...103
Figure 4-6: Experimental XPS 1 failure cycle...104
Figure 4-7: Experimental XPS 2 failure cycle...105
Figure 4-8: Experimental XPS 3 and 4 failure cycle...106
Figure 4-9: Cross-section parameters ...109
Figure 7-1: Lateral displacements of EPS 1 ...119
Figure 7-2: Lateral displacement of EPS 2 ...119
Figure 7-3: Lateral displacements of XPS 1 ...120
Figure 7-4: Lateral displacement of XPS 2 ...120
Figure 7-5: Lateral displacement of XPS 3 ...121
Figure 7-6: Lateral displacement of XPS 4 ...121
Figure 7-7: Quarter-height side strain gauges of EPS 1 ...122
Figure 7-8: Quarter-height side strain profile of EPS 1 ...122
Figure 7-9: Quarter-height side strain gauges of EPS 2 ...123
Figure 7-10: Quarter-height side strain profile of EPS 2 ...123
Figure 7-11: Quarter-height side strain gauges of XPS 1 ...124
Figure 7-12: Quarter-height side strain gauges of XPS 1 ...124
Figure 7-13: Quarter-height side strain gauges of XPS 2 ...125
Figure 7-14: Quarter-height side strain profile of XPS 2 ...125
Figure 7-15: Quarter-height side strain gauges of XPS 3 ...126
Figure 7-16: Quarter-height side strain profile of XPS 3 ...126
Figure 7-17: Quarter-height side strain gauges of XPS 4 ...127
LIST OF SYMBOLS
a1 = top of panel to height of axial load
a2 = end of panel to height of lateral load (four point bending) a3 = inner wythe surface to point of axial load
Ac = composite concrete area Ac,o = outer wythe concrete area Ac,i = inner wythe concrete area
Ap,o = prestressing steel area for outer wythe Ap,c = prestressing steel area for composite section Ap,i = prestressing steel area for inner wythe As,c = mild steel area for composite section
As,nc = mild steel area for each wythe (assumed same area for inner and outer wythe) b = panel width
C = compression force
d1 = top extreme fiber of composite section to inner wythe steel d2 = top extreme fiber of composite section to outer wythe steel do = composite elastic centroid to outer wythe elastic centroid
dp,o = outer wythe prestressing depth from outer wythe top extreme fiber dp,c = fully composite prestressing depth from top extreme fiber
ds,i = inner wythe mild steel depth from inner wythe top extreme fiber di = composite elastic centroid to inner wythe elastic centroid
ea,o = outer wythe axial load eccentricity ea,c = composite section axial load eccentricity ea,i = inner wythe axial load eccentricity
Ec = concrete modulus of elasticity day of testing Eci = initial concrete modulus of elasticity
ei = initial panel bow
ep,o = outer wythe prestressing eccentricity ep,c = fully composite prestressing eccentricity ep,i = inner wythe prestressing eccentricity Eps = prestressing steel modulus of elasticity Es = mild steel modulus of elasticity
fc = concrete strength day of testing fci' = initial concrete strength
fpi = initial prestressing jacking stress fps = prestressing strand stress
fpu = prestressing strand ultimate strength fpy = prestressing strand yield strength fr = concrete tension modulus
fsy = mild steel yield strength
H' = bottom of panel to height of axial load
I = inner wythe stiffness
Ic = fully composite moment of inertia Icr,.o = outer wythe cracked moment of inertia Icr,c = composite section cracked moment of inertia Icr,i = inner wythe cracked moment of inertia Ieff = effective moment of inertia
Inc = non-composite moment of inertia Inc,o = outer wythe moment of inertia Inc,i = inner wythe moment of inertia
k = friction loss coefficient associated with prestressing
kcr = creep coefficient associated with prestressing ksh = shrinkage coefficient associated with prestressing Ma = effective applied moment
Mcr,o = outer wythe cracking moment Mcr,c = composite section cracking moment Mcr,i = inner wythe cracking moment
Me,o = outer wythe moment due to axial load Me,c = composite section moment due to axial load Me,i = inner wythe moment due to axial load Mn = nominal moment capacity
MSD = moment due to super imposed dead loads n = effective prestressing modular ratio
O = outer wythe stiffness
Pa = composite axial load Pa,o = outer wythe axial load Pa,i = inner wythe axial load
Pe,o = effective outer wythe prestressing force Pe,c = effective composite prestressing force Pe,i = effective inner wythe prestressing force Pi,o = initial outer wythe prestressing force Pi,c = initial composite prestressing force Pi,i = initial inner wythe prestressing force
Plat = lateral load applied per point load in four point bending Pn = nominal axial load capacity
R = percent prestressing force retained after losses
RH = relative humidity associated with prestressing
t = panel thickness
T = tension force
t1 = equivalent inner wythe thickness t2 = equivalent outer wythe thickness t3 = equivalent core thickness
trelax = time from casting to testing
tset = time of casting to release of prestressing strands V/S = concrete volume divided by concrete surface area
x1 = bottom of panel to height used for deflection percent composite action x2 = bottom of panel to height of maximum moment
x3 = top of panel to height of maximum moment
yb,o = outer wythe elastic centroid to bottom extreme fiber of outer wythe yb,c = composite elastic centroid to bottom extreme fiber of composite section yb,i = inner wythe elastic centroid to bottom extreme fiber of inner wythe yt,o = outer wythe elastic centroid to top extreme fiber of outer wythe yt,c = composite elastic centroid to top extreme fiber of composite section yt,i = inner wythe elastic centroid to top extreme fiber of inner wythe
∆A = anchorage seating associated with prestressing
∆app = panel lateral deflection due to applied loads
∆fpA = prestressing losses due to anchorage seating
∆fpCR = prestressing losses due to concrete creep
∆fpES = prestressing losses due to concrete elastic shortening
∆fpF = prestressing losses due to friction
∆fpR = prestressing losses due to strand relaxation
∆fpSD = prestressing losses due to super imposed dead loads
∆fpSH = prestressing losses due to concrete shrinkage
∆P-∆ = panel lateral deflection due to eccentrically applied axial load
α = wobble coefficient associated with prestressing
β1 = neutral axis depth coefficient
ε2 = effective strain in strand at decompression of section
ε3 = effective strain in strand compatible with ultimate compression strain
εcu = concrete crushing strain
φf = flexural strength reduction factor
φv = shear strength reduction factor
γ fc = concrete tension modulus coefficient
γc = concrete unit weight
1
INTRODUCTION
1.1 BACKGROUND
Precast concrete insulated sandwich wall panels, commonly known as concrete sandwich
panels, are typically used for building envelopes. Such panels consist of two outer layers of
concrete separated by an inner foam core. Panels can serve to carry gravity loads from floors
or roofs, to resist normal or transverse lateral loads caused by wind, to insulate a structure
and to provide the interior and exterior finished wall surfaces.
Typical panels are fabricated with heights up to 45 feet and widths up to 12 feet. Wythe
thickness ranges from 2 inches to 6 inches with overall panel thicknesses ranging from 5
inches to 12 inches. Prestressing is normally provided for both concrete wythes.
Insulated concrete sandwich panels may be designed as one of three types:
non-composite, partially composite and fully composite. Some panels are also designed to be
non-composite during service but fully composite during handling in order to reduce the
amount of shear transfer mechanism used within the panel. The degree of composite action
depends on the nature of the connections between the two concrete wythes. Connections
between wythes have traditionally been made using solid zones of concrete, bent reinforcing
bars, or various specially-designed steel shear connectors. Increasing the degree of
composite action between wythes increases the structural capacity of a given panel, making it
more structurally efficient. However, traditional composite shear connections have the
negative consequence of thermally bridging the two concrete wythes, thus decreasing the
In order to achieve the most structural efficiency provided by a composite panel, while
avoiding the thermal bridges created by traditional means of shear transfer, Altus Group has
recently begun utilizing a carbon-fiber shear connection grid. Since carbon fiber has a
relatively low thermal conductivity of 0.9x10⁻⁶/°F (Altus Group 2008) in comparison to steel of 6.6x10⁻⁶/°F (Hibbler 2003), connecting concrete wythes with carbon grid allows a panel to develop composite structural action without developing thermal bridges; therefore,
maintaining the insulating value of the panel. Optimal design practices for using carbon grid
shear connectors are still being developed.
This thesis describes an experimental program conducted at the Constructed Facilities
Laboratory at North Carolina State University to investigate the behavior of 20 foot Altus
precast prestressed concrete sandwich wall panels reinforced with carbon-fiber shear grid,
commercially knows as C-GRID.
The experimental program consisted of six 20 foot precast prestressed concrete sandwich
wall panels composed of two prestressed outer concrete wythes and an internal layer of foam
insulation with shear grid reinforcment placed through the core into each concrete wythe.
The various parameters considered are the type of foam, presence of solid concrete zones,
panel configuration, and shear grid reinforcement ratio to achieve composite action. The two
types of foam considered are expanded polystyrene (EPS) foam and extruded polystyrene
(XPS) foam. Each panel consisted of three layers including an inner wythe, internal foam
core and an outer wythe. Panel identification contains three numbers corresponding to each
layer’s thickness in inches.
The first two panels tested were identical panels consisting of a 2-4-2 configuration with
panel height. The last four panels all contained XPS foam but all varied in the panel
configuration, presence of solid concrete zones and the quantity of shear grid. The first XPS
foam panel had the same configuration and shear grid quantity as the EPS foam panels;
however, it also contained several discretely located solid concrete zones while the second
XPS panel consisted of a 4-2-2 configuration with no solid concrete zones. The third XPS
foam panel was identical to both EPS panels with the exception of the foam core. The last
panel tested was similar to the third XPS panel with an additional 30 feet of shear grid.
This thesis presents test results, analysis of the test results of the experimental program
which was used to identify the structural behavior as well as to develop design guidelines for
these types of panels.
1.2 RESEARCH OBJECTIVE
The primary objective of the testing program was to determine the structural performance
of full-size precast EPS and XPS insulated sandwich wall panels reinforced with carbon fiber
reinforced polymer shear mechanism subjected to combined axial and reverse cyclic lateral
loads. The loading sequence for each panel was selected to simulate the effect of service
gravity and wind loads for a 50 year lifespan. Load and support conditions were designed to
mimic field conditions. Test results of the experimental program were compared to
theoretical calculations to evaluate the percent composite action and assess the optimum
panel configuration to maximize the efficiencies of these types of panels. Based on the
findings, a design guideline is presented.
1.3 PROGRAM SCOPE
In order to achieve the research objectives described above, the following stages were
1. An extensive literature review was conducted investigating the history and
development of precast insulated sandwich wall panels and their benefits. These
findings were compared to extract various panel characteristics and their
respective advantages and disadvantages. Industry and innovative design
methods were investigated and compared indicating the importance and
definitions of percent composite action.
2. Six panels containing several testing variables were subjected to a rigorous
loading regimen simulating a 50 year service life. Panel behavior was recorded
throughout testing to monitor the panels’ response to the applied loads over time.
3. Test results were analyzed characterizing each panel’s behavior. The behavior
was used to develop a thorough understanding of the effect of each variable on the
percent composite action of the panel.
4. Analytical modeling was conducted to evaluate the percent composite action for
each panel.
2
LITERATURE REVIEW
Precast prestressed concrete insulated sandwich wall panels have become increasingly
popular within the precast concrete industry. Wall panels were first introduced in the 1960’s
with the use of double tees. Double tees were soon replaced by flat slabs to optimize
structural performance and cost. Shear transfer mechanisms evolved from solid concrete
zones to steel truss mechanisms to FRP truss mechanisms improving the thermal
performance of wall panel system.
Wall panel systems can consists of various parameters including foam core material, type
of shear transfer mechanisms and arrangement of concrete wythes and foam cores. Utilizing
different variations of the wall panel parameters, the structural performance can vary from a
fully non-composite behavior to a fully composite behavior. Various shear transfer
mechanisms have been investigated quantifying their structural contribution to the wall panel
system along with their thermal performance.
Several design philosophies have been developed for various panel behaviors and shear
transfer mechanisms. Percent composite actions have been correlated by comparing
experimental results to the theoretical design boundaries. Optimization of the design
procedures have been achieved by utilizing the percentage of composite action. Material
consumption, fabrication costs and construction costs were also significantly reduced by
optimizing the design method.
2.1 DEVELOPMENT OF SANDWICH WALL PANELS
Wall panels were first introduced during the 1960’s with double tee sandwich panels
the composite action. Double tees sandwich panels provided a robust structural wall, but
sacrificed the potential thermal savings. Flat concrete slabs soon replaced double tees as the
concrete wythes to reduce concrete material, optimize the structural performance and reduce
overall costs (Gleich 2007). The use of solid concrete zones created thermal bridges between
the wythes and could lead to a thermally deficient structural wall system.
Recently, steel ties, connecting the two concrete wythes were used to replaced solid
concrete zones in an attempt to enhance the thermal performance of wall panels. It was
found that the use of steel ties significantly improved the thermal efficiency in comparison to
solid concrete zones; however, it could also create thermal bridges between the two concrete
wythes (Gleich 2007).
Non-composite panels were introduced in the 1980’s addressing the thermal deficiencies
created by thermal bridges (Gleich 2007). Non-composite panels contained minimal shear
connectors for handling loads only, but the lack of shear transfer compromised the structural
integrity of the system. Despite the lower structural capacity, non-composite panels became
popular due to their thermal savings and architectural characteristics.
In 1997, Salmon et. al. introduced the use of FRP bars formed in a truss orientation in
place of metal wire trusses. They concluded that the use of FRP in a truss like mechanism
can achieve a high level of composite action and can provide good thermal benefits similar to
non-composite insulated sandwich wall panels. Following the same concept, Altus Group
developed Carbon Fiber Reinforced Polymer Grid, commercially known as C-GRID, in 2003.
Altus group utilized the C-GRID in an orthogonal layout parallel to the long axis of the wall
panels. Orienting the C-GRID in a truss like orientation provides adequate shear transfer
2.2 BENEFITS OF PRECAST INSULATED WALL PANELS
Losch (2005) investigated the use and benefits of precast insulated sandwich panels.
Losch (2005) indicated that the use of a wall panel system provides several benefits over
traditional wall construction. Some of the benefits are:
a. Increased thermal efficiency b. Increased design flexibility c. Increased speed of erection d. Competitive costs
Precast insulated wall panels have been identified to be one of the most structural
efficient systems in terms of low material consumption and highly thermal efficient systems.
Bush and Stine (1994) and GoStructural (2008) stated that the use of insulated precast wall
panels can increase the thermal efficiency of concrete sandwich panels nearly 30 percent
over that of a stud wall system. These thermally efficient systems can save nearly 20 percent
in energy cost compared to framed walls (Gleich 2007). Insulated concrete sandwich panels
with polystyrene cores can exhibit R-values up to a value of 30 in comparison to a stud wall
system with an R-value of 5 to 10 (Christian & Kosny 1999). The presence of steel or
concrete thermal bridges can reduce the R-value up to 40 percent resulting in R-values from
12 to 16 (Lee & Pessiki 2004, Bush & Stine 1994).
Lee and Pessiki (2004) investigated the thermal efficiency of three wythe wall panels in
comparison to two wythe panels in an attempt to enhance the R-value while still providing
structurally efficient concrete solid zones. Lee and Pessiki (2004) showed that:
a. Three wythe panels have greater thermal efficiency than a two wythe panel b. Concrete wythe thickness does not affect the R-values
Three wythe wall panel systems exhibit enhanced thermal behavior due to the increased
thermal path from the inner wythe to outer wythe. It should be noted Lee and Pessiki’s
(2004) study was only conducted with extruded polystyrene foam. Within this study, Lee
and Pessiki (2004) conducted finite elements modeling (FEM) to analyze the thermal
predictions of three wythe concrete insulated sandwich panels. They found that using solid
elements for modeling concrete and foam while using shell elements for modeling steel
plates produced results with 95% accuracy. For this level of accuracy, thermal properties
must be known of the concrete, foam core and thermal barriers such as the shear transfer
mechanisms. FEM was found to represent thermal performance better than the isothermal
plane method and parallel flow method. Isothermal plane method and parallel flow method
yielded results within 88% and 58% accuracy, respectively.
The amount of thermal savings is dependant on the type of foam core used within the
panel. Currently, there are two foam cores commonly used for insulated sandwich panels,
expanded polystyrene (EPS) foam and extruded polystyrene (XPS) foam. EPS foam consists
of 0.07 inch to 0.12 inch polystyrene beads that are expanded and fused together to form a
solid insulation block (Horvath 1994). XPS foam is produced from a solid mass of molten
material resulting in a dense consistency in comparison to EPS foam (PCA 2008).
Comparisons of XPS and EPS microstructure are shown in Figure 2-1(a) and (b),
respectively. EPS foam densities range from 0.6 pcf to 2.5 pcf in comparison to XPS foam
which exhibits densities up to 3 pcf (Horvath 1994, PCA 2008, ASTM C578 2007).
Consequently, EPS foam can retain an R-value up to 4.35 per inch thickness in comparison
to XPS foam with an R-value up to 5 per inch thickness (PCA 2008). It should be noted that
(a) (b)
Figure 2-1: Foam core microstructure (Dow Chemical Company, 2008)
Precast concrete sandwich wall panels not only enhance the thermal efficiency, but also
decreases the structural costs. An insulated wall panel can withstand equivalent flexural
strength to a solid wall yet consume nearly half the concrete material; however, if the
compression zone is greater than the thickness of the compression wythe, then a lower
flexural strength may be experienced. Wall panels can exhibit higher ductility than solid
concrete walls due to the reduction of the moment of inertia. As a result of high ductility,
panels should be carefully designed to minimize the lateral deflections.
Wall panels can also provide a lighter system which is critical for the construction
industry. Precast wall panels provide a quick and efficient construction system when
construction costs are critical or the job site is subjected to harsh construction environments.
Panels can be cast in a controlled environment ensuring structural quality, and then placed in
the field with less labor than an in-situ wall (Losch 2005).
These panels not only provide structural and thermal benefits but also provide
architectural benefits. It is common to provide an architectural overlay to the structural
wythes making the panels aesthetically pleasing. Not only can these panels be overlaid, but
2.3 PRECAST INSULATED WALL PANEL CHARACTERISTICS
Precast insulated wall panels generally consist of three layers.
a. Outer wythe b. Foam core c. Inner wythe
Panel identification consists of three numbers corresponding to each layer thickness in
inches. A 2-4-2 panel designation consists of a 2 inch outer wythe, a 4 inch foam core and a
2 inch inner wythe. Panels can consist of additional layers. Lee and Pessiki (2004)
investigated the advantages of a three wythe sandwich panel in comparison to a two wythe
sandwich panel. A three wythed wall panel will consist of five numbers corresponding to the
following layer thicknesses in inches:
a. Outer wythe b. Outer foam core c. Middle wythe d. Inner foam core e. Inner wythe
Lee and Pessiki (2004) concluded a three wythe system provides several potential
benefits over a two wythe panel. These benefits include:
a. Improved thermal performance
b. Composite action can be achieved with solid concrete zones without sacrificing thermal efficiency
c. Locations of thickened concrete regions can be used for placements of embedded hardware
d. All prestressing can be located within the center concrete wythe
Lee and Pessiki (2008) investigated the structural behavior of a three wythe structural
system under flexure only. Flexural behavior of three wythe panels showed that staggered
solid concrete zones exhibits behavior similar to that of a fully composite panel. Along with
high flexural capacity, these systems exhibit a ductile flexural behavior for proportionally
crack system along the height of the panel and yielding of the longitudinal reinforcement. It
was also observed that release of the prestressing force induced cracks in the concrete wythes
parallel to the prestressing strands. A Finite Element Modeling (FEM) analysis was
conducted to investigate the prestressing forces during release. A comparison of
experimental results and FEM results showed that modeling the concrete and the foam
insulation with solid block elements provided close results to the measured values. FEM
analysis was then utilized to conduct a parametric study. FEM results revealed that
increasing the concrete area near the end regions of the panel reduces the number of cracks
induced during prestressing.
Losch (2005) noted that induced cracking can also be reduced by providing relatively
equal wythe thicknesses. Equal wythe thicknesses induces equal concrete curing of the
wythes reducing shrinkage stresses.
Wall panels are generally assumed to behave as a one way system due to their height to
width aspect ratios. Benayoune et. al. (2008) stated a two way system exists when the height
to width aspect ratio is less than one. A one way system exists when the height to width
aspect ratio is greater than 2.67. Consequently, intermediate aspect ratios yields intermediate
behavior. Benalyoune et. al. (2008) showed FEM accurately represents one way systems
using 2-D isoperimetric plane stress elements. The FEM is a 2-D system representing the
behavior of the wall panel per foot width. Similar results for a two way system can be
obtained by using 3-D thin shell elements. A two way system has to be analyzed using a 3-D
model to capture behavior along the width and height of the panel. Results were confirmed
by comparing the FEM deflection and strain behavior with experimental results. It was
Lee and Pessiki (2007) also found that assuming perfect bond between the foam core and the
concrete surface yields similar results to a non-linear model where the foam core resists only
compression and the wythe connectors resist only tensile forces.
Traditionally, sandwich wall panels are assumed to behave as either fully composite or
fully non-composite systems. Fully composite panels are designed so that the two concrete
wythes act together as a single unit to resist lateral loads. The decisive indication of
composite behavior is a through-thickness strain profile that remains continuous at all
locations along the height and width of a panel. A linear strain profile across the thickness of
the panel is identified by a single neutral axis. Fully non-composite behavior results from
each wythe acting independently to resist applied loads. Fully non-composite panels will
have independent strain profiles and unique neutral axes for each wythe. Strain profiles for a
theoretically composite and theoretically non-composite panel are shown in Figure 2-2 (a)
and Figure 2-2 (b), respectively. Panel orientation with respect to the strain profile is shown
in Figure 2-2 (c).
(a) (b) (c)
Figure 2-2: Theoretical fully composite and fully non-composite strain profiles
The term “partially composite” action has been introduced by several authors including
sandwich panel behavior between the two extremes of composite and non-composite
behavior.
The typical design method for precast sandwich panels assumes non-composite action
(PCI 1997). In practice, panels generally exhibit partially composite behavior (Pessiki and
Mylnarczyk 2003, Lee and Pessiki 2007, Bush and Stine 1994). Tests have shown that
generally some level of shear transfer occurs between the wythes (Pessiki and Mylnarczyk
2003, Lee and Pessiki 2007, Bush and Stine 1994). Utilizing partial degree of composite
action in the design could significantly reduce costs.
Several shear transfer mechanisms have been developed in order to increase the partial
composite behavior. Several common mechanisms described in State-of-the-Art of
Precast/Prestressed Sandwich Wall Panels (PCI 1997) are wire truss connectors, bent wire
connectors, and solid zones of concrete penetrating the foam core as detailed in Figure 2-3
(a), (b) and (c), respectively.
(a) (b) (c) (d) (e)
Figure 2-3: Typical shear transfer mechanisms
Wire truss connectors provide diagonal steel to transmit longitudinal shear forces from
one wythe to another. Bent wire connectors rely on the shear strength of ties perpendicular
to the panel faces to transfer forces. Mechanisms such as wire truss connectors provide
adequate shear resistance to achieve the composite action and are commonly referred to as
resistance and are referred to as non-shear connectors. Connectors with diagonally oriented
members are more efficient than connectors with only normal oriented members in
transferring longitudinal shear.
Bush and Stine (1994) investigated the efficiency of a steel truss connector in comparison
to a bent wire connector. Shear specimens were tested to investigate the shear resistance of
each connector. Three wythe specimens were cast with the steel connectors extending into
each concrete wythe. The two outer wythes were restrained from vertical and horizontal
translation and the center wythe was loaded. The three wythe configuration subjected the
foam core to pure shear revealing the shear resistance of the system. Bush and Stine (1994)
showed that a truss orientation increased the shear stiffness up to approximately 70% in
comparison to bent wire connectors. It should be noted that solid concrete zones provide the
simplest and most structurally efficient longitudinal shear transfer mechanism (Pessiki and
Mylnarczyk 2003).
One major criticism of traditional shear transfer mechanisms are they allow heat to bridge
the foam core. Thermal efficiency is dramatically compromised when heat is allowed to
travel through the panel core.
Fiber reinforced polymer (FRP) shear transfer mechanisms have been developed as early
as 1997 (Salmon et al 1997). FRP systems were developed to improve deficient thermal
characteristics of traditional shear transfer mechanisms. Two notable carbon fiber reinforced
polymer (CFRP) systems have been introduced. The first system was introduced in 1997 by
Salmon et. al. This system uses CFRP bars in a truss orientation to transmit shear forces
from the inner wythe to outer wythe. The second system was developed by Altus Group in
(6 mm) wide by 1/16” (2 mm) thick arranged in an orthogonal pattern. The finished grid is oriented at a 45° angle and developed in each concrete wythe, allowing for a truss
mechanism to developed. The truss orientation engages the tensile properties of the FRP grid.
A grid oriented within a wall panel section is shown in Figure 2-3 (d) and Figure 2-3 (e).
Foam core thickness and surface roughness also significantly affects the shear flow
capacity. An EPS foam core will exhibit increased shear resistance in comparison to an XPS
foam core. EPS foam exhibits a higher surface roughness in comparison to XPS foam. A
high surface roughness enhances the concrete to foam bond engaging the foam shear strength.
XPS foam, however, has up to 20% higher shear strength than an EPS foam (PCA 2008). As
a result, the shear resistance of XPS foam can be greater than EPS foam if the XPS foam
surface is roughened to match or exceed EPS foam surface roughness.
As the foam core thickness increases, the shear flow capacity reduces while the induced
shear flow from applied forces increases. Consequently, additional shear transfer
mechanisms have to be provided to achieve greater composite action.
Panel shear demands are greatly affected by the loading scheme the panel is subjected to.
Panels are typically designated as load bearing or non-load bearing systems. Load bearing
walls carry associated gravity loads introducing an axial force into the wall panel system.
Non-load bearing walls resist only lateral loads requiring another system to transmit gravity
loads to the foundation. Non-composite panels are commonly non-load bearing walls due to
their structural inefficiencies while composite panels are generally designed as load bearing
systems. Therefore, to utilize sandwich wall panels to their full potential, composite action
2.4 DESIGN PHILISOPHIES
The behavior of precast insulated sandwich wall panels is continually changing with the
advancements of different shear transfer mechanisms. As a result, a unified design procedure
has not been accepted throughout industry. There are currently several methods of design in
use. Currently, design methods vary depending on the shear transfer mechanism and the
precast plant designing the panels.
Precast/Prestressed Concrete Institute (PCI) published a design guideline in 1997
summarizing fully composite and fully non-composite design philosophies of concrete
sandwich panels. This design philosophy consists of three behavioral variations.
a. Fully composite b. Semi-composite c. Fully non-composite
Fully composite assumes the panel resists applied forces as a single unit.
Semi-composite assumes the panel behaves Semi-compositely during handling and erection and fully
non-composite under service loads. A fully non-composite behavior assumes each wythe
resists the applied moments individually and the moment is distributed between the wythes
with respect to their uncracked stiffness.
PCI accounts for four load conditions: service, stripping and handling, travel and erection.
The maximum applied moment is due to the largest moment of these four loading conditions.
Moments due to applied service loads consists of two parts: moment due to applied forces
and secondary P-δ effects due to axial loads. Once the ultimate moment is acquired, the
prestressing strands are selected in accordance to ACI 318. If axial load is present, the load
is assumed to act through the elastic centroid of the composite cross section for a fully
non-composite. Panel deflections include flexural deflections along with secondary P-δ
deflections.
The shear transfer mechanism has to resist the induced shear forces throughout the height
and width of the panel in order to develop a fully composite behavior. Shear flow resistance
must be greater than the induced shear flow (Salmon et. al. 1997). Shear flow capacity must
be provided through testing or by the shear transfer mechanism provider. If solid concrete
zones are present, then the shear strength of the concrete is assumed to be 80Ac (psi) as specified by ACI 318-05 section 17.5.3. The concrete shear strength can then be distributed
over the tributary height in order to develop the shear flow resistance. An alternative method
of shear reinforcement design is to develop horizontal shear strength across the panel core
greater than the smaller of the tension force or compressive force extracted from strain
equilibrium of the cross-section at ultimate condition (Lee & Pessiki 2008).
The drawbacks to the PCI design method is that it does not account for partial composite
action or shear deformations. Shearing deformation can be accounted for in a composite
panel if the shear modulus and shear strength of the panel core is known. Some precasters
have developed shear properties to account for the shearing deformation in composite panels
for a particular type of shear transfer mechanism.
Bush and Stine (1994) showed that nearly all panels will exhibit some level of composite
action through three shear mechanisms: concrete to foam interface, shear strength of the
shear transfer mechanism and the shear strength of the foam core. Strain profile
discontinuities have to be accounted for when accounting for partial composite action. .
Accounting for the level of discontinuity becomes very difficult and varies with the panel
As stated by Pessiki and Mlynarczyk (2003) the definition of percent composite action is
inconsistent throughout industry. Pessiki and Mlynarczyk (2003) developed a method of
interpolation between the two extremes of fully composite and fully non-composite to
evaluate the percent composite action. Their resulting interpretation is given in Equation 2-1.
(
)
exp 100 nc c nc I I I Iκ
= −− Equation 2-1
Where
-κ is the percent composite action
-Iexp is the moment of inertia extrapolated from the test data -Inc is the non-composite moment of inertia
-Ic is the composite moment of inertia
Since the percent composite action is dependant on the experimental load deflection
behavior to extrapolate the experimental moment of inertia, the percent composite action is
dependant on the type of shear resistance (Pessiki and Mlynarczyk 2003). Consequently, the
percent composite action has to be specified for the type and quantity of shear transfer
mechanism as well as the type of foam used.
Percent composite action values for two and three wythe panels have been developed by
Pessiki and Mlynarczyk (2003) and Lee and Pessiki (2008), respectively. Variables
addressed within the analysis include: panel configuration, type of shear transfer mechanism
Table 2-1: Percent composite action
Panel
Configuration Shear Transfer Mechanism
Percent Composite
Action
3-2-3
Solid Concrete Regions, M-ties and XPS
Foam Bond 100%
3-2-3 Solid Concrete Regions only 92%
3-2-3 M-ties only 10%
3-2-3 XPS Foam Bond only 5%
2-1-2-1-2 Solid Concrete Regions and XPS Foam Bond1 79% 2-1-2-1-3 Solid Concrete Regions and XPS Foam Bond2 94% Note: 2 has more evenly distributed solid concrete zones in comparison to 1
Pessiki and Mlynarczyk (2003) and Lee and Pessiki (2008) found the percent composite
action of solid concrete zones exhibits significantly higher percent composite action than
XPS foam to concrete bond and M-ties as shown inTable 2-1. More evenly distributed shear
reinforcement was found to increase the percent composite action as shown with the two
three wythe panels in Table 2-1 It was also shown two wythe panels with equivalent shear
reinforcement as three wythe panels exhibited similar percent composite action values.
An alternative method for accounting for the percent composite action, presented by
Benayoune et. al. (2005) and Salmon et. al. (1997), was developed by taking the ratio of the
experimental behavior with respect to the fully composite behavior. The experimental to
composite ratio allows for the maximum applied moment to be increased and the panel
designed for fully composite behavior. Benayoune et. al.(2005) tested a series of small scale,
two wythe panels under one way and two way bending reinforced with a wire truss shear
transfer mechanism and polystyrene foam. The type of polystyrene foam was not specified.
The experimental moment of inertia was compared to the fully composite uncracked moment
of inertia resulting in percent composite actions ranging from 70% to 90% by doubling the
2.5 CONCLUSIONS
After review of previous research, several conclusions were developed summarizing the
behavior of precast insulated sandwich panels.
1. Wall panels exhibit improved thermal properties in comparison to a stud wall system
2. Three-wythed panel exhibits improved thermal performance in comparison to a two-wythed panel
3
EXPERIMENTAL PROGRAM
3.1 TEST PROGRAM
3.1.1 Test Panels
A total of six precast prestressed concrete sandwich wall panels were tested in this
experimental program. The typical dimension of the tested panels is 8 inches thick, 12 feet
wide and 20 feet tall. Designation of the tested sandwich panel generally consists of three
numbers referring to the inner wythe concrete thickness, the foam thickness and the outer
wythe concrete thickness as shown in Figure 3-1.
For the purpose of this thesis, the corbel wythe will be referred to as the inner wythe and
the non-corbel wythe will be referred to as the outer wythe as given in Figure 3-1.
Figure 3-1: Cross-section labels
This study included panels fabricated with two different foam types. The first foam type
is expanded polystyrene foam (EPS). Expanded polystyrene foam consists of a beaded
material with a high void ratio. The second foam used is extruded polystyrene foam (XPS)
which consists of a dense hard foam material with a low void ratio.
Five panels consisted of a 2-4-2 configuration with 4 inches of an insulation core, and the
inner wythe had two 2 inch thick by 24 inch wide pilasters at quarter widths spanning the
The concrete wythes are reinforced with welded wire reinforcement, 16 x 10 - W2.1 x
W3.0, located at one inch from the outer surface of each wythe. A total of ten 3/8 inch
diameter 270k low-lax prestressing strands were used to prestress the concrete to a stress
equivalent to 202.5 ksi. Locations of the strands are shown in Figure 3-2 and Figure 3-3.The
strand locations were:
- 2 strands spaced at 5 ¾” from each end, 1” from each surface - 2 strands spaced at 9 ¾” from each end, 1” from each surface - 2 strands spaced at mid width, 1” from each surface
Each strand was stressed to 75% of ultimate, providing an initial prestressing force
(before losses) of 17,200 lbs/strand.
Figure 3-2: Typical 2-4-2 specimen cross section
The 4-2-2 panel consist of a 4 inch thick inner wythe throughout the width of the panel
followed by a constant 2 inch foam layer and a 2 inch concrete outer wythe as shown in
Figure 3-4 and Figure 3-5. Welded wire fabric sheets of 16x10-W2.1xW3.0 were also used
at the center of each wythe, adjacent to the prestressing strands. A total of five 3/8 inch
diameter 270k low-lax prestressing strands were used to stress the 2 inch concrete wythe and
five 1/2 inch diameter 270k low-lax prestressing strands were used to stress the 4 inch
concrete wythe as shown in Figure 3-4. Strand locations were provided as follows:
-2 strands 7 7/8” from each end, centered in each concrete wythe -2 strands 3’-3 7/8” from each end, centered in each concrete wythe
-2 strands 5’-11 7/8” from either end (in center width), centered in each concrete wythe
Each strand was stressed to 75% of ultimate, providing an initial prestressing force
(before losses) of 17,200 lbs/strand.
Carbon fiber C-GRID was provided between the two wythes to transfer the shear stresses
across the foam and to develop a composite action between the wythes. This carbon grid was
provided in strips running parallel to the long axis of each panel at the locations shown in
Figure 3-6, (a). Panels EPS 1, EPS 2, XPS 1, XPS 2, and XPS 3 contained the same grid
layout totaling 90 linear feet of C-GRID per panel. Panel XPS 4 contained an additional 30
foot of C-GRID totaling 120 linear feet of C-GRID as shown in the Layout 2 in Figure 3-6,
(b). Panel XPS 1 also contained 10 discretely placed solid concrete zones for additional
shear transfer between the two wythes. In addition, four 18 inch by 18 inch sections of
C-GRID were placed parallel to the panel surface at each lifting point to reinforce the concrete
during the installation process.
Layout 1 Layout 2
3.1.2 Construction of Wall Panels
The various parameters considered in this study are:
a. Type of foam core (EPS and XPS)
b. Configuration of the panel (2-4-2 and 4-2-2) c. Percentage of C-GRID to achieve composite action
d. Use of solid concrete in addition to the C-GRID to achieve composite action
Panels consisting of expanded polystyrene (EPS) cores were fabricated for Altus Group
by Metromont Corporation of Greenville, SC and all panels consisting of extruded
polystyrene (XPS) cores were fabricated for Altus Group by Gate Precast Company of
Ashland City, TN. Overall dimensions, foam types, thickness configurations, solid zones,
C-GRID layout, concrete strength, cast dates and test dates of all tested panels are summarized
in Table 3-1.
Table 3-1: Test specimens
Panel Foam Configuration Solid Zones C-GRID Layout 28 Day Concrete Strength (psi) Dates Cast Dates Tested
EPS 1 EPS 2-4-2 No Layout 1 6410 10/17/2006 1/16/2007
EPS 2 EPS 2-4-2 No Layout 1 6410 10/17/2006 1/31/2007
XPS 1 XPS 2-4-2 Yes Layout 1 9190 2/7/2007 5/28/2007
XPS 2 XPS 4-2-2 No Layout 1 7930 2/6/2007 6/8/2007
XPS 3 XPS 2-4-2 No Layout 1 6870 9/9/2007 12/4/2007
XPS 4 XPS 2-4-2 No Layout 2 6660 9/10/2007 11/19/2007
Sandwich panels are cast in a flat orientation in long-line production forms. Fabrication
began by stressing the strands and laying reinforcement for the outer concrete wythe. After
casting the first wythe, foam insulation was placed on top followed by placing the C-GRID
through the foam into the wet concrete wythe beneath. With adequate shear grid projecting
from the insulation, the top prestressing strands and the reinforcement of the inner wythe
were welded to the upper embed plates used for the corbel reinforcement and top surface.
Figure 3-7 depicts a sample of the C-GRID used for shear reinforcement.
The compressive strength at time of testing was estimated based on the measured
compressive stress at 28 days of 4 inch by 8 inch cylinders given in Table 3-2.
The strength on day of testing was evaluated by equation 3-1 (Mehta & Monteiro, 1993).
+ = t t f t fc c
85 . 0 4 )
( 28 Equation 3-1
Where
-fc(t) is the concrete strength at the day of interest -fc28 is the 28 day concrete strength
-t is the time in days
Table 3-2: Concrete strength during tests
Panel Test Day Concrete Strength
EPS 1 7620
EPS 2 7670
XPS 1 10080
XPS 2 8790
XPS 3 7670
XPS 4 7340
3.2 LOAD SEQUENCE
The proposed loading sequence for the testing program consists of combined axial
gravity load and reversed cyclic lateral load for approximately 4,000 cycles. Typical loading
sequence is summarized in Table 3-3. One full load cycle consist of loading the panel
laterally from zero lateral load to the specified lateral load level in both directions and back
to zero lateral load. Panels EPS 1, XPS 1, XPS 2, XPS 3, and XPS 4 simulated a lateral load
equivalent to a 120 MPH wind speed while panel EPS 2 simulated a lateral load equivalent to
a 150 MPH wind speed.
Table 3-3: Proposed loading sequence
Step Vertical Load Lateral Load
(#) Level Load per Corbel (kips)
Level Magnitude (kips)
(EPS 2)
Cycles at Step (#)
1 D 13.5 0 0 0
2 D+L 18.9 0 0 0
3 1.2D+0.5L 18.9 0 0 0
4 1.2D+0.5L 18.9 45% x 1.6W 5.0 (7.8) 3710
5 1.2D+0.5L 18.9 50% x 1.6W 5.6 (8.6) 177
6 1.2D+0.5L 18.9 60% x 1.6W 6.7 (10.4) 1
7 1.2D+0.5L 18.9 80% x 1.6W 9.0 (13.8) 1
8 1.2D+0.5L 18.9 100% x 1.6W 11.2 (17.3) 1
9 1.2D+0.5L 18.9 up to Failure up to 20 (up to 30) 1
3.2.1 Gravity Loads
The axial load level was calculated based on the assumption that a 12 foot wide panel is
supporting 60 foot of a 10DT24 double-tee roof deck. In addition to the self weight of the
deck, an additional 30 psf dead load and a roof live load, Lr, of 30 psf was used. The service load case, D+Lr, is equal to 18.9 kips per corbel. For the required design load of
3.2.2 Lateral Loads
Lateral wind loadings were determined in accordance to ASCE 7-02 assuming a building
classification of II, an exposure category of C, a building width of 200 feet, a building length
of 250 feet and an exterior wall and a flat roof with a mean height of 20 feet. The
topographic factor was assumed to be 1.0 and the directionality factor was assumed to be
0.85. For these conditions and a design wind speed of 120 MPH, the analytical procedure of
ASCE 7-02 section 6.5 predicts a wind pressure (windward force) of 25 psf and a wind
suction (leeward force) of 29 psf over the surface of the panel. The 29 psf wind suction is
equivalent to a total factored concentrated lateral wind load (1.6W120) of 11.2 kips total lateral load. This lateral load was assumed to act equally in both directions (ie: wind
pressure and suction are both assumed to equal the most severe value), so loads of the same
magnitude could be applied in both directions for each cycle.
3.2.3 Fatigue Cycles
In order to simulate the effects of wind loading over 50-year design lifetime of a panel, it
was desired to subject each panel to a fatigue loading regimen. A Weibull distribution
function was employed to rationally select the load increments and number of cycles for
fatigue loading based on published work (Hau 2000, Xu 1995, Manwell 2002).
The wind variation for a typical site is described using the Weibull distribution to model
the probability of occurrence for given wind speeds, where the probability distribution
function is defined below.
−
−
=
kc
U
exp
1
)
U
(
Where:
-P(U) is the Weibull probability distribution function -U is the wind speed being evaluated
-k and c are the shape factor and scale factor, respectively.
The shape factor and scale factor both depend on the mean wind speed and on the
standard deviation of wind speeds. Both can be determined from field-recorded wind data
and vary according to specific geographical location. In the absence of field-recorded data, it
is generally acceptable to assume a shape factor of 2.0 (Hau 2000, Xu 1995). This choice
creates a special form of the Weibull Distribution known as the Rayleigh Distribution where
the ratio of standard deviation to mean will be constant. This constant relationship allows the
Rayleigh Distribution to take the following form, dependent only on average mean wind
speed. Π − − = 2 V V 4 exp 1 ) V (
P Equation 3-3
Where:
-P(V) is the Rayleigh probability distribution function -V is the wind speed under consideration
-Vis the average mean wind speed for the location under consideration
The Rayleigh distribution versus wind speed is shown in Figure 3-8 for a mean wind
Weibull / Rayleigh Distribution 0.0 0.2 0.4 0.6 0.8 1.0 1.2
0 10 20 30 40 50 60 70 80 90 100
Wind Speed (mph)
P ro b ab ilit y ( % )
Figure 3-8: Probability distribution function
Once the distribution function was determined, the number of cycles likely to occur in a
design lifetime could be estimated. Noting that P(V) is the probability of a wind gust of a
given strength or less occurring at a given moment, one can conclude that [1-P(V)] is the
probability of a wind gust of a given strength or more occurring at any given moment.
Thus:
[1-P(V)] * Lifetime = Probable exposure time at or above a given wind speed
If the lifetime is taken in seconds, probable exposure time will be in seconds.
Assuming a set of conditions including a 50-year design lifetime, a 120 mph design wind
speed, and a mean annual wind speed between 13 and 14 mph, one can estimate the number
of cycles likely to occur at or above a given wind speed by multiplying the probable exposure
time in seconds by the expected vibration frequency of the panel. If it is conservatively
assumed that 1 full cycle (full load reversal on the panel) will occur for every second of
exposure over a given design lifetime. The number of cycles predicted by the Rayleigh
distribution at or above several given wind speeds are given in Table 3-4.
Table 3-4: Rayleigh probability of exposure at or above given wind speeds % of 120 mph
Design Wind Speed
Given
Wind Speed 1-F(V)
Probable # of Cycles (%) (mph) (% Probability) (#)
10 12 52.72973% 831442389
20 24 7.73076% 121898627
30 36 0.31514% 4969087
40 48 0.00357% 56320
45 54 0.00024% 3710
50 60 0.00001% 177
60 72 0.00000% 0.2
70 84 0.00000% 0.0
80 96 0.00000% 0.0
90 108 0.00000% 0.0
100 120 0.00000% 0.0
Note that the Rayleigh distribution is not dependent on the design wind speed. Thus, the
probability of occurrence for a given wind speed does not change with an increase in design
wind speed.
3.3 TEST SETUP
The test setup was designed and constructed to allow testing of the panels in a vertical
configuration. Vertical (axial) load was applied to each corbel using pressure-regulating
jacks and lateral load was applied to the panel using a computer-controlled hydraulic actuator.
3.3.1 General Setup and Loading
One braced steel frame was provided on each side of the panel to support an upper
cross-beam. This cross-beam in turn provided the upper lateral reaction. The top of the cross
beam was located approximately 2 inches above the top of the panel, allowing for sufficient
room to place a hinge assembly. The entire setup was constructed on a testing floor which