Efficiency of Generations
for Estimating Marker-Associated
QTL Effects by Multiple Regression
J. Moreno-Gonzalez
Centro de Investigaciones Agrarias de Mabegondo. Apartado 10, 15080 La Coruiia, Spain
Manuscript received November 14, 1992 Accepted for publication May 14, 1993
ABSTRACT
Knowledge about the efficiency of generations for estimating marker-associated QTLs is needed
for selection. T h e objective of this paper is to develop a theory to compare the efficiency of segregating
generations and testcrosses from the cross of two inbred lines differing in value for a quantitative
trait (PI x P2) for estimating additive, dominance and heterotic effects of QTLs by stepwise regression.
An equation that predicts the smallest gene effect in genetic standard deviation units that can be
detected with 50% chance at a significance level as a function of the heritability (h‘) and the
recombination frequency (r) of markers was developed for the segregating generations and testcrosses.
For estimating additive effects, the most efficient generation was the doubled-haploid (DH) lines; the
most inefficient was the North Carolina Design 111 (NCD III), followed by selfed backcrosses (SB);
the selfed families from FP individual plants (F2:3 lines) are inferior to the recombinant inbreds (RI)
for low r , but are better than RI for high h2 and r . Dominance effects are less efficiently estimated
than additive effects. T h e NCD 111 is better than the SB and the F2:3 lines for detecting dominance effects. T h e RI and DH do not estimate dominance effects. T h e differential heterotic Q T L effects of
lines PI and P2 when crossed with tester T can be estimated by evaluating testcrosses of individual F p
plants (F2T), recombinant inbreds (RIT) and double-haploid lines (DHT). The DHT is superior to
the other generations. The F2T is better than the RIT for r 2 0.20, but inferior for r 5 0.1 or low
heritabilit;.
T
HEORY on the identification and utilization of quantitative trait loci (QTL) associated with mark- ers has been formulated (THODAY 196 1 ; JAYAKAR1970; MCMILLAN and ROBERTSON 1974; SOLLER and BECKMAN 1983; LANDER and BOXSTEIN 1989; KNAPP, BRIDGES and BIRKES 1990; LANDE and THOMPSON 1990). Several statistical methods that include contrasting marker means (SOLLER and BECKMAN 1983), multiple regression (COWEN 1989; MORENO-GONZALEZ 1992a) and maximum likelihood (LANDER and BOTSTEIN 1989) have been suggested to estimate the Q T L effects. T h e use of individual mark- ers and flanking markers associated with QTLs has also been studied. However, no definitive method of mapping QTLs is still available. These approaches all have advantages and shortcomings. Application of the theory to breeding programs needs to answer some important questions: Which type of segregating gen- eration estimates most efficiently the additive and dominance effects of the QTLs? How do the number of progeny, mapping marker density, heritability and genetic variance of the trait affect the estimates? How can QTLs with specific heterotic effects be identified and selected for use in a hybrid breeding program? Different orthogonal generations from the cross of two inbreds have been proposed to estimate QTL effects linked to markers (SOLLER and BECKMAN 1983; COWEN 1988; KNAPP, BRIDGES and BIRKES 1990;
Genetics 1 3 5 223-231 (September, 1993)
MORENO-GONZALEZ 1992a). COWEN (1 988) compared the power of some of these generations for estimating gene effects by contrasting phenotypic class means of individual markers associated with one QTL.
T h e objective of this paper is to develop a theory to compare the efficiency of (a) segregating genera- tions from the cross of two parental inbred lines for estimating the additive and dominance effects of QTLs associated with markers and (b) their testcrosses for estimating the heterotic effects, using stepwise regression.
MATERIALS AND METHODS
Theory: T h e following segregating generations were
studied: selfed families from individual F2 plants (F2:3 lines),
selfed backcrosses (SB), recombinant inbreds (RI), doubled-
haploid lines (DH) and North Carolina Design 111 (NCD 111)
from the cross of two inbred lines (P, X P2). T h e following
model proposed by MORENO-GONZALEZ ( 1 992a) was applied:
P j = PO
+
E;
( a d ,+
d J ’ J+
(1)where
p,
is the phenotypic value of l i n e j in generations F2:9,SB, R1, DH or NCD 111; is the mean of Q T L genotypes;
a, and d , are the additive and dominance values of the QTL
associated with the marker segment Si (i = 1, 2,
. . .
n ) ; x’,and y‘, are dummy variables associated with a, and d,, re-
spectively; tj is the residual effect associated with line j ;
values of x’, and y’$ for the marker classes of generations
224 J. Moreno-Gonzalez
TABLE 1
Values of the dummy variables x' and y' for the marker classes of segregating generations and their testcrosses for a flanking marker model' when pi = ! h b and no epistasis is assumed
Segregating generations Testcrosses of generations
F2 lines Recombinant inbred lines backcross Selfed
F2
Doubled-
haploid Recombinant lines inbred lines
hyf::d
Marker Codedclass class X ' Y' X ' Y ' X ' Y ' x ' y ' X ' X ' X ' ~~
1 0 Dd 0 1 0 1 0 1 Dd
0.5 0.25 0.5 0.25 0.5
0 0.25 0 0 0 0 0 0
0.5 0.25 0.5 0.25 0.5
0 E t 0 0.5 0
-0.5 0.25 -0.5 0.25 -0.5
0 0.5
0 0.25 0 0 0 0 0 0
-0.5 0.25 -0.5 0.25 -0.5
-1 0 -D 0 -1 0 - 1 0 -1 -D
a Model for segregating generations: p, = C,(a,x,'+ dg,'); model for testcrosses: t, = z,h,x:.
p , is the ratio of the recombination frequencies between QTL i and its left-hand side flanking marker relative to that between the two
Marker classes 1, 2, 4 and 5 belong to the backcross to parent 1 and 5 ' , 6, 8 and 9 belong to the backcross to parent 2.
D = (1
-
r3/(1+
r 3 ; r, is the recombination frequency between flanking markers. flanking markers M , and M,+] ( r , ) .e E = (2 - 4r,
+
3r3/2(2 - 4r,+
4r3.MORENO-GONZALEZ (1 992a) and shown in Table 1 ; pi is the
ratio of the recombination frequency between QTL i and a
flanking marker to that between the two flanking markers
(KNAPP, BRIDGES and BIRKES 1990).
Testcrosses of individual F2 plants (F2T), recombinant
inbreds (RIT) and doubled-haploid lines (DHT) with an
inbred tester T were compared for estimating the differen- tial heterotic effect of marker-associated QTLs between the two parental lines. T h e generation of selfed families (STW)
from plants of the three-way cross (PI X P2) X T was also
included in the same group of comparisons. T h e following model was used:
t, = PO
+
c,
h,x',+
€1, (2)where t, is the phenotypic value of the testcross F2T, RIT,
DHT or STW; pcc0 is the mean; hi is one-half the difference
of the genotypic values of genotypes
'Q'Q
and 'Q'Q;, where'Q,, 'Q,, ' Q are the alleles of the QTL i associated with the
marker segment Si (i = 1, 2, . .
.
n) in the inbreds PI, P2 andT, respectively; x', are dummy variables associated with h,;
t, is the residual effect of testcross j ; values of x', for the
marker classes of generations F2T, RIT and DHT when pt
= Yz are shown in Table 1 ; T h e values of x', for generation
STW are the same than those for selfed backcrosses in Table
1.
Stepwise multiple linear regression analysis (DRAPER and
SMITH 1981) was applied to both models to estimate gene
effects.
Gene effects (gi) different from zero are detected at the
a level with 50% chance (MORENO-GONZALEZ 1992b), pro-
vided that:
g, > trt,a(Sc2C*,)v2, (3)
where tk,ol is the tabular t-value for the k degrees of freedom
of the residual mean squares and the chosen a significance
level; S: is the residual mean square and c,, is a diagonal
term of the matrix [ X ' X ] " ; where X is the design matrix
of the multiple regression analysis (DRAPER and SMITH
198 1). T h e expected values of c,, for additive and dominance
effects in the selfed backcross generation have been derived
(MORENO-GONZALEZ 1992b). Likewise, expected values of
c,, for F2:3 lines, recombinant inbreds, doubled-haploid lines,
NCD 111 and their testcrosses can also be derived using the
same approach and are shown in Table 2. Derivation of c,;
values for the FzZ3 generation is shown in Appendix 1 as an
illustrative example.
T h e residual mean square S,' of Equation 3 has the
following components:
s,'
= UE'+
ag.2+
02, (4)where uE2 is the environmental error variance; ugp2 is the
part of the genetic variance (a ') accounted for by Q T L not
yet included in the model; =:a a,,'
+
age2; ug"* is the partof the genetic variance accounted for by Q T L m the model;
@' is a component due to the deviations of the assigned
genotypic values to marker classes in the model from their
real genotypic values. T h e expected value of (P2 for the
selfed backcross generation was derived by MORENO-CON-
ZALEZ (1 992b). Likewise, expected values for other genera- tions can also be derived using the same approach and are
shown in Table 3. Derivation of (P2 for the F2:3 generation
is shown in Appendix 2 as an example. T h e following expressions hold:
where
p
is the portion of the total genetic variance accountedfor by the detected QTLs in the model. Taking into account
the above expressions, the following is derived:
gJag > JcPl.r.ol[l/hb2 - P ( 1
-
m)l (6)where g, is the smallest gene effect that can be detected in
a group of estimated QTLs that account for a portion
p
ofthe total genetic variance ;:a values of c,, are computed
from Table 2 and depend on the number of tested progeny,
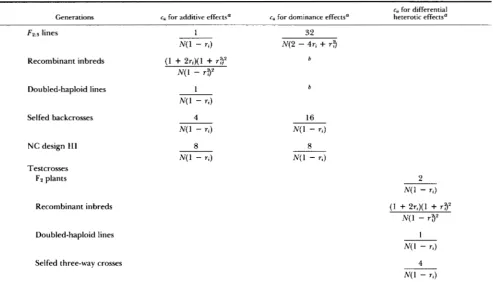
Expected values of the diagonal terms cii corresponding to additive, dominance and heterotic effects of QTL i in the inverse matrix
used for estimating gene effects of independent QTLs with different generations by multiple linear regression
Generations c, for additive effects" c,, for dominance effects"
c,, for differential heterotic effects"
FZz5 lines 1 3 2
N(1 - r , ) N ( 2 - 4 r ,
+
r 3Recombinant inbreds ( 1
+
2ri)(l+
r3' bN ( l - r y
Doubled-haploid lines 1 b
N( 1 - r , )
Selfed backcrosses 4
N ( 1 - r , )
NC design 111 8
N ( 1 - 7 , )
Testcrosses
F2 plants 2
N(1
-
r JRecombinant inbreds ( I
+
2r,)(1+
r3'N ( l - r3'
Doubled-haploid lines 1
N( 1 - r , )
Selfed three-way crosses 4
N(1 - r J
" N refers to the number of testing progenies and r, is the recombination frequency between flanking markers,
16
N(1
-
r , )8
N ( 1
-
r , )N o dominance effects are estimGed with inbred generations.
additivity, dominance or the differential heterosis of the two parental lines crossed to a tester; m is the coefficient of uzg- or uZh- in Table 3 and can be computed for different
generations and recombination frequencies; F l . k . a is the tab-
ular F-value in the F distribution for 1 and k (residual)
degrees of freedom at the a significant level; h? is the broad-
sense heritability.
T o make fair comparisons among generations, the small- est gene effects of each generation should be referred to a
common denominator (e.g., the genetic standard deviation
of the F2:5 lines when studying the segregating generations
and that of the F2T when studying their testcrosses). Then,
Equation 6 will be modified as follows:
gs > ~ c i i F l . k . u [ l / h F 2 : 3 2
-
1+
-
V P ( ~-
m)], (7)where g, (either additive a,, dominance d, or heterotic h,
effect) is the smallest gene effect in F2:3 or F2T genetic
standard deviation units; hZF2,s is the heritability of the F P : ~
lines; and u is the ratio of the genetic variance of the
generation under study to that of the FeZ3 or F2T.
RESULTS A N D DISCUSSION
Equation 6 predicts the smallest gene effect that can be detected with a 50% chance at the a signifi- cance level when a group of QTLs, which accounts for a portion
p
of the genetic variance, has already been estimated by the model using stepwise regres- sion. T h e equation is valid for any distribution of gene effects. T h e stepwise regression incorporates QTLsinto the model starting with the largest gene effect. Once a QTL is in the model, it accounts for a portion of the genetic variance and thus reduces the least significant value for incorporating the next Q T L into the model. T h e process continues until the decreasing least significant value is larger than the Q T L effect being tested (presumably, the smallest effects from the distribution). For the particular case of equal gene effects, once the first Q T L enters in the model, the remaining QTLs will be easier detected. However, this unlikely situation of equal effects is the most unfavorable for incorporating the first Q T L into the model (MORENO-GONZALEZ 1992b), because no gene effect is larger than the others. Equations 5-7 relate several parameters such as gene effects, genetic vari- ance, heritability, marker density and number of prog- eny (included in the ci, expressions of Table 2). There- fore, they can be managed to study different genetic situations under proper assumptions. Some situations will be studied below.
226 J. Moreno-Gonzalez
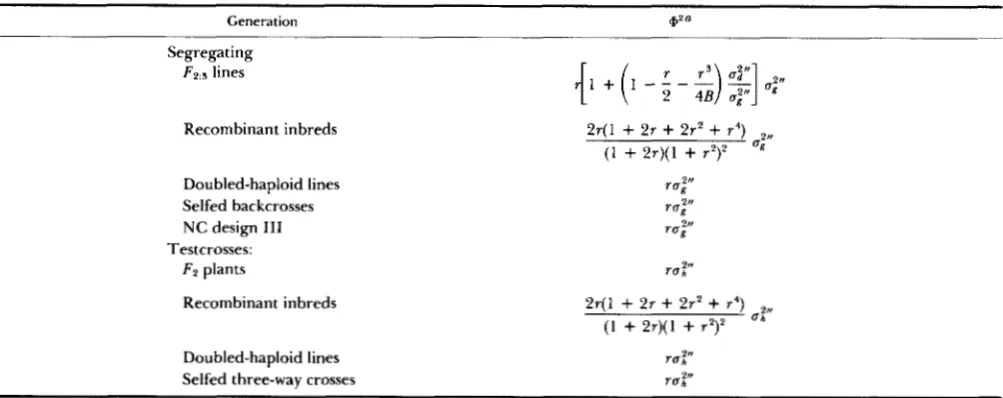
TABLE 3
Expected values of the squared deviations (0') of the assigned genotypic values to marker classes from their real genotypic value for different generations
Generation @a
Segregating
F2.5 lines
Recombinant inbreds
Doubled-haploid lines Selfed backcrosses NC design 111
Testcrosses:
F2 plants
ru,2" ru?
ru,21)
ruf"
Recombinant inbreds 2r(l
+
27+
2 r 2+
r4)( 1
+
2r)(l+
r2)2 U YDoubled-haploid lines ruf"
Selfed three-way crosses ruf"
a The whole expression that multiplies n? or u i - corresponds to m in equations 5-7; u?, ua" and u y refer to the genetic, dominance and
B = '/z
-
r+
r2; r is the recombination frequency between two consecutive flanking markers.heterotic-effect variances of the corresponding generation accounted for by QTL in the model, respectively.
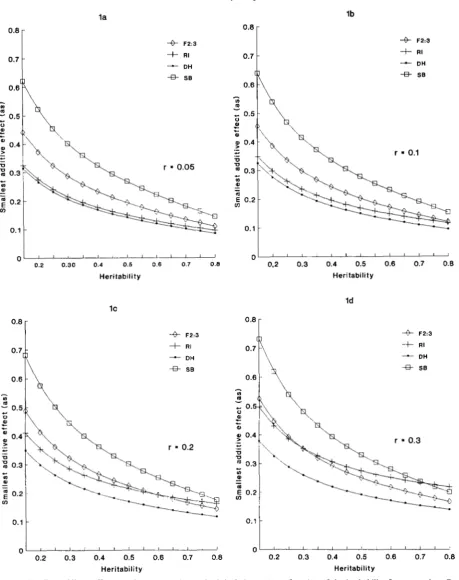
eny size ( N = 500) and the fraction ( P = 0.95) of the genetic variance accounted for by the QTLs in the model were kept constant for all cases. Complete dominance was assumed for computing m (Table 3)
and v ; v = 1, 16/9, 16/9, 5/9 and 4/3 for F2:3, RI, DH, SB and NCD 111, respectively. T h e most efficient generation for detecting the smallest additive effects in all situations is the doubled-haploid lines. By the contrary, the most inefficient generation among the four plotted is the SB, except for high r and h2 where RI is worst (Figure Id). The NCD I11 (plot not shown) is even more inefficient than the SB, as it is easily seen by comparing their cii values from Table 2. Unfortu- nately, random doubled-haploid lines cannot be de- veloped in most of the crops, thus their use is very limited. T h e F2:S lines are inferior to RI for low r (Figure 1, a and b), but are better than RI for high heritability and r (Figure 1, c and d). Comparison of RI and DH shows that RI is almost as efficient as DH for small recombination frequencies and any herita- bility value, e.g., r = 0.05 (Figure la) and r = 0.1 (Figure lb). However, RI lose their relative efficiency
as the recombination frequency between markers in- creases. Therefore, random recombinant inbreds can be an appropriate option for detecting small additive effects when the marker density of the genome is high or the heritability of the trait is low. F2:s lines are preferable for a situation with high heritability and low or moderate marker density. T h e progeny size ( N ) affects the a, value by the reciprocal of its square root [cji (Table 2) in Equation
71,
but it does not alter the relative efficiency of generations. If no dominance was assumed, the efficiency of the F2:3 lines relative toRI and DH will increase and will follow the same pattern than F2T relative to RIT and DHT in Figure 2, a to d.
Dominance effects can be detected with Fp, lines and SB. However, significant estimates of the smallest dominance effects (d,) are much larger than those of the smallest additive effects (a,) as is easily seen by looking at the values of cii from Table
2.
By comparing the cii values for additive and dominance effects, the efficiency of significant estimates of a, relative to d, is approximately 2& for the F ~ : s lines and 2 for SB. T h e NCD 111 is more efficient than F2:S and SB for detecting dominance effects, because of its smaller ciivalue (Table 2). T h e smallest significant dominance effects for SB are approximately
&
times larger than for NCD 111.T h e pedigree method is a common breeding strat- egy for developing inbred lines from a chosen cross
la
":'
0.6
::\
0.6
l b
r = 0.1
0.2 0.30 0.4 0.5 0.6 0.7 0.8
Heritability
0.2 0.3 0.4 0.5 0.6 0.7 0.8
Heritability
IC
0.8
0.6
Id
0.2 0.3 0.4 0.5 0.6 0.7 0.0
Heritability
0.2 0.3 0.4 0.5 0.6 0.7 0.8
Heritability
FIGURE I.-Smallest additive effects (as) in F2:. genetic standard deviation units as function of the heritability for generations F2:s lines (F~:J), double-haploid lines (DH), recombinant inbreds (RI) and selfed backcrosses (SB). when the recombination frequency ( r ) between markers was assumed to be r = 0.05 (la), r = 0.1 ( 1 b), r = 0.2 (IC) and r = 0.3 (Id).
228 J. Moreno-Gonzalez
2a 2b
0.8
0.6
F 2 T
+
R I TA
D H T
*
STW0.2 0.3 0.4 0.5 0.6 0.7 0.8
Heritability
2c 0.8
0.7L
-e- F2T+
RITA DHT
*
STWO.l
I
o L l l I l l I I I l ~
0.2 0.3 0 . 4 0.5 0.6 0.7 0.8
Heritability
+
F 2 T+
R I T-
D H T8 STW
0
0.2 0.3 0.4 0.5 0.6 0.7 0.0
Heritability
2d
+
F2T+
RIT& DHT
8 STW
O.l
t
o ' " ' ~ l ~ ' l l l "
0.2 0.3 0.4 0.5 0.6 0.7 0.8
Heritability
FIGURE 2.-Smallest heterotic effects (hs) in F2T genetic standard deviation units as function of the heritability for testcrosses with tester
T from F2 plants (F2T), double-haploid lines (DHT) and recombinant inbreds (RIT) and selfed families (STW) from the three-way cross (PI X P2) X T, when the recombination frequency ( r ) between markers was assumed to be r = 0.05 (2a), r = 0.1 (2b), r = 0.2 (2c) and r = 0.3 ( 2 4 .
especially when the marker density of the genome is not high and the heritability is not low. The RIT will
be preferable when a high marker density is feasible. T h e differential heterotic effect (h,) was set up as one-half the difference between the genotypic values of 'Q'Q and 'Q'Q in Equation
2.
If dominance of favorable alleles is assumed as the dominance hypoth- esis of heterosis requires, then differential heterotic effects exist provided that (a)'a
and 'Q have different gene effects and (b)4
'
,
is recessive for at least one of the two parental alleles. If a superior *PI X T hybrid is sought by improving line P I through backcrossing, favorable heterotic effects can be identified in P2 and later transferred to PI.Dominance effects cannot be efficiently estimated in the segregating generations of PI X PP, but the differential heterotic effects (a kind of dominance) of
two QTL alleles when they are both in the heterozy- gous state with a common tester allele can be effi- ciently estimated by evaluation of appropriate test- crosses. Identification of these heterotic effects are especially important for hybrid breeding programs.
General assumptions of the model: T h e c,, values to estimate the smallest gene effects (Equations 5-7,
Table 2) were obtained for independent QTLs. If linked QTLs were assumed, the c;, values would be larger than those expressed in Table 2 when the QTLs are incorporated into the model, because of the rela-
tionship among gene effects. Thus, the model is less efficient for linked than for independent QTLs. In addition, pi = 0.5 was assumed for all QTLs in the model. However, true values of p , different from 0.5 will produce only a slight bias in the estimates (MOR- ENO-GONZALEZ 1992b).
This work was supported in part by the CICYT (Comisih
0265
Interministerial de Ciencia y Tecnologia, Spain) grant AGR 90-
L I T E R A T U R E CITED
COWEN, N. M., 1988 The use of replicated progenies in marker- based mapping of QTLs. Theor. Appl. Genet. 7 5 857-862. COWEN, N. M., 1989 Multiple linear regression analysis of RFLP
data sets used in mapping QTLs, pp. 113-1 16 in Development
and Application of Molecular Markers to Problems in Plant Ge-
netics, edited by T . HELENTJARIS and B. BURR. Cold Spring
Harbor Laboratory, Cold Spring Harbor, N.Y.
DRAPER, N. R., and H. SMITH, 1981 Applied Regression Analysis, Ed. 2. John Wiley, New York.
DUDLEY, J. W., 1984 A method of identifying lines for use in improving parents of a single cross. Crop Sci. 24: 355-357. DUDLEY, J. W., 1987 Modification of methods for identifying
inbred lines useful for improving parents of elite single crosses. Crop Sci. 27: 944-947.
JAYAKAR, S. D., 1970 On the detection and estimation of linkage between a locus influencing a quantitative character and a marker locus. Biometrics 2 6 451-464.
KNAPP,
s.
J., W. C. BRIDGES, JR. and D. BIRKES, 1990 Mapping quantitative trait loci using molecular marker linkage maps. Theor. Appl. Genet. 7 9 583-592.LANDE R., and R. THOMPSON, 1990 Efficiency of marker-assisted selection in the improvement of quantitative traits. Genetics
LANDER, E. S., and D. BOTSTEIN, 1989 Mapping mendelian factors underlying quantitative traits using RFLP linkage maps. Ge- netics 121: 185-199.
MCMILLAN, I . , and A. ROBERTSON, 1974 The power of methods for detection of major genes affecting quantitative characters. Heredity 32: 349-356.
MORENO-GONZALEZ, J., 1992a Genetic models to estimate additive and non- additive effects of marker-associated QTL using multiple regression techniques. Theor. Appl. Genet. 85: 435- 444.
MORENO-GONZALEZ, J., 1992b Estimates of marker-associated QTL in Monte Carlo backcross generations using multiple regression. Theor. Appl. Genet. 85: 423-434.
SOLLER, M., and J. S. BECKMAN, 1983 Genetic polymorphism in varietal identification and genetic improvement. Theor. Appl. Genet. 67: 25-33.
THODAY, J. M . , 1961 Location of polygenes. Nature 191: 368- 370.
1 2 4 743-756.
Communicating editor: T. F. C. MCKAY
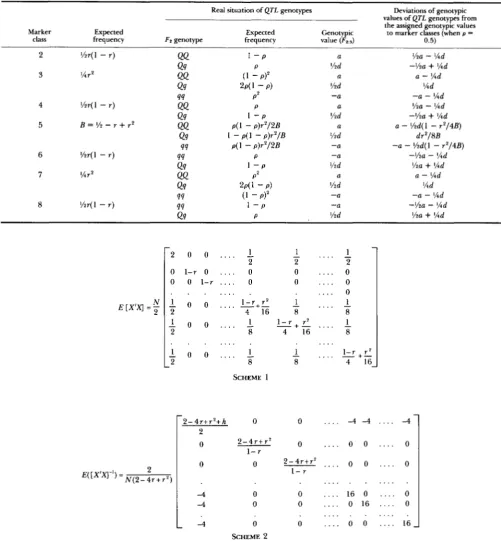
APPENDIX 1
T h e X design (data) matrix (Table 4) can be written for the F2:3 generation in the model of Equation 1, where B = '/2
-
r+
r2; E = (2 - 4r + 3r2)/2(2-
4r+
4r2); N is the number of scored individuals in theF P : ~ generation; 110 has already been defined; x),,
sponding to the additive and dominance effects of Q T L i, i
+
1....
respectively; values of x' and y' are taken from Table 1 ; r is the recombination frequency between flanking markers. If the QTL are unlinked (independent), the expected X'X matrix (E[X'X]) is obtained, as shown in Scheme 1, where column 1 corresponds to po; columns 2 tof
+
1 correspond tovariables x), associated with additive effects and col- umns
f
+
2
tof
+
h+
1 correspond to variables y',associated with dominance effects; f and h are the
x);+*,
. . .
and y,, y t t + l ,. . .
are dummy variables corre-TABLE 4
X design matrix
Values of variables in the data matrix X
Expected
Individual class marker class w,, . . . x:+! x,' . . . y,' $+I . . .
Marker frequency of
1 1 % ( I - r)' 1 . . . 1 1 . . . .
o
0 . . . . 2 2 %r(l - r ) 1 . . . % Y z . . . . % % , , . .3 3 %r2 1 . . . 0 0 . . . . % % . . . .
4 %r(l
-
r ) 1 . . . Y2 % . . . . % % . . . . 45 5 B 1 . . . 0 0 . . . . E E . . . . 6 6 %r(l
-
r ) 1 . . . -% - M . . . . '/4 % . . . . 7 7 % r 2 1 . . . 0 0 . . . . % %. . . .8 8 %r(I
-
r ) 1 . . . -% - % . . . . '/4 % . . . .9 9 % ( I - r ) ' 1 . . . - I - 1 . . .
. o
0 . . . . . . . . . . . . . . . . . . . . . .230 J. Moreno-Gonzalez
TABLE 5
Deviations of the real genotypic values of the QTL genotypes from the genotypic values assigned to the marker classes for the Fzzs
generation
~
Real situation of QTL genotypes Deviations of genotypic values of QTL genotypes from the assigned genotypic values Marker Expected
class frequency Fp genotype frequency Expected value Genotypic (&) to marker classes (when 0.5) p =
2 % r ( l - r ) QQ 1 - P a %a
-
%dQ9 P %d
3 %r2 QQ (1 - P)2 a a
-
%dQ4 2P(l
-
P ) %d %d94 P2 -a -a - %d
4 %r( 1 - r )
-
%dQ9 I - P Y2 d -%a
+
%d5 B = 1 / 2 - r + r 2
-
r 2 / 4 B )Q9 1 - p ( 1
-
p)r2/B %d d r 2 / 8 B99 ~ ( 1 - p ) r 2 / 2 B -a -a - % d ( l - r 2 / 4 B )
Q4 I - P %d %a
+
%d7 % r 2 QQ P 2 a a - %d
Q9 2P(l
-
P ) %d %d94 ( 1 - P)' -a -a - %d
8 %r(l - r ) 44 1 - P -a -%a
-
%dQ9 P %d %a
+
%d -%a+
%d6 % r ( l - r ) 49 P -a -%a
-
%dE [X'X] = - N
2
. . .
. . .
2 0 0 0 1-r 0 0 0 1-r
. . .
. . .. -1
2 -
1
2 . . .
-
1 2.
o
0. . . .
0.
o
0 . . . . 0. . . 0
11
0 0 . . . . -+- 1 - r r' 12 4 16
-
8 . .1 -1 - r
+ r
'
. . . .
- 18 4 16 8
. . . . . . . I
2
N ( 2 - 4 r + r 2 )
SCHEME 1
-
2 - 4 r + r 2 + h 0
2
0
0 0
2 - 4 r + r 2 1 - r
-4 0
-4 0
-
-4 00 . . . . - 4 - 4 . . . . -4
0 . . . . 0 0 . . . . 0
2 - 4 r + r 2 . . . . 0 0 . . . . 0
1 - r
. . .
0 . . . . 1 6 0 . . . . 0 0 . . . . 0 1 6 . . . . 0
. . . 0 . . . . 0 0 . . . . 16
SCHEME 2
number of variables with additive and dominance
effects in the model, respectively. T h e expected in- 4r + r2), respectively.
the independent QTL i are 2/N(1
-
r ) and 3 2 / N ( 2-
verse matrix was computed and is shown in Scheme 2.
Therefore, the expected values of the diagonal T h e deviations of the real genotypic values of Q T L terms c,, for the additive and dominance effects from genotypes from the genotypic values assigned to the
marker classes 2-8 in the model for the FZz3 generation respectively; r is the recombination frequency be- are shown in Table 5 . T h e deviations for the marker tween markers; and B = %
-
r+
r2. Taking into classes 1 and 9 are zero. T h e sum of squares of these account that %(a2+
%d2) and d2/16 are the genetic deviations multiplied by their corresponding frequen- (a2/) and dominance (a”’’) variances of the F2:3 lines cies yields the expected value of@’.
Avoiding cum- for the Q T L in the model, respectively, thenbersome algebra and assuming p = %, the following
result is obtained from Table 5 : (P2 = r[u’/
+
a2d”( 1-
1/2r-
r 3 / 4 B ) ]= r [ l