MURUGANANDAM, SUBATHRA. Soil Aggregate-Associated Microbial Community Structure and Nitrogen Transformations in Three Different Tillage Systems. (Under the direction of Dr. Daniel W. Israel).
Soil management practices such as tillage largely influence soil aggregates and microbial communities that reside on different soil aggregate size fractions. Microbial communities that are central to the N cycle determine plant-available N and N losses via leaching and gaseous emissions. Although some research studies described the role of soil aggregates in C sequestration, very little information is available regarding the link between the soil aggregate size fractions and N cycling processes. The objectives of this research were: 1) to determine the population size of N mineralizers, nitrifiers, and denitrifiers by measuring the potential rates of N mineralization, nitrification, and denitrification, respectively; 2) to assess the activities of enzymes involved in the N mineralization process; 3) to quantify the gross N mineralization, nitrification, and immobilization rates; and 4) to relate the microbial community composition and rates of N processes associated with soil aggregate size fractions of no-till, chisel, and moldboard tillage systems.
and communities associated with N cycling. Therefore, soil microbial community composition and gross N transformation rates associated with soil aggregate size
fractions of the three tillage systems were quantified using the 15N pool dilution method. Nitrogen fluxes estimated from the FLUAZ program demonstrated that gross N
mineralization, nitrification, and immobilization rates were significantly greater (1.5-2 times) in no-till than in chisel and moldboard systems. Gross N mineralization and nitrification rates were approximately 20 to 25% greater in intermediate aggregates (0.5-1mm) than in other aggregate size fractions. NMS analysis of the microbial community composition analyzed by Phospho Lipid Fatty Acid (PLFA) method both before (A = 0.3205, P <0.005) and after (A = 0.1951, P <0.005) 15N addition illustrated that microbial
communities differed with tillage systems but not with aggregate size. Thus, this study demonstrated that higher microbial biomass in long-term no-till soils has resulted in more rapid N turnover via balanced N mineralization, nitrification, and immobilization
processes than in tilled soils. However, more detailed studies involving the measurement of NO3 leaching losses are required to formulate best N management practices in
SOIL AGGREGATE-ASSOCIATED MICROBIAL COMMUNITY STRUCTURE AND NITROGEN TRANSFORMATIONS IN THREE DIFFERENT TILLAGE
SYSTEMS
by
SUBATHRA MURUGANANDAM
A dissertation submitted to the Graduate Faculty of North Carolina State University
in partial fulfillment of the requirements for the Degree of
Doctor of Philosophy SOIL SCIENCE Raleigh, North Carolina
2007 APPROVED BY:
_________________________ _________________________ Dr. Daniel W. Israel Dr. Michael G. Wagger (Chair of Advisory Committee)
__________________________ _________________________ Dr. James W. Brown Dr. Dean L. Hesterberg
DEDICATION
This dissertation is dedicated to my family - my mom, Krishnammal, my dad,
BIOGRAPHY
Subathra Muruganandam was born as the only daughter of the family of
Muruganandam and Krishnammal in Sivaganga, a small town near Madurai, India. She received her school education from 21st Century International School, Sivaganga. Then, she was admitted to TamilNadu Agricultural University, Coimbatore, India to get her undergraduate degree in Agriculture. Following her graduation, she moved to the University of Agricultural Sciences, Bangalore, India, to pursue her Masters in
ACKNOWLEDGEMENTS
Thanks to the almighty! I extend my sincere gratitude to my advisors Dr. Daniel W. Israel and Dr.Wayne P.Robarge for their guidance, cooperation and support
throughout my program.
I would also extend my special appreciation to Drs. Michael Wagger and Keith Cassel for their suggestions, consideration, and continuous encouragement for the successful completion of this program. Without their kindness, it would not have been possible for me to complete this PhD program. Equally, I would like to thank my advisory committee members Dr. Jim Brown and Dr. Dean Hesterberg for their suggestions and comments.
TABLE OF CONTENTS
LIST OF TABLES………viii
LIST OF FIGURES………...x
CHAPTER 1 LITERATURE REVIEW... 1
Soil aggregate hierarchy ... 1
Aggregate-associated soil heterogeneity... 2
Aggregate-associated soil microbial community and N cycling ... 4
Soil microbial communities and nitrogen cycling in different tillage systems... 6
References... 10
CHAPTER 2 RELATIVE DISTRIBUTION OF AGGREGATE–ASSOCIATED N MINERALIZERS, NITRIFIERS AND DENITRIFIERS IN THREE DIFFERENT TILLAGE SYSTEMS... 16
Abstract... 16
Introduction... 17
Materials and methods ... 19
Site description... 19
Sampling and aggregate separation ... 20
Soil physical and chemical analyses... 20
Biomass C and N ... 21
Basal respiration... 21
Active population size of N mineralizers, nitrifiers and denitrifiers ... 22
Statistical analyses ... 23
Results... 23
Whole soil results... 23
Whole soil physicochemical properties ... 23
Whole soil microbiological properties... 24
Soil aggregates results... 25
Total carbon and nitrogen ... 25
Soil microbial biomass carbon and nitrogen... 25
Basal respiration and metabolic quotient... 26
Potential nitrification mineralization and denitrification... 26
Discussion... 28
References... 33
APPENDIX... 45
Appendix 1. Aggregate-size distribution in three different tillage systems by dry sieving method... 46
CHAPTER 3 ACTIVITIES OF N MINERALIZATION ENZYMES ASSOCIATED WITH SOIL AGGREGATES OF THREE DIFFERENT TILLAGE SYSTEMS... 47
Abstract... 47
Introduction... 48
Materials and methods ... 51
Site description... 51
Sampling and aggregate separation ... 51
Soil enzyme assays ... 53
Microbial community composition... 55
Statistical analysis... 56
Results... 57
Effect of soil aggregate size fractions and tillage systems on soil properties... 57
Activities of aggregate-associated aminization enzymes ... 58
Activities of aggregate-associated ammonification enzymes ... 59
Microbial community composition of aggregate size fractions and whole soil of three tillage systems... 59
Relating microbial community composition with enzyme activities... 60
Discussion... 61
References... 65
APPENDIX ... 78
CHAPTER 4 SHORT-TERM NITROGEN TRANSFORMATIONS ASSOCIATED WITH SOIL AGGREGATES AND MICROBIAL COMMUNITY
COMPOSITION IN THREE DIFFERENT TILLAGE SYSTEMS... 81
Abstract... 81
Introduction... 82
Materials and methods ... 85
Sampling and aggregate separation ... 85
15N Incubation experiment... 86
Fluaz model... 88
Microbial community composition associated with soil aggregates ... 89
Statistical analysis... 90
Results…... 92
Soil chemical and microbial characteristics... 92
Size and atom % 15N excess of ammonium, nitrate and organic N pools ... 93
Gross transformation rates calculated by FLUAZ program ... 94
Changes in microbial community composition ... 96
Relation between microbial community composition and soil N processes... 97
Discussion... 98
References... 104
APPENDICES ... 132
Appendix 1. Gross nitrogen transformation rates associated with soil aggregate size fractions of three different tillage systems... 133
Appendix 2. Gross N mineralization rates calculated using equations by Kirkham and Bartholomew (1954) and FLUAZ model... 135
Appendix 3. Gross nitrification rates calculated using equations by Kirkham and Bartholomew (1954) and FLUAZ model. ... 136
Appendix 4. Pearson and Kendall correlation with NMS ordination axes of PLFAs (Before 15N injection). Note r and R2 represent Pearson correlation and tau represents Kendall correlation coefficients... 137
LIST OF TABLES
CHAPTER 2 RELATIVE DISTRIBUTION OF AGGREGATE–ASSOCIATED N MINERALIZERS, NITRIFIERS AND DENITRIFIERS IN THREE
DIFFERENT TILLAGE SYSTEMS
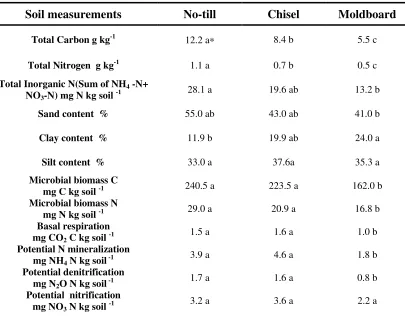
Table 1. Whole soil physico-chemical and microbiological properties in three different tillage systems... 37 Table 2. Total C and N and inorganic N distribution in soil aggregate fractions of three
different tillage systems. ... 38 Table 3. Summary of p-value statistics for aggregate size distribution( ASD), total
carbon (TC), total nitrogen (TN), inorganic nitrogen (IN), microbial biomass carbon (MBC), microbial biomass nitrogen (MBN),Basal respiration(BR), and metabolic quotient(qCO2) across aggregate size fractions from three different
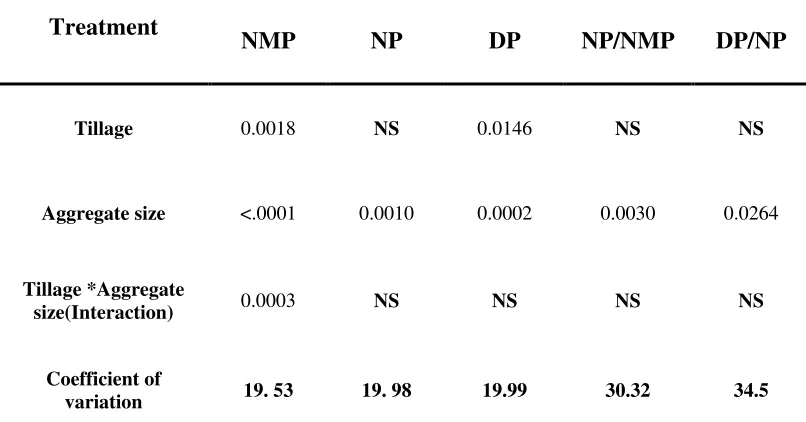
tillage systems. Non-significant is highlighted in bold... 39 Table 4. Summary of p-value statistics for N mineralization potential (NMP),
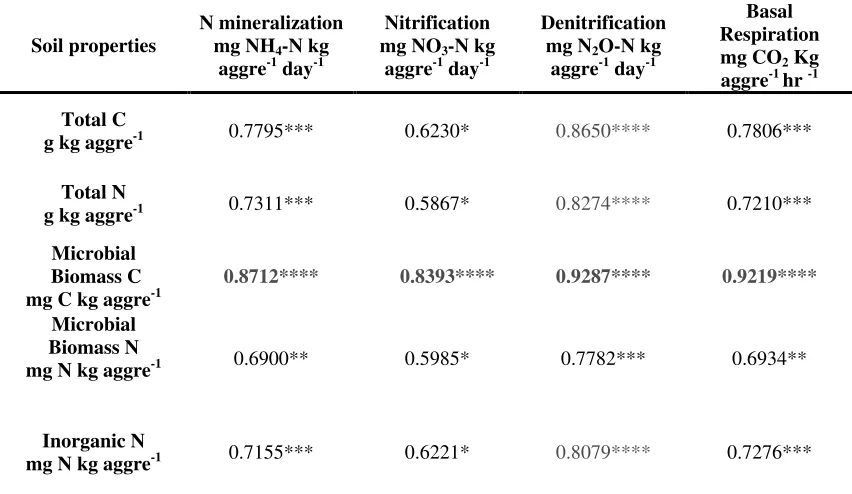
nitrification potential (NP), denitrification potential (DP), ratio of N mineralization potential to nitrification potential (NMP/NP), and ratio of ntrification potential to denitrification potential (NP/DP) across aggregate size fractions from three different tillage systems. ... 39 Table 5. Significant correlation coefficient between soil properties and potential N rates.
... 40 CHAPTER 3 ACTIVITIES OF N MINERALIZATION ENZYMES ASSOCIATED
WITH SOIL AGGREGATES OF THREE DIFFERENT TILLAGE SYSTEMS Table 1. Effect of aggregate size fractions and three different tillage systems on soil
microbial biomass and potential N mineralization ... 69 Table 2. Correlations between total enzyme activities and potential N mineralization.... 70 Table 3. Effect of soil properties on potential integrated enzyme activities (NMS axis1)71 Table 4. Correlation coefficients between potential enzyme activities and microbial
community composition (NMS axis 1)... 71 Table 5. Correlation coefficients of the fungal biomarkers 18: 2 6c and 16:1 5c (mole %)
with N mineralization enzyme activities... 72 Table 6. Pearson correlation coefficients (r) between PLFA profiles (mol %) and
Bold values were significantly correlated with enzyme activity at P<0.05
significance level. ... 73 CHAPTER 4 SHORT-TERM NITROGEN TRANSFORMATIONS ASSOCIATED
WITH SOIL AGGREGATES AND MICROBIAL COMMUNITY COMPOSITION IN THREE DIFFERENT TILLAGE SYSTEMS
Table 1. Distribution of soil carbon and nitrogen among soil aggregates of three tillage systems... 110 Table 2. Distribution of microbial biomass carbon and nitrogen among soil aggregates of
three tillage systems... 111 Table 3. P Value statistics for total C and N and microbial biomass C and N (MBC and
MBN). ... 112 Table 4. P-value statistics of gross nitrogen transformation rates associated with soil
aggregates of the three tillage systems. GNMR (Gross N Mineralization Rate), GNR (Gross Nitrification Rate) and GIR (Gross Immobilization Rate). ... 113 Table 5. P value statistics of the ratios of gross rates of nitrification, N mineralization,
and immobilization. GNMR (Gross N Mineralization Rate), GNR (Gross
Nitrification Rate) and GIR (Gross Immobilization Rate). ... 114 Table 6. Distribution of the ratios of GNR/GIR and GNR/GNMR among aggregate size
fractions of the three tillage systems (0-2 day interval only). GNR (Gross Nitrification Rate), GIR (Gross Immobilization Rate) and GNMR (Gross N
mineralization Rate)... 114 Table 7. Relationship between N process rates and soil and microbial characteristics
GNMR (Gross N Mineralization Rate), GNR (Gross Nitrification Rate) and GIR (Gross Immobilization Rate)... 115 Table 8. Stepwise regression between N process rates and soil and microbial
characteristics. GNMR (Gross N Mineralization Rate), GNR (Gross Nitrification Rate) and GIR (Gross Immobilization Rate). ... 116 Table 9. Estimated net N mineralization rate and nitrification rates associated with
aggregate size fractions of the three tillage systems (for 0-2 day interval
LIST OF FIGURES
CHAPTER 2 RELATIVE DISTRIBUTION OF AGGREGATE–ASSOCIATED N MINERALIZERS, NITRIFIERS AND DENITRIFIERS IN THREE
DIFFERENT TILLAGE SYSTEMS
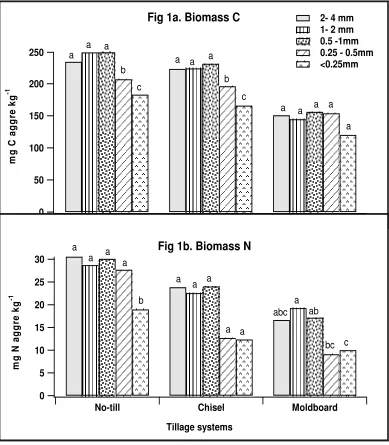
Figure 1. Distribution of microbial biomass C (1a) and N (1b) among aggregate size fractions from three tillage systems. Bars represent mean values of four replications. Mean values among the different aggregate size fractions were compared within each tillage systems. Mean values for bars within each tillage system followed by the same lower case letter are not significantly different at p <0.05 significance level. Biomass C and N LSD values where N-No-till; C-chisel; M-Moldboard;... 41 Figure 2. Effect of aggregate size fractions and tillage systems on basal respiration (2a)
and metabolic quotient (qCO2) (2b). Bars represent mean values of four
replications. Mean values among the different aggregate size fractions were compared within each tillage systems. Values for bars within each tillage system followed by the same lower case letter are not significantly different at p <0.05 significance level. Respiration and qCO2 LSD values where N-No-till; C-chisel;
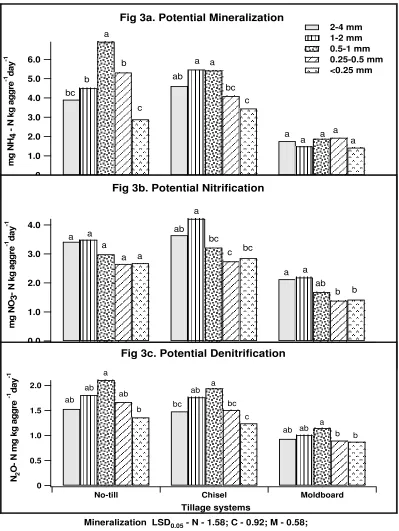
M-Moldboard;... 42 Figure 3. Effect of aggregate size fractions and tillage systems on rates of potential N
mineralization (3a), potential nitrification (3b) and potential denitrification (3c). Bars represent mean values of four replications. Mean values among the different aggregate size fractions were compared within each tillage systems. Values for bars within each tillage system followed by the same lower case letter are not significantly different at p <0.05 significance level. Mineralization, nitrification and denitrification LSD values where N-No-till; C-chisel; M-Moldboard; ... 43 Figure 4. Effect of aggregate size fractions and tillage systems on relative rates of
potential nitrification to N mineralization (4a) and potential nitrification to denitrification (4b). Bars represent mean values of four replications. Mean values among the different aggregate size fractions were compared within each tillage systems. Values for bars within each tillage system followed by the same lower case letter are not significantly different at p <0.05 significance level. NP/NMP and DP/NP LSD values where N-No-till; C-chisel; M-Moldboard;... 44 CHAPTER 3 ACTIVITIES OF N MINERALIZATION ENZYMES ASSOCIATED
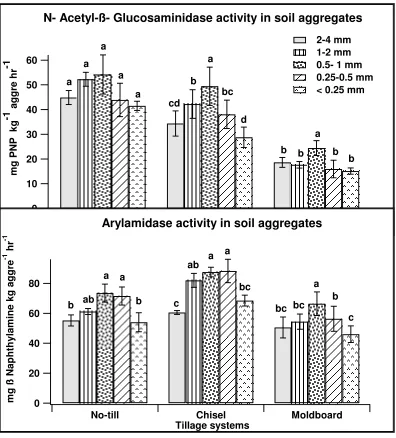
WITH SOIL AGGREGATES OF THREE DIFFERENT TILLAGE SYSTEMS Figure 1. Activities of enzymes involved in aminization phase of N mineralization
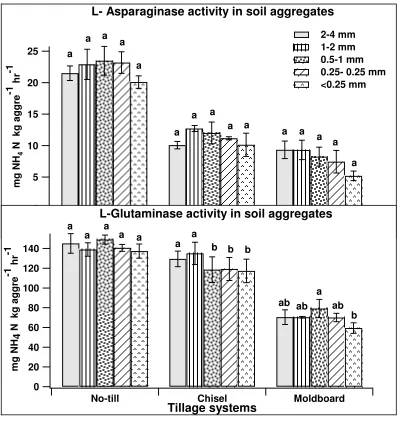
each tillage system followed by the same lower case letter are not significantly different at p <0.05 significance level. ... 74 Figure 2. Activities of enzymes involved in ammonification phase of N mineralization
process in soil aggregates of three different tillage systems. Bars represent mean values of four replications. Mean values among the different aggregate size fractions were compared within each tillage systems. Mean values for bars within each tillage system followed by the same lower case letter are not significantly different at p <0.05 significance level. ... 75 Figure 3. Nonmetric Multidimensional Scaling (NMS) ordination plot of PLFA relative
abundance of soil aggregate fractions of three different tillage systems. The percentage of variation explained by each axes is given as r2 values in the
parentheses... 76 Figure 4. Nonmetric Multidimensional Scaling (NMS) ordination plot of activities of
four enzymes involved in N mineralization process of soil aggregate fractions of three different tillage systems. The percentage of variation explained by each axes is given as r2 values in the parentheses. ... 77 CHAPTER 4 SHORT-TERM NITROGEN TRANSFORMATIONS ASSOCIATED
WITH SOIL AGGREGATES AND MICROBIAL COMMUNITY COMPOSITION IN THREE DIFFERENT TILLAGE SYSTEMS
Figure 1. Change in the ammonium pool size of soil aggregate fractions of the three tillage systems. Symbols represent mean values of four replicates and error bars represent standard error of the mean... 117 Figure 2. Change in the nitrate pool size of soil aggregate fractions of the three tillage
systems. Symbols represent mean values of four replicates and error bars
represent standard error of the mean... 118 Figure 3. Change in the atom % 15N excess of soil aggregate size fractions of the three
tillage systems after the addition of 15(NH4)2SO4 and K14NO3. Symbols represent
mean values of four replicates and error bars represent standard error of the mean. Note the scales on left and the right Y axes are different. Left Y axes represent ammonium enrichment and right Y axes represent nitrate enrichment. ... 119 Figure 4. Change in the atom % 15N excess of soil aggregate size fractions of the three
tillage systems after the addition of 14(NH4)2SO4 and K15NO3. Symbols represent
Figure 5. Gross N mineralization rates associated with soil aggregates of three tillage systems. Symbols represent mean values of four replicates and error bars
represent standard error of the mean... 121 Figure 6. Gross nitrification rates associated with soil aggregates of three tillage systems.
Symbols represent mean values of four replicates and error bars represent
standard error of the mean. ... 122 Figure 7. Gross immobilization rates associated with soil aggregates of three tillage
systems. Symbols represent mean values of four replicates and error bars
represent standard error of the mean... 123 Figure 8. Gross ammonium immobilization rates associated with soil aggregates of three
tillage systems. Symbols represent mean values of four replicates and error bars represent standard error of the mean... 124 Figure 9. Gross nitrate immobilization rates associated with soil aggregates of three
tillage systems. Symbols represent mean values of four replicates and error bars represent standard error of the mean... 125 Figure 10. Ratio of gross nitrification to gross N mineralization associated with soil
aggregates of three tillage systems. Symbols represent mean values of four
replicates and error bars represent standard error of the mean. ... 126 Figure 11a. Nonmetric Multidimensional Scaling (NMS) ordination plot of mol % of
PLFAs (Before 15N Injection) of the soil aggregate size fractions and whole soil
of the three different tillage systems. The percentage of variation explained by each axes is based on the correlation between distance in the reduced NMS ordination space and distance in the original space and is given in the parentheses. ... 127 Figure 11b. Association of individual Phospho Lipids Fatty Acids (Before 15N Injection)
with NMS axes. The percentage of variation explained by each axes is based on the correlation between distance in the reduced NMS space and distance in the original space and is given in the parentheses. The Pearson and Kendall
correlation between PLFAs and NMS axes are given in the Appendix 4. ... 128 Figure 12a. Nonmetric Multidimensional Scaling (NMS) ordination plot of mol % of
PLFAs (After 15N Injection) of the soil aggregate size fractions and whole soil of the three different tillage systems. The percentage of variation explained by each axes is based on the correlation between distance in the reduced NMS ordination space and distance in the original space and is given in the parentheses. ... 129 Figure 12b. Association of individual Phospho Lipids Fatty Acids (After 15N Injection)
original space and is given in the parentheses. The Pearson and Kendall
correlation between PLFAs and NMS axes are given in the Appendix 5. ... 130 Figure 13. Change in the relative abundance of specific biomarkers after the addition of
CHAPTER 1 LITERATURE REVIEW Soil aggregate hierarchy
Primary soil particles such as sand, silt, and clay interact to form floccules due to the weak Van der Waals force. Emerson (1959) termed these floccules as domains, which were glued by soil organic matter to form aggregates. Edwards and Bremner (1967) suggested that the interaction of clay and organic matter through polyvalent cations such as iron, calcium, and aluminum might contribute to the formation of soil aggregates. Later, Tisdall and Oades (1982) proposed a hierarchical model for aggregate formation, indicating that aggregates were made of floccules via three types of cementing agents. Persistent agents, including humified organic matter and polyvalent cations, interact and cement the primary soil particles and floccules (< 20 m) to form microaggregates (20-250 m). Temporary cementing agents, such as fungal hyphae, fine plant roots, and transient agents such as polysaccharides derived from plants and soil microbes, glue the microaggregates into macroaggregates (> 250 m). Furthermore, Oades (1984)
postulated that microaggregates were occluded within macroaggregates. However, Oades and Waters (1991) indicated that the aggregate hierarchical model is applicable only when organic matter is the dominant binding agent between soil particles.
Increase in tillage intensity may decrease organic matter and thus change the interaction between soil organic matter and aggregate turnover (Six et al., 1999). Six et al. (1998) proposed a conceptual model to explain the interaction between tillage and soil organic matter. Incorporation of fresh plant residues stimulates microbial activity, resulting in the production of extracellular polysaccharides. This cementing agent, together with fungal hyphae and fine plant roots, may bind coarse iPOM (intra Particulate Organic Matter) with some soil particles and microaggregates leading to the formation of
macroaggregates. The coarse iPOM (i.e., iPOM, > 250 µm) will decompose gradually within macroaggregates, resulting in the production of fine iPOM (250 µm). The fine iPOM encrusted on soil mineral particles were stabilized to form microaggregates within macroaggregates. Turnover rate of macroaggregates in no- till is slower than in tilled soils facilitating the stabilization of coarse iPOM into fine iPOM (Six et al., 2004). Consequently, the fine iPOM level was significantly greater in no-till macroaggregates compared to macroaggregates from tilled systems (Six et al., 1999, 2000a, 2000b, 2001, 2004). The increase in soil organic matter in no-till compared to tilled systems together with more heterogeneous soil physical environment may generate variation in soil microbial community composition and nitrogen cycle processes.
Aggregate-associated soil heterogeneity
Soil C and N contents, water potential, and aerobic conditions that limit microbial biomass and activities are heterogeneously allocated within the soil profile. Their
essential for storing air and water, nutrients and organic matter. Lebron et al. (2002) showed that the soil pore size is positively correlated with the soil aggregate size.
Elliott and Coleman (1988) defined four categories of pores: (i) macropores created by earthworms (ii) intermacroaggregate pores formed by roots or worms (iii) intermicroaggregate or intramacroaggregate pores associated with macroaggregates (iv) intramicroaggregate pores associated with microaggregates. Macroaggregates are associated with large pores of diameter greater than 25 µm and microaggregates with small pores of diameter 0.2-6 µm. Water is tightly held in the small pores rather than in the large pores (Vargas and Hattori, 1986). Most of the bacteria require water to remain active; therefore, bacteria tend to associate with small pores (Postma et al., 1990).
Besides their influence on soil physical and chemical properties, soil pore sizes, in particular the pore neck sizes, can also directly affect the distribution of soil microbes (Elliott and Coleman, 1988). Generally, bacteria occupy pores of less than 3 m but fungi inhabit pores greater than 5 m (Hassink et al., 1993; Kilbertus, 1980). Applicable to soil aggregates, bacteria are preferentially associated with microaggregates, whereas fungal hyphae are abundant in macroaggregates (Tisdall and Oades, 1982). Thus, a heterogeneous soil physical environment that results from aggregate-associated pore sizes is also responsible for variable microbial distributions among soil aggregates.
Macroaggregates are composed of microaggregates and organic binding agents, which are responsible for their formation and stabilization. In general, macroaggregates contain greater amount of organic C and N than microaggregates (Tisdall and Oades, 1982; Elliott, 1986; Angers et al., 1997). Six et al. (2000b) found that C content of
greater than that of microaggregates. In addition, the quality of soil organic matter varies with soil aggregate size. For example, macroaggregates are associated with more labile organic matter than microaggregates (Elliot, 1986; Gupta and Germida, 1988). The proportion of recently incorporated young organic C is greater in macroaggregates than in microaggregates (Puget et al., 1995). Tillage strongly influences the amount and type of particulate organic matter (i.e. partially decomposed organic matter) distribution among soil aggregates. Six et al. (1998) suggested that there are three fractions of particulate organic matter. Free light fraction (POM occurring between aggregates) is the labile fraction that is sensitive to cultivation. The intra-aggregate particulate organic matter (iPOM, 250 – 2000 µm) is the slowly decomposable fraction and involved in the stabilization of macroaggregates. Fine iPOM (53-250 µm) is the recalcitrant fraction of organic matter and mainly responsible for the formation of microaggregates within macroaggregates. Spatial isolation of substrates with varying degradability among
aggregate size fractions contributes to the heterogeneous microbial distribution (Six et al., 1998, 2000a) and activity.
Aggregate-associated soil microbial community and N cycling
further regulated by pore size distribution and aggregate dynamics. Microbes are believed to inhabit aggregate-associated pores and on the surface of soil aggregate (Hattori, 1988).
Soil moisture directly influences the activity of soil microbes, but also indirectly regulates microbial activity through controls on O2 diffusion. The diffusion of O2 in
water-filled aggregates is 10,000 times slower than in pores filled with gas (Greenwood, 1961). In addition, the geometry of aggregate-associated pores and tortuosity of the pore network govern the O2 diffusion. Often, O2 concentration in the center of aggregates is
very low so that there exists an anaerobic zone. Sexstone et al. (1985, 1988) observed that denitrification occurred in the anaerobic zone of aggregates. Nitrification ceases, as the interior of larger aggregates become anaerobic due to decreased rate of oxygen diffusion (Greenwood, 1962; Seifert, 1963, 1964).
Aggregate-associated variability in soil moisture and uneven distribution of organic matter in terms of both quantity (Jocteur-Monrozier et al 1991, Kanazawa and Filip, 1986) and quality may result in the heterogeneous distribution of microbial biomass and their activities across aggregates of different sizes. Several studies have shown that microbial biomass is greater in macroaggregates than in microaggregates (Gupta and Germida, 1988; Miller and Dick, 1995; Franzluebbers and Arshad, 1997), whereas others have reported that microaggregates show higher levels of microbial activities and
biomass (Seech and Beauchamp, 1988; Jastrow et al., 1996; Ashman et al., 2003). There is little information on aggregate-associated microbial community
using direct (acridine orange) and indirect (plate counting) enumeration methods. Fungal hyphal length observed under epifluorescence microscope was longer in macroaggregates than in microaggregates; representing fungal dominance in macroaggregates
(Guggenberger et al., 1999). This observation was confirmed later with the aid of
biochemical and molecular level techniques. The fatty acid, 18: 2 6c that represents soil fungi was abundant in macroaggregates than in microaggregates (Shutters and Dick, 2002). The uneven distribution of soil microbes across soil aggregates hold true for other functional microbial groups. For example, terminal restriction fragment length
polymorphism (TRFLP) showed that a member of methanosarcinae inhabited soil aggregates of different sizes dissimilarly (Ramakrishnan et al., 2000). Vaisanen et al. (2005) observed variation in the composition of bacterial and fungal communities because of mineral N addition but not in their function. Examinations on microbial community function (i.e., sole carbon source utilization, also termed as microbial
community-level physiology profile (CLPP)) provided contradictory results. While some demonstrated that substrate utilization varied with aggregate sizes, others did not
(Winding, 1994; Lupwayi et al., 2001; Schutter and Dick, 2002). This discrepancy indicates that the changes in microbial community composition do not necessarily manifest on microbial function.
Soil microbial communities and nitrogen cycling in different tillage systems
the surface (Mielke et al., 1986). The heterogeneous soil environment resulting from tillage practices influence microbial populations and N cycling activity (Linn and Doran, 1984). Microbial biomass and potentially mineralizable nitrogen levels were 54% and 37% greater in no-till than in plowed soils (Doran, 1987). In early years of conversion from a conventional to no-tillage system, increased immobilization of ammonium and nitrate by microbes may temporarily reduce plant available N, but as a long-term benefit no-till increases soil N retention capacity. Nevertheless, in long-term no-till systems when organic matter levels reach equilibrium, N availability to plants increases because of rapid microbial turnover. Tillage promotes microbial activity therefore rapid
decomposition and accelerated cycling of soil N leads to more leaching and
denitrification losses than in no-till soils (Carter and Rennie, 1982; Aulak et al., 1984). Thus, interaction between soil organic matter and microorganisms varies with tillage and also influences nitrogen availability and soil N retention. However, better understanding of the distribution of microorganisms and their activities related to N cycling in response to tillage-related changes in their habitats is necessary to develop efficient and productive management decisions.
addition, amino sugars associated with fungi were significantly greater in no-till macroaggregates (Simpson et al., 2004; Guggenberger et al., 1999). Fungi play a
significant role in aggregate formation and stabilization (Bossuyt et al., 2001; Gupta and Germida, 1988; Tisdall, 1994; Tisdall and Oades, 1982). Cosentino et al. (2006)
observed greater correlation of fungal biomass with aggregate stability than with total microbial biomass.
cellobiohydrolase and N-Acetyl-Glucosaminidase activities were enhanced in particulate organic matter fractions than in bulk soil.
Spatial distribution of water and oxygen, combined with quantity and quality of organic matter, drives the N transformation process at the aggregate level. Compton and Boone (2002) demonstrated that quantity and quality of light fraction organic matter influences N immobilization. Mendes et al. (1999) found that readily mineralizable N increases with aggregate sizes and denitrification rate varied among the aggregate size fractions (Seech and Beauchamp, 1988). Although recent research explains the process of aggregate formation and stabilization and the role of soil aggregates in carbon
sequestration, much less is known about soil aggregate-associated N cycling activities. We believe that tillage induced changes might be reflected in the soil aggregates. Studying the heterogeneous distribution of soil microorganisms involved in N
transformation processes and microbial activity associated with microbial habitats may allow us to better understand the N cycling processes.
References
Acosta-Martinez, V., Tabatabai, M.A., 2001. Tillage and residue management effects on arylamidase activity in soils. Biology and Fertility of Soils 34, 21-24.
Allison, S.D., Jastrow, J.D., 2006. Activities of extracellular enzymes in physically isolated fractions of restored grassland soils. Soil Biology and Biochemistry 38, 3245-3256.
Angers, D.A., Recous, S., Aita, C., 1997. Fate of carbon and nitrogen in water-stable aggregates during decomposition of 13C and 15N labeled wheat straw in situ. European Journal of Soil Science 48, 295–300.
Ashman, M.R., Hallett, P.D., Brookes, P.C., 2003. Are the links between soil aggregate size class, soil organic matter and respiration rate are artifacts of the fractionation procedure? Soil Biology and Biochemistry 35, 435-444.
Bailey, V.L., Smith, J.L., Bolton, H., 2002. Fungal-to-bacterial ratios in soils investigated for enhanced C sequestration. Soil Biology and Biochemistry 34, 997–1007. Beare, M.H., Hu, S., Coleman, D.C., Hendrix, P.F., 1997. Influence of mycelial fungi on
soil aggregation and organic matter storage in conventional and no tillage soils. Applied Soil Ecology 5, 211-219.
Beauchamp, E.G., Seech, A.G., 1990. Denitrification with different sizes of soil
aggregates obtained from dry sieving and from sieving with water. Biology and Fertility of Soils 10, 188-193.
Bossuyt, H., Denef, K., Six, J., Frey, S.D., Merckx, R., Paustian, K., 2001. Influence of microbial populations and residue quality on aggregate stability. Applied Soil Ecology 16, 195-208.
Buckley, D.H., Schmidt, T.M., 2003. Diversity and dynamics of microbial communities in soils from agro-ecosystems. Environmental Microbiology 5, 441–452.
Burns, R.G., 1982. Enzyme activity in soil: location and a possible role in microbial activity. Soil Biology and Biochemistry 14, 423–427.
Compton, J.E., Boone, R.D., 2002. Soil nitrogen transformations and the role of light fraction organic matter in forest soils. Soil Biology and Biochemistry 34, 933-943
Deng, S.P., Tabatabai, M.A., 1996. Effect of tillage and residue management on enzyme activities in soils .1. Amidohydrolases. Biology and Fertility of Soils 22, 202-207. Dick, W.A., 1984. Influence of long-term tillage and crop rotation combinations on soil
enzyme activities. Soil Science Society of America Journal 48, 569-574.
Dick, W.A., Tabatabai, M.A., 1993. Significance and potential uses of soil enzymes. In: Meeting FB Jr(Ed) Soil microbial ecology: application in agriculture and
environmental management. Dekker, New York, pp 95-127.
Doran, J.W., 1980. Soil microbial and biochemical changes associated with reduced tillage. Soil Science Society of America Journal 44, 765–771.
Edwards, A.P., Bremner, J. M., 1967. Microaggregates in soils. Journal of Soil Science 18, 64–73.
Ekenler, M., Tabatabai, M.A., 2004. -glucosaminidase activity as an index of nitrogen mineralization in soils. Communications in Soil Science and Plant Analysis 35, 1081-1094.
Elliott, E.T., 1986. Aggregate structure and carbon, nitrogen and phosphorus in native and cultivated soils. Soil Science Society of America Journal 50, 627-633.
Elliott, E.T., Coleman, D.C., 1988. Let the soil work for us. Ecological bulletin 39, 23-32. Emerson, W.W., 1959. Stability of soil crumbs. Nature 183, 538.
Fansler, S.J., Smith, J.L., Bolton, H., 2005. Distribution of two C cycle in soil aggregates of a prairie chronosequence. Biology and Fertility of Soils 42, 17-23.
Franzluebbers, A.J., Arshad, M.A., 1997. Soil microbial biomass and mineralizable carbon of water stable aggregates. Soil Science Society of America Journal 61, 1090-1097.
Fraterrigo, J.M., Balser, T.C., Turner, M.G., 2006. Microbial community variation and its relationship with nitrogen mineralization in historically altered forests. Ecology 87, 570-579.
Frey, S.D., Elliott, E.T., Paustian, K., 1999. Bacterial and fungal abundance and biomass in conventional and no-tillage agro ecosystems along two climatic gradients. Soil Biology and Biochemistry 31, 573-585.
Greenwood, D.J., 1961. The effect of oxygen concentration on the decomposition of organic materials in soil. Plant and Soil 14, 360-364.
Greenwood, D.J., 1962. Nitrification and nitrate dissimilation in soil. Plant and Soil 17, 365-368.
Guggenberger, G., Frey, S.D., Six, J., Paustian, K., Elliott, E.T., 1999. Bacterial and fungal cell wall residues in conventional and no-tillage agro ecosystems. Soil Science Society of America Journal 63, 1188-1198.
Gupta, V.V.S.R., Germida, J.J., 1988. Distribution of microbial biomass and its activity in different soil aggregate size classes as affected by cultivation. Soil Biology and Biochemistry 20, 777-786.
Hassink, J., Bouman, L.A., Zwart, K.B., 1993. Relationships between habitable pore-space, soil biota and mineralization rates in grassland soils. Soil Biology and Biochemistry 25, 47-55.
Hattori, T., 1988. Soil aggregates as microhabitats of microorganisms. Report of the Institute of Agricultural Research Tohoku University 37, 23–36.
Jastrow, J.D., Button, T.W., Miller, R.W., 1996. Carbon dynamics of aggregate associated organic matter estimated by 13 C natural abundance. Soil Science Society of America Journal 60, 801-807.
Jocteur-Monrozier, L.J., Ladd, J.N., Fitzpatrick, R.W., Foster, R.C., Raupach, M., 1991. Components and microbial biomass content of size fractions in soils of
contrasting aggregation. Geoderma 50, 37–62.
Kanazawa, S., Filip, Z., 1986. Distribution of microorganisms, total biomass, and
enzyme-activities in different particles of brown soil. Microbial Ecology 12, 205– 215.
Kilbertus., 1980. Etude des microhabitats contenus dans les agregats du sol. Leur relation avec la biomasse bacterienne et la taille des procaryotes presents. Revue d'Écologie et de Biologie du Sol 17, 543–557.
Lebron, I., Suarez, D.L., Schaap, M.G., 2002. Soil pore size and geometry as a result of aggregate size distribution and chemical composition. Soil Science 167,165-172. Lupwayi, N.Z., Arshad, M.A., Rice, W.A., 2001.Bacterial diversity in water-stable
aggregates of soils under conventional and zero tillage management. Applied Soil Ecology 16, 251-261.
Oades, J.M., 1984. Soil organic-matter and structural stability - mechanisms and implications for management. Plant and Soil 76, 319-337.
Oades, J.M., Waters, A.G., 1991. Aggregate hierarchy in soils. Australian Journal of Soil Research 29, 815–828.
Parkin, T.B., 1987. Soil micro sites as a source of denitrification variability. Soil Science Society of America Journal 51, 1194-1199.
Postma, J., Vanveen, J.A., 1990. Habitable pore-space and survival of Rhizobium leguminosarum biovar trifolii introduced into soil. Microbial Ecology 19, 149-161.
Puget, P., Angers, D.A., Chenu, C., 1999. Nature of carbohydrates associated with water-stable aggregates of two cultivated soils. Soil Biology and Biochemistry 31, 55– 63.
Ramakrishnan, B., Leuders, T., Conrad, R., Friedrich, M., 2000. Effect of soil aggregate size on methanogenesis and archael community structure in anoxic rice field soil. FEMS Microbiology Ecology 32, 261-270.
Richaume, A., Steinberg, C., Jocteurmonrozier, L., Faurie, G., 1993. Differences between direct and indirect enumeration of soil bacteria—the influence of soil–structure and cell location. Soil Biology and Biochemistry 25, 641–643.
Schutter, M.E., Dick, R.P., 2002. Microbial community profiles and activities among aggregates of winter fallow and cover-cropped soil. Soil Science Society of America Journal 66, 142-153.
Seech, A., Beauchamp, E.G., 1988. Denitrification in soil aggregates of different sizes. Soil Science Society of America Journal 52, 1616-1621.
Seifert, J., 1964a. Effect of size of soil structural aggregates on the degree of nitrification. Folia Microbiologica 9, 347-350.
Seifert, J., 1964b. Influence of size of soil structural aggregates on the degree of nitrification. Folia Microbiologica 9, 115-119.
Sexstone, A.J., Parkin, T.B., Tiedje, J.M., 1988. Denitrification response to soil wetting in aggregated and unaggregated soil. Soil Biology and Biochemistry 20, 767-769. Sexstone, A.J., Revsbech, N.P., Parkin, T.B., Tiedje, J.M., 1985. Direct measurement of
Simpson, R.T., Frey, S.D., Six, J., Thiet, R.K., 2004. Preferential accumulation of microbial carbon in aggregate structures of no tillage soils. Soil Science Society of America Journal 68, 1249–1255.
Six, J., Bossuyt, H., Degryze, S., 2004. A history of research on the link between (micro) aggregates, soil biota, and soil organic matter dynamics. Soil and Tillage
Research 79, 7-31.
Six, J., Conant, R.T., Paul, E.A., 2002. Stabilization mechanisms of soil organic matter: Implications for C-saturation of soils. Plant and Soil 241, 155-176.
Six, J., Elliott, E.T., Paustian, K., 2000a. Soil macroaggregates turnover and
microaggregate formation: A mechanism for C sequestration under no-tillage agriculture. Soil Biology and Biochemistry 32, 2099–2103.
Six, J., Elliott, E.T., Paustian, K., Doran, J.W., 1998. Aggregation and soil organic matter accumulation in cultivated and native grassland soils. Soil Science Society of America Journal 62, 1367–1377.
Six, J., Elliott, E.T., Paustian, K., 2000b. Soil macro aggregate turnover and micro aggregate formation: a mechanism for C sequestration under no-tillage agriculture. Soil Biology and Biochemistry 32, 2099-2103.
Six J, Elliott, E.T., Paustian, K., 1999. Aggregate and soil organic matter dynamics under conventional and no-tillage systems. Soil Science Society of America Journal 63, 1350-1358.
Six, J., Guggenberger, G., Paustian, K., Haumaier, L., Elliott, E.T., Zech, W., 2001. Sources and composition of soil organic matter fractions between and within aggregates. European Journal of Soil Science 52, 607–618.
Six, J., Paustian, K., Elliott, E.T., Combrink, C., 2000c. Soil structure and soil organic matter: I. Distribution of aggregate size classes and aggregate associated carbon. Soil Science Society of America Journal 64, 681–689.
Sollins, P., Homann, P., Caldwell, B.A., 1996. Stabilization and destabilization of soil organic matter: mechanisms and controls. Geoderma 74, 65–105.
Tisdall, J.M., Oades, J.M., 1982. Organic-matter and water-stable aggregates in soils. Journal of Soil Science 33, 141-163.
Vaisanen, R.K., Roberts, M.S., Garland, J.L., Frey, S.D., Dawson, L.A., 2005.
Vargas, R., Hattori, T., 1986. Protozoan predation of bacterial cells in soil aggregates. FEMS Microbiology Ecology 38, 233–242.
Winding, A., Binnerup, S.J., Sorensen, J., 1994. Viability of indigenous soil bacteria assayed by respiratory activity and growth. Applied and Environmental Microbiology 60, 2869-2875.
Wright, S.F., Anderson, R.L., 2000. Aggregate stability and glomalin in alternative crop rotations for the central Great Plains. Biology and Fertility of Soils 31, 249-253. Young, I.M., Crawford, J.W., 2004.Interactions and self-organization in the soil-microbe
CHAPTER 2
RELATIVE DISTRIBUTION OF AGGREGATE–ASSOCIATED N MINERALIZERS, NITRIFIERS AND DENITRIFIERS IN THREE
DIFFERENT TILLAGE SYSTEMS. Abstract
Microbial transformations occurring near the soil surface of agro-ecosystems determine plant available N and N losses via leaching and gaseous emissions. Since aggregates provide diverse microbial habitat, we tested the hypothesis that the relative distribution and activity of N mineralizers, nitrifiers, and denitrifiers varies in aggregate size fractions obtained from soils subjected to long-term (22 yr) no-till (NT), chisel
tillage (CT) and moldboard tillage (MT) systems. Potential N mineralization, nitrification, denitrification rates, total soil and microbial biomass C and N were determined for five aggregate sizes (<0.25, 0.25-0.5, 0.5-1, 1-2, and 2-4 mm). Soil and microbial biomass C and N were generally greater in NT than CT and MT. Though potential N mineralization, nitrification and denitrification rates varied with aggregate size within a tillage system, the differences were inconsistent. The ratio of nitrifiers to N mineralizers was relatively lower (28-35%) in 0.5-1 mm and 0.25-0.5 mm aggregates, when compared to other size fractions. In general, tillage effect on soil and microbial biomass C and N, potential N mineralization and nitrification were greater compared to aggregate size effect. However, further research using 15N pool dilution techniques should be employed to better
Introduction
Electron microscopic studies have shown the uneven distribution of soil microorganisms at micro-scale level. (Foster, 1988; Kilbertus, 1980). Pores that
determine the availability of oxygen, water, and nutrients for microorganisms (Ladd et al., 2003) were also unequally distributed within and between soil aggregates that are
hypothesized as microbial habitats (Hattori, 1988). Since soil microbial distribution and activity are largely modified by the physicochemical conditions of their habitats,
characterization of microbial activity associated with soil aggregates is crucial for better understanding of the microbial processes in soil.
Soil organic matter and microorganisms are responsible for the formation and stabilization of soil aggregates. However, increased tillage intensity disrupts soil
aggregates and releases physically protected organic carbon, which results in more rapid aggregate turnover in long-term conventionally tilled systems than in no-till systems (Six et al., 1999). Slower aggregate turnover rate combined with greater organic matter content could account for increased microbial activity and soil N retention (Dick, 1983; Doran, 1980; Rice et al., 1986; Alvarez et al., 1998; Beare et al., 1997) in no-till systems when compared with tilled soils.
in greater microbial biomass in macroaggregates than in microaggregates (Gupta and Germida, 1988; Miller and Dick, 1995; Franzluebbers and Arshad, 1997). Other researchers have reported that microaggregates were characterized with higher levels of microbial activities and biomass than macroaggregates (Seech and Beauchamp, 1988; Jastrow et al., 1996; Ashman et al., 2003). These contradictions may be attributed to the different fractionation methods employed to obtain soil aggregate size fractions.
The fatty acid 18: 2 6c that represents soil fungi was copious in
macroaggregates but not in microaggregates (Schutter and Dick, 2002). The uneven distribution of soil microbes across soil aggregate size fractions holds true for other functional microbial groups. For example, terminal restriction fragment length
polymorphism (TRFLP) showed that some of the methanogenic bacterial ribotypes were a slightly greater in macroaggregates than in microaggregates (Ramakrishnan et al., 2000). Furthermore, Mendes and Bottomley (1998) have noticed dissimilar distribution of Rhizobium leguminosarum biovar trifolii populations across different aggregate size fractions. Yet, N cycling activities of microorganisms associated with soil aggregates have received little attention.
Nitrogen transformation processes are principally controlled by the population dynamics of the microbial functional groups such as N mineralizers, nitrifiers and denitrifers. A better understanding of the relative distribution and activity of these microbes is essential, since their activity influences the N availability to plants as well as N losses through leaching or gaseous emissions. Population size of aggregate-associated N mineralizers, nitrifiers and denitrifiers can be estimated via potential rates of N
transformation processes at the soil aggregate level and also to evaluate the impact of tillage systems on these processes. Accordingly, the objective of this study was to determine the relative distribution of aggregate associated microbial functional groups such as N mineralizers, nitrifiers and denitrifiers in three different long-term tillage systems.
Materials and methods Site description
Surface (0-10 cm) soil samples were collected with a shovel from a long-term (22 yr) tillage experiment at the Upper Piedmont Research Station, Reidsville, North
Carolina. The soil is a wedowee sandy clay loam (25% silt, 27% clay and 48% sand) and classified as clayey, kaolinitic, thermic typic Hapludult. The experimental plots were established in 1984 with nine tillage treatments that were arranged as a randomized complete block design with four replications.
Sampling and aggregate separation
Soil samples were collected from the surface 0-10 cm depth, stored in freezer chests containing ice, and transported to the laboratory. The following day, large soil clods were gently crushed by hand and dried at 4 ºC in refrigerators to attain 8-10% soil water content. A preliminary study showed that soil samples need to be dried at 4 ºC for approximately 4-7 days to reach 8-10% soil water content, depending on their initial soil moisture content. This soil water content is found to be suitable for dry sieving the soil samples. Aggregates of different sizes were separated by placing 400 g cold dried soils (8-10% moisture content) on a series of nested sieves that were mounted on a Tyler Ro-Tap sieve shaker. The shaker was vibrated for 3 min at the speed of 200-250
oscillations per min. Five aggregate size fractions (i.e. 2-4 mm, 1-2 mm, 0.5-1 mm, 0.25-0.5 mm and < 0.25 mm) that include macro, intermediate and microaggregate fractions were fractionated from whole soil of all three tillage systems.
Soil physical and chemical analyses
Particle-size analyses were conducted on five aggregate-sizeclasses and whole soil samples using the hydrometermethod. All samples were analyzed withoutany pretreatment for the removal of organic matter, since the total organic carbon level is not elevated in all three tillage systems.Oven dried whole soil and aggregate samples were ground with a pestle andmortar before analysis. Total C and N were determinedby direct combustion method using a Perkin–Elmer 2400 CHN analyzer. Inorganic N (NH4+ and
NO3- N) of whole soil and aggregate samples was extracted with 1M KCl and quantified
Biomass C and N
Soil microbial biomass C and N were determined by the chloroform fumigation extraction method (Brookes et al., 1985 and Vance et al., 1987). Fifteen grams of both the whole soil and aggregate size fractions were fumigated with ethanol-free chloroform for 24 hrs. Subsequently, both the fumigated and non-fumigated soils were extracted with 50 mL of 0.5 M K2SO4 and samples were shaken for 60 min on a rotary shaker and
filtered through Whatman No.1 filter paper. Then, the filtered extracts were stored at 4°C (freezer) for further analysis of extractable C and N. Organic C in fumigated and
unfumigated filtrated extracts was measured using a total organic C analyzer (TOC-5000 Shimadzu). Extractable nitrogen in fumigated and unfumigated filtered samples was measured using alkaline persulfate oxidation method (Cabrera and Beare, 1993). Soil microbial biomass C and N were calculated by dividing the difference of total extractable C (or N) between fumigated and unfumigated samples with the conversion factors of 0.45 for biomass C and 0.54 for biomass N (Brookes et al., 1985 and Vance et al., 1987). Basal respiration
Basal respiration (BR) of whole soil and aggregate samples were assessed by measuring CO2 evolution. Field moist soil aggregate (15 g) samples were placed in
125 ml Erlenmeyer flasks and 30 ml (2:1 ratio) of water was added. Flasks were capped with rubber septa and incubated for 24 hr in the rotary shaker to facilitate diffusion of gas in aggregate samples. After 1, 16 and 24 hr, total CO2 released from the soil samples was
calibration graph prepared with known quantities of CO2. The results were expressed as
g CO2 g−1 dry soil hr−1 by taking headspace volume into account. Active population size of N mineralizers, nitrifiers and denitrifiers
Potential rate measurements assayed in short term incubations can also be used to estimate population size of soil microbial functional groups (Belser, 1979) since
substrate ,moisture and temperature limitations are eliminated in these methods. Moreover, changes in microbial populations are unusual in this short-term assay.
The population size of N mineralizers was estimated via measuring potential N mineralization by anaerobic incubation method (Bundy and Meisinger, 1994; Keeney, 1982). Fifteen grams of soil aggregate samples were incubated at 40oC under anaerobic conditions for seven days. Mineralization potential measured by this method presumably represents the population size of N mineralizers, as the optimum moisture and
temperature conditions required for microbial growth and activity was provided. Similarly, population size of nitrifiers was determined by measuring potential nitrification rate using shaken soil slurry method (Hart et al., 1994). Fifteen gram of soil aggregate samples were placed in 250 ml Erlenmeyer flasks and 100 ml of a nutrient solution containing 1.5 mM ammonium and 1 mM phosphate was added so that substrate limitations were removed during incubation. Samples were incubated on an orbital shaker at 180 rpm for 24 hr at 25 °C and aeration was provided for the growth of obligate
aerobic nitrifiers through the small holes in the stopper of the flask. Nitrate formed over period of 24 hr of incubation was determined colorimetrically using a Lachat analyzer.
30 ml (1:2) of nutrient solution containing 1 mM glucose and 1 mM nitrate was added and sealed with a rubber septum. Each flask was evacuated and flushed with nitrogen gas 4-5 times and 20 ml of acetylene gas was injected in to the flask to prevent reduction of N2O to N2 . Flasks were then incubated on a rotary shaker (about 100-200 rpm) for 60
minutes and gas samples from the headspace were taken with an airtight syringe for every 30 minutes. The gas samples were analyzed on a Hewlett-Packard5730A Gas
Chromatograph equipped with ECD detector for N2O concentration determination. The
rate of N2O production was calculated and expressed in g N2O-N g−1dry soil hr−1 using
the calibration curve developed with different known N2O gas standards. Adjustments
were made for soluble N2O in the bottles using a Bunsen absorption coefficient of 0.54 at
25 °C.
Statistical analyses
Data were analyzed using SAS statistical package (SAS Inst., Cary, NC).
The experiment was modeled as split plot design, with tillage systems as main plot effect and aggregate size as sub plot. Analysis of variance was conducted with SAS GLM (General Linear Model) procedure. Sources of variation included are tillage systems, aggregate size and their interactions. Main effect means were separated using LSD at P < 0.05 significance level.
Results
Whole soil results
Whole soil physicochemical properties
hydrometer method revealed that the sand, silt, and clay content varied significantly among the three tillage systems. No-till system was characterized by higher sand content (55%) whereas continuous long-term (22 years) moldboard tillage (Table1) had higher clay content (24%) compared with other tillage systems.
Total C and N and also inorganic nitrogen (sum of NH4-N and NO3-N)
concentration of whole soil samples varied significantly (p < 0.01) among the three tillage systems. Total carbon and nitrogen content (Table1) of the no-till system (12.2 g C kg -1 aggre and 1.1 g N kg -1 aggre, respectively) was two times higher than the mold board system (5.5 g C kg -1 aggre and 0.5 g N kg -1 aggre respectively). However, both the carbon and nitrogen content of the chisel tillage (8.4 g C kg -1 aggre and 0.7 g N kg -1 aggre) was intermediate between no-till and moldboard systems. The same trend
followed with inorganic nitrogen content being greater in no-till soils (Table1) than in the tilled soils.
Whole soil microbiological properties
Whole soil microbial biomass C and N from no-till (240.5 g C kg -1 soil and 29.0
mg N kg -1 soil) was significantly different from the moldboard soils. However, the soil microbial biomass C and N did not vary significantly (Table 1) between no-till and chisel tillage systems. Basal respiration rate measured on whole soil samples showed that
Soil aggregates results Total carbon and nitrogen
Total carbon and nitrogen and inorganic nitrogen (sum of soil NH4 and NO3)
levels (p <0.005) differed significantly with aggregate size and tillage system (Table 2). Additionally, the total carbon, nitrogen and inorganic nitrogen content of intermediate aggregate size fractions (0.5-1 mm) were consistently greater than the other aggregate sizes in all tillage systems. Regardless of the tillage system, total carbon, nitrogen and inorganic nitrogen (Table2) were found to be lower in <0.25 mm size class
(microaggregates) than the other size classes. No significant interaction effect was found between the tillage treatments and aggregate size fractions (Table 3).
Soil microbial biomass carbon and nitrogen
Soil microbial biomass carbon and nitrogen levels differed significantly (Fig 1) with aggregate size and tillage system. Soil microbial biomass carbon levels (Fig 1a.) were greater in macroaggregates (0.25-4 mm in diameter) than in microaggregates (<0.25 mm) of all three tillage systems. In contrast to total carbon, a significant (p <0.05)
microbial biomass nitrogen from chisel system did not significantly vary with aggregate size.
Basal respiration and metabolic quotient
Basal respiration rate measured on aggregate samples (range from 0.87-1.96 mg CO2 kg aggre -1 hr -1) differed significantly among tillage system and aggregate size, with
no significant interaction effects. Basal respiration rate was greater in no-till and chisel (Fig 2a.) when compared to moldboard systems. Though the basal respiration rates determined in no-till macroaggregate size fractions(0.25-4 mm) were significantly greater than in no-till microaggregates(<0.25 mm), there was no significant difference among aggregate sizes from tilled systems. Metabolic quotient (qCO2), calculated as amount of
CO2 –C released per unit of microbial biomass C (Fig 2b. and Table 3), did not
significantly vary among tillage systems and aggregate sizes. The metabolic quotient qCO2ranged between 1.57 to 2.14 mg CO2-C g−1 C mic hr −1 across tillage systems. Potential nitrification mineralization and denitrification
Potential nitrification rates varied significantly (p<0.001) with aggregate size but not with tillage systems (Table 4). Nitrification rate measured on aggregate size fractions of chisel tillage was significantly (p<0.05) greater (Fig 1b.) than the moldboard whereas no significant difference between chisel and no-till systems. In chisel and moldboard tillage systems, nitrification rate of the 1-2 mm size class was greater (Fig 3b.) than other aggregate size fractions. Potential nitrification rate did not differ significantly with aggregate size in the no-till system.
Potential denitrification rate varied significantly (p<0.001) with aggregate size and tillage system (Table 4). Potential denitrification rate measured in no-till and chisel system were significantly greater than the moldboard system. But, there was no
significant interaction effect between tillage and aggregate size fractions. Similar to potential N mineralization rate, the potential denitrification rate measured on the 0.5-1 mm intermediate size fraction was greater than other size fractions (Fig 3c). Relative rates of potential N mineralization, nitrification and denitrification
aggregate size fractions (0.5-1 and 0.25-0.5mm) than the other size fractions (Fig 4b.) of chisel and moldboard tillage systems.
Discussion
Aggregate size distribution determined by the dry sieving method has not identified any influence of tillage on aggregate size distribution. In moldboard tillage, whole soil and soil aggregate size fractions were characterized with greater clay content than other systems due to continuous inversion by moldboard plow for 23 years. Although the choice of methodology affects aggregate size distribution, the increased clay content on the surface of the moldboard system could have also increased the proportion of macroaggregates (Franzluebbers et al., 2000; Kemper et al., 1987) and resulted in suppressing the effect of tillage on aggregate size distribution. Gruver, 2007 (Dissertation in Prep.) have analyzed soil samples from the same experimental site using a wet sieving method and demonstrated tillage effects on aggregate size distribution. However, since our primary goal was to obtain soil aggregate size fractions that are closer to field conditions, we used fragmentation of moist soil by dry sieving method using Ro-Tap sieve shaker (Sainju et al., 2003; Sainju et al., 2006; Mendes et al., 1999; Schuter and Dick, 2002). Soil aggregate samples from all three tillage systems were comparable and can better illustrate the microbiological properties as they were fragmented by dry sieving at uniform oscillation speed.
Total C and N levels associated with soil aggregates were greater in the intermediate aggregate size (0.5-1 mm) fraction than in other size fractions which is similar to those observed by Mendes et al. (1999) and Schutter and Dick (2002). Similarly, greater inorganic N concentration in the 0.5-1 mm aggregate size indicates an elevated level of available N in the intermediate soil aggregates.
Doran (1987) has reported an average of 34 % more microbial biomass C in the surface 0-7.5 cm of no-till (4-11 yr) than in the moldboard systems. In our study, microbial biomass C averaged 42 % greater in the surface 10 cm of no-till system compared to moldboard system. Likewise, increased MBC and MBN associated with macroaggregates were comparable with the observations of Gupta and Germida (1988), Miller and Dick (1995), Mendes et al. (1999), and Schutter and Dick (2002). Increased substrate availability with higher levels of C and N might have resulted in greater microbial biomass and basal respiration in macroaggregates when compared to microaggregates. Additionally fungal populations that predominately reside in the macroaggregates (Elliott and Coleman, 1988) might have also been responsible for the increased biomass, as the fungi encompass a relatively larger proportion of microbial biomass (Beare et al., 1992; Holland and Coleman, 1987) than bacteria.
denitrifying activity (Rice and Smith, 1982) as compared to tilled soils. Correspondingly, the potential denitrification rates averaged 75 % greater in no-till soils than in moldboard systems.
Changes in the physico-chemical characteristics of microbial habitats also affect microbial activity with respect to N transformations. Mendes et al. (1999) found that readily mineralizable N levels increases with aggregate size in their legume cover cropped soils. Potential N mineralization, nitrification and denitrification rates
investigated in this long-term tillage soils were found to be higher in macroaggregates than in microaggregates.
Oxygen diffusion in soil aggregate size fractions might influence the nitrification processes (Seifert, 1964 a &b; Drazkiewicz, 1996). Accordingly, macroaggregates showed greater potential nitrification rates than the microaggregates. It was also postulated that nitrification is primarily controlled by the ammonium supplied by the mineralization process (Booth et al., 2005). Thus, increased potential mineralization rate in macroaggregates could have possibly raised the ammonium levels in macroaggregates as compared to microaggregates. However, since substrate and oxygen limitations were removed in the potential measurements, it can be concluded that the variability in potential nitrification rates were due to the distinct nitrifier population size associated with different aggregate size fractions.
Seech and Beauchamp (1988) found that denitrification potential of dry sieved soil aggregates decreased with increasing aggregate size; however addition of 200 µg glucose g -1 aggre diminished the aggregate size effect. But in our study, we observed
irrespective of the addition 2 µg glucose g aggre and nitrate. Thus it can be concluded that the significant effect on population size of denitrifiers associated with aggregate size fractions was observed in our study because of the addition of relatively smaller amount of glucose compared to Seech and Beauchamp (1988).
Pore space associated with soil aggregates influences the physicochemical characteristics such as water potential and oxygen availability which in turn affects the microbial distribution and activity (Ranjard and Richaume, 2001). But, in our study soil aggregates were crushed during the process of measuring potential rates and there were not any textural differences observed between the aggregate size fractions. Therefore, neither texture nor the aggregate structure could account for the variability in potential rates. Since potential measurements in our study were ascertained under optimum conditions for microbial growth and activity, the greater mineralization nitrification and denitrification rates in macroaggregates were due to the larger population size of the respective functional groups. Accordingly, all the potential rates were positively correlated with microbial biomass (Table 5). Thus , the variability of potential rates suggest that microbial communities involved in N cycling are heterogeneously distributed across aggregate size fractions. However further research is required to determine
whether aggregate size influences N availability. Isotope dilution techniques can be used to study whether the production and consumption of N pools is influenced by aggregate size.
ratios were significantly greater in the intermediate aggregate size fractions (0.25-1 mm). Changes in the potential rates are considered as good indicators of variable functional abilities of the microbial communities involved in nitrogen cycle (Belser, 1979). Accordingly, it can be interpreted that concurrent changes in potential mineralization, nitrification and denitrification rates observed in our study might have occurred due to the heterogeneous distribution of microbial communities associated with aggregate sizes. However, further research that involves investigation of inherent microbial communities associated with aggregate sizes is needed to confirm the above results.
References
Alvarez, R., Daniel, P.E., Richter, V., Blotta, L., 1998. Nitrogen distribution in soil density fractions and its relation to nitrogen mineralization under different tillage systems. Australian Journal of Soil Research 36, 247–256.
Beare, M.H., Hu, S., Coleman, D.C., Hendrix, P.F., 1997. Influence of mycelial fungi on soil aggregation and organic matter storage in conventional and no tillage soils. Applied Soil Ecology 5, 211-219.
Belser, L.W., 1979. Population ecology of nitrifying bacteria. Annual Review of Microbiology 33, 309-313.
Booth, M.S., Stark, J.M., Edward R., 2005. Controls on Nitrogen cycling in terrestrial ecosystems: a synthetic analysis of literature data. Ecological Monograph 75, 139-157.
Brookes, P.C., 1985. Chloroform fumigation and the release of soil nitrogen: a rapid direct extraction method to measure microbial biomass nitrogen in soil: the effect of fumigation time and temperature. Soil Biology and Biochemistry 17, 837-842. Bundy, L.G., Meisinger, J.J., 1994. Nitrogen availability indices. p. 951–984. In R.W.
Weaver et al. (ed.) Methods of soil analysis—Part 2: Microbiological and biochemical properties. SSSA Book Ser. 5. SSSA, Madison, WI.
Cabrera, M.L., Beare, M.H., 1993. Alkaline persulfate for determining total nitrogen in microbial biomass extracts. Soil Science Society of America Journal 57, 1007-1012.
Dick, W.A., 1984. Influence of long-term tillage and crop rotation combinations on soil enzyme activities. Soil Science Society of America Journal 48, 569-574.
Doran, J.W., 1980. Soil microbial and biochemical changes associated with reduced tillage. Soil Science Society of America Journal 44, 765-771.
Doran, J.W., 1987. Microbial biomass and mineralizable nitrogen distributions in no-tillage and plowed soils. Biology and Fertility of Soils 5, 68–75.
Drazkiewicz, M., 1996. Is nitrification affected by the diameter and other properties of soil aggregates? Folia Microbiologica 41, 76-80.
Elliott, E.T., 1986. Aggregate structure and carbon, nitrogen and phosphorus in native and cultivated Soils. Soil Science Society of America Journal 50, 627-633.
Franzluebbers, A.J., Arshad, M.A., 1997. Soil microbial biomass and mineralizable carbon of water stable aggregates. Soil Science Society of America Journal 61, 1090-1097.
Franzluebbers, A.J., Wright, S.F., Stuedemann, J.A., 2000. Soil aggregation and glomalin under pastures in the southern piedmont USA. Soil Science Society of America Journal 64, 1018-1026.
Frey, S.D., Elliott, E.T., Paustian, K., 1999. Bacterial and Fungal abundance and biomass in conventional and no-tillage agro ecosystems along two climatic gradients. Soil Biology and Biochemistry 31, 573-585.
Gupta, V.V.S.R., Germida, J.J., 1988. Distribution of microbial biomass and its activity in different soil aggregate size classes as affected by cultivation. Soil Biology and Biochemistry 20, 777-786.
Hart, S.C., J.M. Stark, E.A. Davidson, Firestone, M.K. 1994. Nitrogen mineralization, immobilization, and nitrification. p. 985–1018. In R.W. Weaver et al. (ed.) Methods of soil analysis—Part 2: Microbiological and biochemical properties. SSSA Book Series. 5. SSSA, Madison, WI.
Hattori, T., 1988. Soil aggregates as microhabitats of microorganisms. Report of the Institute of Agricultural Research Tohoku University 37, 23-36.
Jastrow, J.D., Button, T.W., Miller, R.W., 1996. Carbon dynamics of aggregate associated organic matter estimated by 13 C natural abundance. Soil Science
Society of America Journal 60, 801-807.
Kemper, W.D., Rosenau, R.C., Dexter, A.R., 1987. Cohesion development in disrupted soils as affected by clay and organic matter content and temperature. Soil Science Society of America Journal 51, 860-867.
Kemper, W.D., Rosenau, R.C., 1986. Aggregate stability and size distribution. p 425-442 In Klute, A., (ed.) Methods of Soil Analysis- Part I. ASA-SSSA, Agronomy Mononograph, Madison, WI.
Kilbertus, 1980. Etude des microhabitats contenus dans les agregats du sol. Leur relation avec la biomasse bacterienne et la taille des procaryotes presents. Revue
d'Écologie et de Biologie du Sol 17, 543-557.
Linn, D.M., Doran, J.W., 1984. Aerobic and anaerobic microbial populations in no-till and ploughed soils. Soil Science Society of America Journal 48, 794–799. Mendes, I.C., Bandick, A.K., Dick, R.P., Bottomley, P.J., 1999. Microbial biomass and