THE INFLUENCE O F GENETIC BACKGROUND ON THE FREQUENCY AND THE DIRECTION OF RADIATION-INDUCED
MUTATIONS AFFECTING A QUANTITATIVE CHARACTER
ILSE MULLER1 AND ALLEN P. JAMES2
Atomic Energy of Canada Ltd., Chalk River, Ontario, Canada
Received September 5 , 1961
ANY independent investigations have been concerned with the influence Mof a random sample of radiation-induced mutations on quantitative traits in diploid organisms (RUSSELL 1957; BURDICK and MUKAI 1958; WALLACE 1958; FALK 1959; JAMES 1960). The results of these investigations have been incon- sistent. Some have revealed a positive shift in the mean of the character under study which has been attributed to a high degree of overdominance of induced negative mutations. In contrast, other investigations have uncovered a negative shift in the mean. These latter results have provided little evidence of overdomi- nance but have indicated the presence of many detrimental mutations with small dominant effects. One explanation for the discrepancies may lie in the fact that the phenotypic effect of induced mutations can be influenced by the genic background with which the mutations must interact. An example has been provided by GUSTAFSON (1 951 ) who found that certain recessive lethals in barley which were detrimental in the heterozygote under a standard environment, be- came advantageous under a changed environment, but lost this beneficial effect completely when brought into another genotype.
The present investigation is concerned with the following questions: (1 ) How important is the genetic background in determining whether induced mutations in a polygenic system will result in a positive or a negative shift in the test char- acter? (2) I s the phenotypic effect of induced mutations discernibly influenced by the degree to which an organism is adapted to its environment?
MATERIAL A N D METHODS
The study utilized the character of “growth rate,” i.e. rate of cell division, in three different strains of yeast.
The phenotypic effect of mutations was studied by comparing the distribution of individual growth rates of members of a population of irradiated cells with the corresponding distribution for an unirradiated control population. With this technique it was possible to obtain an estimate of mutation effect without identi-
1 Present Address: Inst. f . Entwicklungsphysiologie d. Universitat, Koln, Germany. 2 Atomic Energy of Canada Limited.
1 722 ILSE MULLER AND ALLEN P. JAMES
fying or classifying individual mutants. At the same time, the effects of tem- porary damage to the cells were excluded from the data.
The diploid strains of Saccharomyces cereuisiae which were used in these in- vestigations had to fulfill several conditions. For technical reasons, they had to form circular microcolonies of regular outline on solid medium. For investiga- tional purposes, they had to differ in their genetic origin, in the length of ex- posure to a standard environment, and in their growth rate. Three lines were chosen: (1 ) a slow-growing strain, No. 32, (2) a strain of intermediate growth rate, No. 432-1, and (3) a fast-growing strain, No. 4840.
The slow strain, No. 32, was respiratory deficient and formed extremely regu- lar microcolonies. This strain originated in our laboratory as a mutant in a respiratory-sufficient line which had previously been inbred for many genera- tions. It was therefore very homozygous but unadapted to growth as a re- spiratory-deficient strain.
The intermediate strain, No. 432-1, was derived by crossing haploids obtained from the University of Toronto, and from the University of Southern Illinois
(C. C. LINDEGREN’S laboratory). This strain had been maintained as a diploid in our laboratory since 1952. A single generation of inbreeding preceded its use in this investigation.
The fast strain, No. 4840, was a cross of two haploid strains which had origi- nated in C. C. LINDEGREN’S laboratory, and which had been maintained in our laboratory since 1954. The cross was made immediately before the beginning of the experiment. This diploid was probably highly heterozygous. It sporulated well and was free of recessive lethals. Because of its fast growth rate this line may be regarded as the best adapted of the three to the conditions prevailing throughout the present investigation.
Clonal growth rate was chosen as the character for study because it is affected by many mutations and is an “important” quantitative character. Furthermore, it was shown by JAMES (1959) that the method of estimating growth rates from rate of increase in diameter of microcolonies on solid medium is extremely sen- sitive. The method permits estimates to be made before natural selection of spontaneous mutation in the rest of the gene complement has obliterated any radiation-induced genetic change.
In preparing stock cultures a single-cell isolation was made from each strain. These were incubated and as soon as the size of the resulting clones allowed, 20 new isolations were made from each. The growth rates of the clones resulting from these latter isolations were determined and those clones showing extreme growth values were discarded. The remaining clones were incubated for three days and then kept refrigerated until used.
GENETICAL ENVIRONMENT 1723
mately 16 percent of the cells (JAMES and CHAPLIN 1956). The yeast suspension was agitated during irradiation.
Immediately after irradiation 12 cells were isolated, together with 12 cells of the corresponding control sample. Four cells were placed in prearranged loca- tions on a droplet of fortified agar medium on an inverted coverslip (JAMES and SPENCER 1958). Each droplet contained two test cells and two control cells. Each coverslip was inverted over a Van Tieghem-cell which contained a drop of water and was then sealed with vaseline. The slides were incubated at 21.7” 2 0.1”C.
A detailed description of the technique for measuring the microcolonies and for calculating the values in which growth rate is expressed, is given by JAMES and SPENCER (1958) and JAMES (1959). We used the so-called two-point value, in which the growth rate of a clone is represented by the average increase per hour of the logarithm of the colony diameter:
.
All physiological effects, such as division delay and stimulation (BURNS 1958; JAMES and MULLER1961), which might have been caused by the irradiation, were excluded from the data by this method. The two measurements on which the growth value was based were made during the logarithmic phase of growth. At this time the growth curve of the colony was linear on a semilogarithmic scale. The time interval between the two readings was approximately the same for all clones of one strain. This interval differed between strains because of their different rates of growth.
No attempt was made to differentiate between those cells that divided only a few times and then stopped and those that did not reach the lower limit of the linear part of the growth curves at the time of the first measuremat. Both a p pear as “near-lethals” in the graphs. I n the slow strain, No. 32, many test and control cells showed such a considerable lag before the first division and such a slow growth afterwards, that the colony size did not permit an exact measure- ment. Because this lag was indistinguishable from irradiation-induced lag and slow growth, the number of near-lethals in this strain was not determined. All doubtful cases were excluded from the calculations and graphs. There were always some cells which did not divide after planting because they had been killed either by irradiation or by micromanipulatian. For the statistical analyses only paired data were used.
Data from approximately 500 pairs of irradiated and control cells were ob- tained for each strain. The distributions of growth rates were each compiled from 12 to 16 daily lots of data. Small differences in such factors as temperature, humidity, subculture, and medium, can affect the means of the lots significantly. A correction was applied to prevent such differences from increasing the vari- ances and obscuring differences between the control and irradiated samples. Here the overall mean growth value of the controls was taken as a standard. The differences between this and the daily control means provided a value for cor- recting all individual control and irradiated values. Overall variances were cal- culated by adding the “daily’’ sums of squares and dividing by the sum of the degrees of freedom. All other statistical methods were standard.
1 724 ILSE MULLER AND ALLEN P. JAMES
RESULTS
The results are presented graphically in Figures 1, 2 and 3, and statistical analyses are summarized in Table 1. An inspection of the figures is sufficient to
FIGURE 1.-Distribution of growth rates within an irradiated and a control population of the slow strain, No. 32.
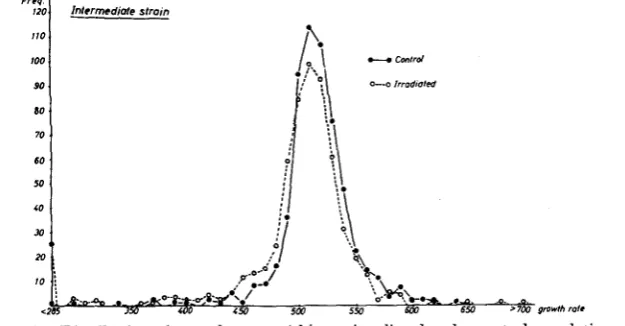
FIGURE 2.-Distribution of growth rates within an irradiated and a control population of the intermediate strain, No. 432-1.
TABLE 1
Statisticol amlyses of the effect of irradiation on subsequent growth of cells of a slow, an intermediate, and a fast-grotuine strah of yenrr
Fast ru". no. 4840
cont. I=. n
Intermediate amin Do. 432-1
Coni. Irr. n P
Slaw atrain no. 32
cont. Irr. n P
Mean growth
rate (a)' 239.8 240.5 336 >0.8 515.4 504.4 561 <0.001 568.1 571.4 540 >O.l
. . . . . . . . . . . . . 514.6 493.5 584 <0.001 566.7 564.8 555 >0.5
510 510 584 _ . _ _ 570 570 555 .... Modal value 240 240 336 ..
GENETICAL ENVIRONMENT 1725
FIGURE 3.-Distribution of growth rates within an irradiated and a control population of the fast strain, No. 4840.
show that the investigation was successful in demonstrating irradiation-induced shifts in a polygenic trait. The direction of these shifts is, however, somewhat surprising. Taken at face value, the data imply that mutations have been: (a) completely ineffective in the slowest strain, (b) negative in the intermediate strain and ( C ) mainly positive in the fastest growing strain.
The data from each strain will be considered separately in more detail. Slow strain: It is very doubtful if any induced mutations were able to improve growth rate in the slow strain, No. 32 (Figure 1 ) . Certainly the number of such mutations must be very small. O n the other hand, there were also few or no variants showing a small detrimental effect; the mean, mode and variances of control and irradiated populations are practically the same. Nothing can be said about the occurrence of near-lethals since no attempt was made to detect them, but it can be suspected that some were induced.
Intermediate strain: In contrast, there can be no doubt that irradiation in- duced a relatively high number of mutations with detrimental effects in the intermediate strain (Figure 2). The modal values of both samples are the same, but the ratio of colonies to the right and to the left of the mode is signifi- cantly different:
x2
= 10.99; P<
0.001 (without near-lethals). The same fact is reflected in the significantly lower mean of the irradiated population (Table 1 ) . Even if the pairs with a near-lethal partner are not included in the calcula- tion, the mean remains lower.1726 ILSE MULLER AND ALLEN P. JAMES
TABLE 2
Variance analyses of the effect of irradiation on the distribution of growth ualues of the intermediate strain, no. 432-1
Var. coritiol Var. h a d . E’ P
Total 40.59 61.71 1.52 <O.Ol
Minus side of mode 83.78 150.92 1.80 <O.Ol
Plus side of mode 61.78 69.56 1.13 >0.05
the minus side of the distribution. There is only a small and insignificant increase in the plus variance of the irradiated sample, a fact which shows that there are few, if any, positive variants.
Fast strain: The results for the last and fastest growing strain, No. 4840, are different from those for either of the other two strains (Figure 3). Here the most striking characteristic of the irradiation effect is the shift of the exposed population to the positive side. Even the modal value of the distribution is shifted to the next higher class when the number of classes is doubled. This shift is in contrast to the absence of any such effect in the first two strains, where the test modes remain in the same class as the control modes, regardless of any reduction in the size of the class interval. The variance of the values from the irradiated population is significantly larger. Irradiation did not affect the mean of this strain (Table 1 ), a fact which, in view of the increased variance, indicates that negative variants, as well as positive, were induced.
The increase in the modal value for the fast strain upon irradiation is so large as to be disconcerting; it implies that a positive mutation occurred in nearly every one of the irradiated cells. Even if it is assumed that the positive shift of the modal value is only a matter of chance, then still a n improbably high num- ber of positive variants remain. As a consequence, the data were examined care- fully to see whether there could be some explanation for this phenomenon other than mutation.
A systematical error in the experimental method is suggested by the regular appearance of the curve. Such an error might result from a convexity of the growth curves when log diameter is plotted against time. Due to the induced delay of the first cell-divisions, the irradiated clones did not usually reach the same diameter as the controls in the time interval between planting and measure- ment. As a result, the average diameter at the second measurement was higher in the control than in the irradiated sample. This fact would not have any in- fluence on the estimated growth rates if all measurements were taken on the linear parts of the growth curves. However, if the larger colonies lie on a de- clining curve, then their estimated growth values will be too low. It was shown by JAMES (1 959), that the growth curves of colonies are nearly linear on a semi-
GENETICAL ENVIRONMENT 1727 importance in the cases of the slow and intermediate strains, but might be of major importance in interpreting the results of irradiating the fast strain.
Five independent tests were undertaken in an effort to determine the extent
of the separate influences of mutation and of curvature on the growth values of the fast growing strain.
(1 ) In the first test direct evidence of curvature was sought by comparing two growth values obtained from the same clone at different times. Each clone was measured three times. The interval between the last two measurements was two hours, a time in which a decline of the curve should show up clearly. The growth values calculated from this interval should be lower on the average, than those from the first interval if the data are in fact biased by nonlinearity of the growth curves. This was certainly not the case; in 19 of 32 control clones, and in 21 of 32 test clones the growth values calculated from the second interval were actually greater than those from the first interval.
(2) A second test for nonlinearity of the growth curves was based on the ex- pectation that there would be a negative correlation between the size of the colony at the time of the final measurement and its growth value if the curve is non- linear. The regression coefficients from three randomly chosen lots revealed no such relation:
Lot 1: b = -47.67 2 40.31
Lot2:b=+91.66 .t 54.61
Lot 3: b +83.07 2 32.00
Only the third coefficient is significant, and this is a positive regression. The existence of such a positive regression is not surprising, because the fast growing colonies naturally tend to be the larger ones.
( 3 ) In the third test an attempt was made to remove any bias introduced by nonlinearity and then to see if a positive shift remained. All data were divided into several classes according to colony size at the final measurement (log 2 ) . Growth rate comparisons were then made within each class. Figure
4B
shows the mean growth rates in each of these classes. There is a distinct drop in the mean growth rate of the classes containing larger colonies. This is without doubt due to flattening of the growth curves. However, the number of clones in these classes is too small to play a decisive role in the distribution, as can be seen from Figure 4A, which shows the frequency of clones in each class. All values from classes greater than 2.0 were excluded from further calculations. In the other classes the control means usually lie below the means of the irradiated sample. A x2 test over the 13 classes in which both groups are represented by more than five clones, implied a significant difference (P<
0.02). It is evident that irradiation has affected the growth values regardless of any bias attributable to nonlinearity ofthe curves.
1728 ILSE MULLER AND ALLEN P. JAMES
0-0 Control 0-0 Irradiated
I
1.65 1.75 1.85 1.95 2.M
Log 10
colony diom
- - - a
550
1 6 5 175 i e5 I95 2 01
Loglo colmy diam
FIGURE 4.-(A) Frequencies of irradiated and control clones of No. 4840, when classed according to their size at the final measurement. (B) Mean growth values of clones in each class.
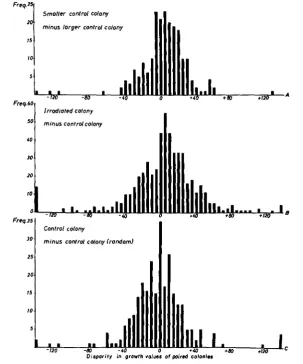
pair in each Van Tieghem-cell) the partners with the larger diameter were classed as one group. Their growth values were subtracted from the values of their partners which were smaller. In the absence of a bias, the resulting distri- bution of differences should be a normal one around the modal value 0. But Figure 5A shows that it is even more skewed than the distribution of the values for irradiated minus control colony (Figure 5B). Distribution 5C, which is es- sentially normal, is obtained if one control value is subtracted randomly from the other without regard to colony size. It is clear that a bias exists. Whereas the initial tests showed that the absolute size of a colony has no influence, within certain limits, on its growth value, this more refined test makes it obvious that the relative size is important; where one clone is larger than its neighbor its growth value tends to be lower.
GENETICAL ENVIRONMENT 1729
Smoller control colony
minus larger control colony
Disparity in growth volues of paired colonies
FIGURE 5.-Distributions of differences between paired growth values.
tional” shift with the same general technique used to demonstrate the bias. T h e reasoning was as follows: The distribution of a sample of control growth value differences where half the subtracted values are from larger colonies and half are from smaller colonies is essentially normal (Figure 5 C ) . If the irradiation- induced positive shift is caused only by the bias, then the distribution of the differences (irradiated minus control) should be skewed to the minus side when it is artificially so composed that the irradiated clone is always larger than the control. Similarly, the distribution of these values should be skewed to the PlUS side when each irradiated clone is smaller than its control. A distribution arti- ficially so composed that half the irradiated clones are larger and half are smaller should, like that of Figure 5C, be essentially normal.
1730 ILSE MULLER A N D ALLEN P. JAMES
I
control colony smaller-
-120 -80-
40 0 420Freq. I5
IO.
Contrd colony larger
5
I ' s
+80 + I 2 0 O
Frq'
"1
Combined dolo25
20
I5
10
5
0
Oispority in growth values of poirsd colonres
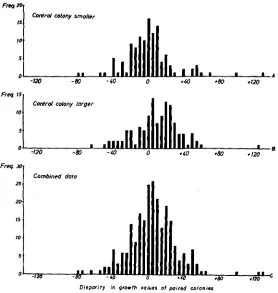
FIGURE 6.-Distribution of differences in growth values between irradiated and control colonies.
is the larger (6A), the distribution is not skewed but is almost symmetrical, 61 minus:59 plus, about the modal value of zero. Figure 6B represents a sample of the same size as 6A, selected randomly out of the large group of pairs where the controls were larger than their irradiated partners. It shows that the positive shift, 36.5 minus: 83.5 plus, is much stronger than the corresponding control shift (Figure 5A) with 73 minus : 136 plus. The sum of both distributions (6A
+
6B = 6C) is not normal, but displays instead a significant positive shift, 97.5 minus : 142.5 plus. A positive shift of the distribution of test values, independent of the bias discussed above is implied.It was possible to counter a n objection that the random sample in which the control is larger (6B) is not equivalent to that in which the cantrol is smaller (6A). Such a lack of equivalence might stem from the fact that the colony re- sponsible for a discrepancy in size can be either test or control. For example, a
GENETICAL ENVIRONMENT 1731
from the sample with the larger controls. One of these two groups contained the largest controls. The other contained the smallest irradiated clones. They gave proportions of 28.5 minus: 91.5 plus and 34.5 minus: 85.5 plus, respectively. Both were even more positive than the random sample, but neither was significantly different from it (P
>
0.2 and>
0.7 respectively). It is evident that the samples are equivalent and that a radiation-induced positive shift exists independently ofa methodological bias associated with nonlinearity of the growth curves. In the absence of any other known cause, this must be attributed to positive mutation.
DISCUSSION
Any one of three different categories of results might be expected from this investigation of the phenotypic effects of random samples of radiation-induced mutation in different genetic backgrounds. First, all three strains might have reacted similarly, whatever the effect. This would imply a low degree of epistasis in radiation-induced mutations affecting quantitative characters. Second, the strains might have reacted differently from each other, but in accordance with some simple basic pattern. Such a pattern might be an increased tendency toward a positive shift as the degree of “fitness” is reduced. Certainly it is reasonable to suppose that a random mutation has a better chance of being beneficial if it occurs in a poor strain. Third, the reaction of the strains might have been so complexly individualistic as to appear capricious.
The results of this investigation point unequivocally to this last possibility; they emphasize the overriding importance of particular, and often unrecognized, aspects of the individual genetic background in determining the phenotypic effect of mutant genes. The slowest and least adapted strain was not obviously changed despite its inferior genotype. In contrast, the intermediate strain produced many slow-growing variants, and the fastest and “best adapted” strain produced posi- tive variants in addition to negative variants.
With hindsight it is relatively easy to provide a suitable explanation for the behavior of each of the strains. An explanation of the lack of any effect in the slow strain may lie in the fact that cytoplasmic deficiency acts as a block in the positive direction and as a buffer in the negative one. The decrease in the rate of growth as dictated by the deficient plasma is much larger than the effect of small detrimental genic mutations in an otherwise well functioning genome would be. In all probability the result would have been the same if, instead of
this cytoplasmic defect, the strain had possessed one or more detrimental genes which controlled some basic biochemical reactions. It seems likely that the re- action of this strain to irradiation may he duplicated in all those populations where a strong epistatic gene prevents any phenotypic expression of radiation- induced changes in a polygenic system.
The response of the intermediate strain, No’. 432-1 to irradiation is of the kind to be expected from a well-adapted population; the probability that any induced mutation will disturb the balance is very high.
1732 ILSE MULLER AND ALLEN P. JAMES
diploid, was still far from having attained optimal adaption; despite its rapid rate of growth, many possibilities for further improvement remained.
There must be factors in addition to gene interaction which affect the genetic response of a strain to irradiation. These include mitotic crossing over and rate of gene mutation. Such factors must share responsibility for the vagaries ex- hibited by various genetic constitutions. There can be no doubt that a n accurate prediction of the phenotypic effect of a random sample of radiation-induced mutations on a quantitative character is impossible in the absence of explicit information about the genetic background against which these mutations are placed.
SUMMARY
The influence of genetic background on the phenotypic effects of a random sample of radiation-induced mutations affecting a quantitative character was studied. The character was rate of cell division in Saccharomyces cerevisiae.
Three diploid strains of yeast which differed in rate of cell division and in degree of heterozygosity were utilized. The distributions of growth rates of clones produced by single-cell isolates of the irradiated populations were compared with those for unirradiated control samples.
No two of the strains reacted alike. Mutations were completely ineffective in the most homozygous and least adapted strain, mainly negative in the intermedi- ate strain, and mainly positive in the most heterozygous and fastest growing strain.
It was concluded that vagaries in the influence of different genetic constitutions on the expressions of the mutant genes are stronger than was originally supposed. The importance of epistasis in quantitative inheritance is emphasized.
ACKNOWLEDGMENTS
The senior author wishes to express her thanks to the National Research Coun- cil of Canada, which made these stuhes possible by the grant of a postdoctorate Fellowship, to Atomic Energy of Canada Ltd. for providing research facilities and to DR. H. B. NEWCOMBE for his interest and many helpful suggestions. Finally our thanks are due to MRS. C. TOWNSEND and MR. A. MACDONALD for their technical help.
LITERATURE CITED
BURDICK, A. B., and T. MUKAI, 1958 Experimental consideration of the genetic effect of low doses of irradiation on viability in Drosophila melanogaster. Proc. 2nd Intern. Conf. Peaceful Uses Atomic Energy, Geneva 22 : 325-329.
X-ray-induced division delay of individual yeast cells. Radiation Research
4: 394-412.
Viability of Drosophila heterozygous for irradiated chromosomes. Science 130:
Mutations. environment and evolution. Cold Spring Harbor Symposia
BURNS, V. B., 1956
FALK, R., 1959
1416.
GENETICAL ENVIRONMENT 1733
The spectrum of severity of mutant effects. I. Haploid effects in yeast.
The spectrum of severity of mutant effects. 11. Heterozygous effects in yeast. Genetics
The fate of radiation-induced lethals i n a yeast popula-
Radiation-induced mitotic stimulation. Radiation Research
JAMES, A. P., 1959 Genetics 44: 1309-1324.
45: 1627-1648. 1960
JAMES, A. P., and C. E. CHAPLIN, 1956
JAMES, A. P., and I. MULLER, 1961
JAMES, A. P., and P. E. SPENCER, 1958
RUSSELL, W. L., 1957
WALLACE, B., 1958
tion. Radiation Research 5: 162-166.
14: 779-788.
The process of extranuclear mutation in yeast. Genetics
Shortening of life i n the offspring of male mice exposed to neutron
The average effect of radiation-induced mutations on viability in Drosophila
43: 317-331.
radiation from an atomic bomb. Proc. Natl. Acad. Sci. U.S. 43: 324-329.