The Coalescent Process in Models With Selection and Recombination
Richard R. Hudson' and Norman L. Kaplan
National Institute of Environmental Health Sciences, Research Triangle Park, North Carolina 27709 Manuscript received March 7, 1988
Revised copy accepted July 14, 1988
ABSTRACT
The statistical properties of the process describing the genealogical history of a random sample of genes at a selectively neutral locus which is linked to a locus at which natural selection operates are investigated. It is found that the equations describing this process are simple modifications of the equations describing the process assuming that the two loci are completely linked. Thus, the statistical properties of the genealogical process for a random sample at a neutral locus linked to a locus with
selection follow from the results obtained for the selected locus. Sequence data from the alcohol dehydrogenase (Adh) region of Drosophila melanogaster are examined and compared to predictions based on the theory. It is found that the spatial distribution of nucleotide differences between Fast and Slow alleles of Adh is very similar to the spatial distribution predicted if balancing selection operates to maintain the allozyme variation at the Adh locus. The spatial distribution of nucleotide differences between different Slow alleles of Adh do not match the predictions of this simple model very well.
I
N a companion study, KAPLAN, DARDEN and HUD- SON (1988) described the process of the genea- logical history of a random sample of genes at a locus which is not selectively neutral. They showed that this process has a relatively simple representation and they developed methods for calculating the moments of such quantities as T , the sum of the lengths of the branches of the ancestral tree.T h e purpose of this paper is to study the distribu- tion of the coalescent process for a random sample of genes at a selectively neutral locus which is linked to a locus which is not selectively neutral. If the two loci are completely linked, then the genealogical history of the neutral locus is the same as that of the selected locus and so the results of the companion study apply. On the other hand, if the two loci are completely unlinked, then the distribution of the coalescent pro- cess for the neutral locus is unaffected by the selected locus. In the THEORY section the distribution of the coalescent process for the neutral locus is determined for arbitrary rates of recombination.
T h e coalescent process for a sample of genes at two selectively neutral loci which are linked to a selected locus is also investigated. This distribution is needed to calculate such quantities as the variance of the number of segregating sites at m ( m 2 1) selectively neutral loci which are linked to a selected locus.
As an application, we consider the sequence data of KREITMAN (1 983) which encompasses the Adh locus of Drosophila melanogaster. Several studies of variation at this locus suggest the presence of a balanced poly-
' Present address: Department of Ecology and Evolutionary Biology, University of California, Irvine, California 92717.
Genetics 120: 831-840 (November, 1988)
morphism at the Adh locus (e.g., OAKSHOTT et ul. 1982; KREITMAN and A G U A D ~ 1986; HUDSON, KREIT-
MAN and A G U A D ~ 1987). This possibility is examined in light of the results in this paper.
THEORY
T h e coalescent process for a selectively neutral m-
loci model with recombination has been studied by HUDSON (1 983) and KAPLAN and HUDSON (1 985). T h e genealogy for m linked loci is a collection of m cor- related ancestral trees. For finite rates of recombina- tion the topologies and the lengths of the branches of different ancestral trees are correlated because of linkage. In the neutral case, HUDSON (1 983) described the structure of this more complicated coalescent process and showed how to simulate it. KAPLAN and HUDSON (1 985) extended HUDSON'S work and estab- lished recursive equations for calculating the moments of the number of segregating sites at the m linked loci.
In this section we study the coalescent processes for one and two selectively neutral loci which are linked to a locus which is not selectively neutral. These two cases are necessary to calculate such quantities as the mean and variance of the number of selectively neu- tral segregating sites.
rrcombinbn
and random
mut.tbn infinite infinite selection infinite ~ P l i n g
N diploids
---
> dipbids """> N diploids(geneRtkn 1-1) ( generation t )
FIGURE 1 .-The life cycle
> "
gametes "b' diploids
"-
assumed that the population has achieved stationarity and so the current generation from which the sample is taken is denoted as the 0th generation. T h e time parameter t thus takes on both positive and negative values, where negative generation times denote an- cestral generations and positive generation times fu- ture generations.
Each generation the daughter population is ob- tained by random sampling with replacement after mutation, recombination and selection have occurred. T h e life cycle of the process is shown in Figure 1. The fitnesses of the three genotypes AIAI, AlA2 and A2A2
are w l l , w l 2 and w22, respectively, and the mean fitness is denoted by G ( t ) . T h e rates of mutation at the selected locus, A , are u (AI to A2) and v (A2 to AI) and
the rate of recombination between the A and B locus is r . It is assumed that
p = - + o ( $ ) ,
2N P Iv = - + o ( $
2N P 2and
where
PI
>
0, P 2>
0 and R>
0.We now consider the structure of the coalescent process for a sample of genes at the neutral B locus. Since the ancestral genes of the sample are linked to either an A I or A2 allele, the coalescent process is two dimensional. If n genes are chosen at random from the 0th generation, then we let Q(0) = (i, j) if i of the sampled genes are linked to an A1 allele and j to an
A2 allele, 0 5
i,j
5 n, i + j = n. For t<
0, Q(t) denotes the numbers of ancestral genes linked to A I and A2 alleles in generation t.By its very definition the Q process is a jump process. We define T I , T2,
. . .
to be the number of generations between successive jumps andZl,Z2,
~.
.
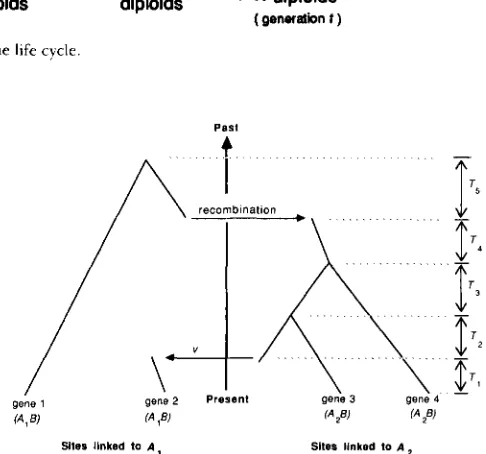
the successive random states to which the process moves. The Q process can therefore be represented asPast 4
Sites llnked to A , Sites llnked to A
FIGURE 2.-A realization of the coalescent process for a sample of size four. At generation zero (the present) the Q process is at state (2, 2), ie., two of the B genes are linked to A I alleles and two are linked to An alleles. T h e first change of state, as one follows the process back in time, is at time - T I (ie., T I generations before present), at which time the Q process moves to state (1, 3). This change of state is the result of the mutation of an ancestral A2 allele to an A I allele and is indicated by a v in the figure. At time - ( T I
+
T 2 ) and time - ( T I+
T2+
T 3 ) common ancestors of genes linked toA z alleles occur, and so the Q process moves to (1, 2) and then t o
(1, 1). At time -(TI
+
T2+
T ,+
T4) the Q process moves to (2, 0 )as a result of a recombination event in which an ancestral A I B parent produces an AzB offspring. And finally, at time - ( T I
+
T Z+
T ,+
T4+
T s ) , the most recent common ancestor of the sample at locusB occurs, i . e . , the Q process moves to ( 1 , 0).
Since the number of ancestral genes does not in- crease as one goes back in time, the Q process even- tually reaches either of the two states (1, 0) or (0, l ) ,
ie., there is a single ancestor of the sample at the B locus and it is linked to an A I allele or an A 2 allele.
The ancestral generation in which this first occurs is that generation which has the most recent common ancestor of the sample at the B locus. An example of a realization of the coalescent process is shown in Figure 2.
Coalescent With Recombination 833
to show that
+
X(t-
1)(1-
X(t-
l,,m,,)+
o($
= X(t
-
1 )+
o($,
-
-
X(t- 1)(P1+ R(l -X(t- 1))) 2N+
X(t-
1)(1-
X ( t-
l))wl*)+
o($)
= 1 - X ( t - 1 ) O
iJ
-
and
Thus, all the formulas of KAPLAN, DARDEN and HUD-
SON ( 1 988) apply providing that
PI
and P 2 are replacedby
P l ( x ) =
01
+
R(l-
x) andP ~ ( x )
= P 2+
Rx. ( 1 )The coalescent process for a random sample at the neutral B locus thus behaves much like the coalescent process for a random sample at the selected locus and so the conclusions of the preceding paper apply. For example, if the frequency of A I is maintained by selection at XO, i . e . , the allelic frequencies are tightly
regulated, then the mean and the variance of T for
the selectively neutral B locus are different from their neutral values only if both Pl(xo) and &(xO) are small. (See Table 1 of KAPLAN, DARDEN and HUDSON 1988.) Since Pl(x0) is greater than R(l
-
xo) and &(xo) is greater than Rxo, the mean and the variance of T will therefore look neutral if R is greater than, say, two. T h e distribution of T can also be calculated when the allelic frequencies are not tightly regulated by replac- ingPI
and P 2 by Pl(x) and @*(x) in Equation 20 ofKAPLAN, DARDEN and HUDSON (1988).
We now consider the coalescent process for two neutral loci, B and C, which are linked to a selected locus, A . This process is more complicated than the previous case, since one now needs to keep track of whether or not the genes at the B and C loci are ancestral to the genes at the two loci in the sample. There are six different types of ancestral chromo- somes: A I B C , A I B - , A I - C , A2BC, A2B- and A2-C. T h e dash indicates that the gene at that locus is not ances- tral to the sample. T h e effect of recombination de- pends on whether the selected locus, A , lies to the right of, to the left of, or between the two neutral loci. For the sake of definiteness, we will assume that the relative positions of the three loci are ABC, and the modifications for the other case will be indicated. T h e rates of recombination between loci A and B and A and C are denoted by TAB and rAC, respectively. As
before it is assumed that
where RAC 2 RAB 2 0.
Despite the increased complexity of the ancestral history, the same kinds of arguments as before can be used to show that when time is scaled in units of 2N generations and the frequencies of the alleles at the A locus are tightly regulated, the coalescent process behaves like a Markov jump process (KARLIN and TAYLOR 1981). T o specify the parameters of this process we need to introduce some notation. Let Q(t)
= ( i , j ) where i = ( i l , is, i s ) ,
j
= ( j l , j z , j 3 ) and i l , i p , is, j 1 , j 2 and j 3 are the numbers of AIBC, AIB-, AI-C,AzBC, A2B- and A2-C ancestral genes in generation t . When the Q process changes state, each of the com- ponents of i and
j
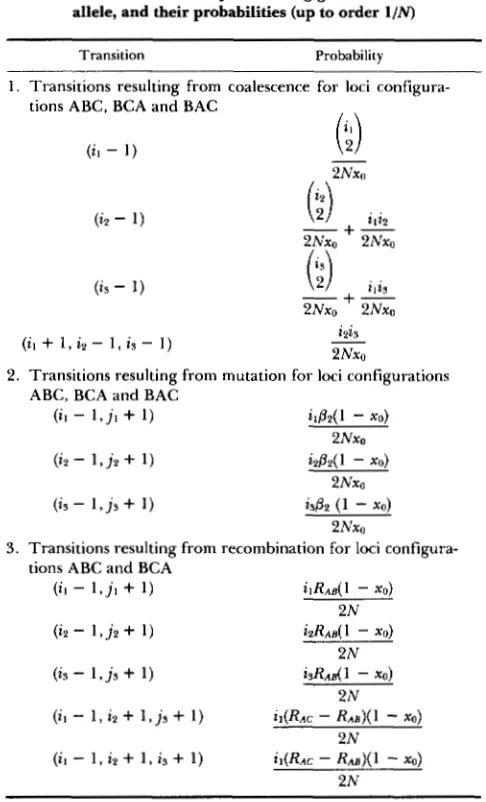
will either increase by 1 , decrease by 1 or remain the same. T o simplify the notation only those components which change will be indi- cated.TABLE 1
Possible transitions from (i, j ) , involving genes linked to the At allele, and their probabilities (up to order 1/N)
Transition Probability
1. Transitions resulting from coalescence for loci configura- tions ABC. BCA and BAC
( i l
+
1, i 2 - 1, i 3 - 1)(I;)
~
itions which result from recombination. The condi- tional probabilities (up to order 1/N) of the 12 trans- itions involving genes linked to the A1 allele are given in Table 1 . T h e conditional probabilities of the other 12 transitions involving genes linked to the A2 allele
can be obtained from Table 1 by replacing i by j ,
Dl
by 0 2 and XO, the frequency of the A I allele, by 1
-
x0. It has already been pointed out that the effect of recombination is influenced by the relative positions of the three loci. In Table 2 are given the conditional probabilities (up to order 1/N) of the 5 transitions involving genes linked to the A1 allele which result from recombination, assuming the selected locus, A, lies between the two neutral loci.For ease of notation let the 24 transitions be labeled from 1 to 24 in some specified order. Also, the con- ditional probability of the kth transition is denoted by pk/2N, 1 5
K
5 24. For any i, j let24
hq =
2
pr
and q q ( k ) = -, P k 1 5 k 5 24.k= 1 hq
TABLE 2
Possible transitions from
(id),
involving genes linked to the A I allele, and their probabilities (up to order l/N): transitionsresulting from recombination for loci configuration BAC
Transition Probability
2N
Finally, we are in a position to give the parameters of the Markov jump process. Indeed, the holding time in state (i, j ) has a negative exponential distribution with parameter hq and when a jump does occur, the probability that it is the kth transition equals q,j(k), 1
5 k 5 24.
Let TB and TC denote the sum of the lengths (meas- ured in units of 2N generations) of the branches of the ancestral trees for locus B and C , respectively. T h e mean and variance of TA and T B can be calculated using the recursive equations of KAPLAN, DARDEN and
HUDSON (1988). T o compute the expectation of such
quantities as TBTc and e-(eBTE+ecTc)/2, BB
>
0 , Bc>
0, we need to use the coalescent process for two loci. The expectation of TBTc is needed to compute the variance of the number of segregating sites at the two loci. IfOB = 4 N p ~ and Bc = 4Npc, where p~ and pc are the neutral mutation rates at the B and C locus, respec- tively, then the expectation of e--(8ETs+eCTC)/2 is the prob- ability that there are no segregating sites at either of the two loci. This expectation is required for some of the calculations of the next section.
For any i, j let
M B ( ~ , j ) = E(TBI Q(0) = (i, j ) ) ,
and
Coalescent With Recombination
and
2hijE(H~c(&)
I
Q(0) = ( i , j ) )HBc(i’ j ) = $jB +
icec
+3,
f (4)where the distribution of Z1 is given by the {qG(k), 1 5
k 5 24).
A N APPLICATION
Recent studies of polymorphism at the alcohol de- hydrogenase (Adh) locus of Drosophila melanogaster have suggested that natural selection maintains varia- tion at this locus (e.g., OAKESHOTT et al. 1982; KREIT-
MAN and A G U A D ~ 1986). HUDSON, KREITMAN and
A G U A D ~ (1987) have shown that the levels of poly- morphism within D . melanogaster and the amount of divergence between D. melanogaster and Drosophila sechelia at the Adh locus and a flanking region are not compatible with an equilibrium neutral model of mo- lecular evolution. They suggested that balancing se- lection acting on the Fast/Slow electrophoretic poly- morphism (at codon 192) of the Adh gene might account for the high observed level of polymorphism of silent sites in the coding region. With the theory presented in the previous section we can begin to examine this hypothesis. Using the Adh sequence data of KREITMAN (1983) we can compare the observed level of variation at different points along the se- quence to the level predicted by a model with balanc- ing selection operating on the Fast/Slow polymor- phism of the Adh gene.
T h e data of KREITMAN (1983) consists of the se- quences of l l cloned D. melanogaster Adh genes. In this sample of eleven sequences, 43 polymorphic nu- cleotide sites were observed, only one of which results in an amino-acid polymorphism. That amino acid polymorphism is responsible for the electrophoretic variants, Fast and Slow, commonly found in D. mel- anogaster populations. Six of the 1 1 sequences code for the Slow variant and will be referred to as Slow sequences. The other five sequences will be referred to as Fast sequences.
T h e goal of this section is to address the following questions: ( 1 ) If the Fast/Slow polymorphism of Adh is a balanced polymorphism such as that considered in the THEORY section, then what spatial distribution
of neutral variation is expected in this region of the genome? and (2) How does the actual spatial distri- bution of variation in the Adh region compare with the theoretical prediction? T o examine the spatial distribution of the polymorphic sites, a “sliding win- dow” method is used. That is, at each nucleotide site, the amount of variation expected and observed is calculated for a small window centered on the nucleo- tide site.
Three different quantities were calculated to char- acterize the variability in a window at each nucleotide site. These were r F s ( k ) , the average number of pair-
wise differences between Fast and Slow sequences in the window centered on nucleotide
k,
rss(k), the av- erage number of pairwise differences between Slow sequences in the window centered on nucleotidek,
and rFF(k), the average number of pairwise differ- ences between Fast sequences in the window centered on nucleotide
k.
Numbering the sequences from 1 to 1 1 and letting d V ( k ) denote the number of nucleotide differences between sequence i and sequence j in the window centered on nucleotidek,
the three measures of variability can be written as follows:1
rFs(k) = i e F j c S
c
dij(k),1
r s s ( k ) =
c
d i J m ns(ns-
1) i#jesand
1
rFF(k) =
c
dij(k), (5)where nF and ns are the number of Fast sequences and Slow sequences, respectively, and
F
and S denote the set of Fast sequences and Slow sequences, respec- tively.Since the region sequenced contains protein coding sequences as well as introns and other noncoding sequences, the level of constraint presumably varies considerably. To take at least partial account of the different levels of constraints in these regions, the size of the window was varied so as to keep the number of possible silent changes in the window constant. At noncoding sites and intron sites all changes are consid- ered silent, and in the coding region a silent change is a change which does not affect the amino acid sequence. [This is equivalent to adjusting the window size so that the window contains a constant “effective” number of silent sites, as defined by KREITMAN (1983).]
In Figures 3,
4
and 5 the observed values of r F s ( k ) , a,(k) and x F F ( k ) are plotted as a function ofk
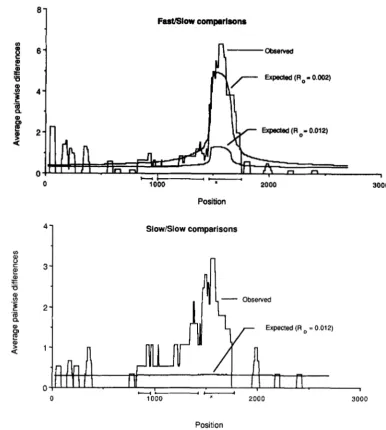
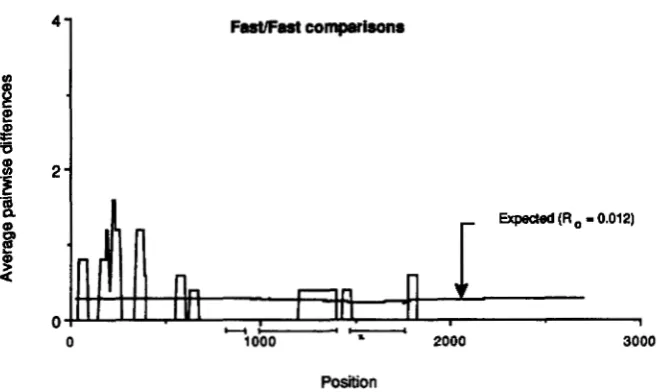
for theAdh sequence data using a window size of 150 possible silent nucleotide changes. This window size corre- sponds to 50 base pairs in noncoding regions. Three interesting features of the data are the rather low values of T F F ( ~ ) in the coding region of the gene, and
the the very high levels of r F s ( k ) in a small region encompassing the Fast/Slow polymorphism, and a somewhat smaller peak in values of rss(k) in the same region.
If each nucleotide site is treated as an individual locus and if it is assumed that the allelic frequencies at position 2 of codon 192 are maintained by strong balancing selection, then the theory of the previous section can be used to calculate the expectation and variance of T F F ( ~ ) , r~s(k) and r s s ( k ) . These calcula- tions require that values be assigned to the parame- ters,
P I ,
Pz,
XO. For each nucleotide site, we also requireFIGURE 3.-The expected and observed number of differences be- tween Fast and Slow sequences in a “sliding window,” ( r F S ( k ) ) , plotted as a function of the nucleotide position,
k . T h e coding exons are shown by the bold lines below the position axis of the plot. T h e Fast/Slow polymor- phism is at position 1552. For these calculations, it was assumed that 00 =
0.006, and = p2 = 0.001. To ob- tain the top expected curve, it was assumed that RO = 0.002, and for the bottom expected curve, it was as- sumed that RO = 0.012. T h e width of the window was adjusted so that there were always 150 possible silent changes in the window. Thus, for example, in noncoding regions the window was 50 base pairs wide.
FIGURE 4.-The expected and observed number of differences be- tween Slow sequences in a “sliding window,” (r~~(k)), plotted as a func- tion of the nucleotide position, k. For these calculations, it was assumed that RO = 0.0 12. All other parameters were as in Figure 3 .
0
6
4
2
0
0
Observed
Expected (Ro- 0.002)
4 -
3-
0
lryl
0”
”
1000 2000
Position
4 Slow/Slow comparisons
3
2
Expected (R = 0.012)
1
0
“
1000
-
2000 3000the value of 8 = 4Np, where p is the neutral mutation rate at the site, and for each pair of sites, we require the value of RV = 2NrV, where rV is the recombination rate between site i and site j .
I t is assumed that the neutral mutation rate is the same at all noncoding sites and all fourfold degenerate sites. (Fourfold degenerate sites are coding sites at which all four nucleotides result in the same amino acid. At such sites all mutations are silent, that is, not amino acid changing.) Denote 4N times this neutral mutation rate by 80. At sites where only one of the three possible mutations is a silent mutation, it is assumed that 8 is 8013. Similarly, at sites where t w o of three possible changes are silent, 8 is assumed to be 280/3. Estimates of 0 have been obtained from restric- tion mapping studies of Adh and other loci in
D.
melanogaster. The heterozygosity per nucleotide (which is equivalent to 8 when 8 is small) has been estimated to be 0.006 for a region 13 kb long that includes the Adh locus (LANGLEY, MONTGOMERY andSlow/Slow comparisons
Expected (R = 0.012)
“”
-
I I
“
1000
-
2000 3000Position
QUATTLEBAUM 1982; AQUADRO et al. 1986). KREIT-
MAN and A G U A D ~ (1986) estimated the heterozygosity per nucleotide to be 0.004 for a 4-kb region located just 5’ to the Adh coding region and 0.006 in the coding region. These estimates must be considered as average values over regions containing coding se- quence, introns and other noncoding sequences. To calculate the expectations under the selective model we have assumed 80 equals 0.006.
We have assumed that only lysine and threonine are permissible at the selected site (codon 192) so only one of the three possible mutations at this site leads to the other selected allele. The mutations that change lysine to threonine and threonine back to lysine are the second position transversions A + C and C + A, respectively. If noncoding sites and fourfold degen- erate sites are on average only slightly constrained, then do equals approximately 4N times the sponta- neous mutation rate. If mutations are equally likely to each of the other three nucleotides, then a plausible
Coalescent With Recombination
FastFasl compsrisonr
Expeded (R
-
0.012)n
v
I
II
I-ll
1“V
0 1000 2000
Position
value for
p1
and p2 isp1
= 0 2 = B0/6 = 0.001. (Recall thatp1
and ,82 equal 2N times the mutation rate to theother allele.) If considerable selective constraint op- erates on noncoding and silent sites then (31 and 0 2
would be somewhat larger than B0/6. If the sponta- neous mutations are strongly biased against transver- sions, then and p2 should be somewhat smaller than
B0/6. For our calculations we have assumed /31 = P 2 =
Since xo, the frequency of the Slow variant, varies with geographic location (OAKESHOTT et al. 1982), it is not clear what value to assign to XO. A more realistic
model must take into account this geographic struc- ture, but here we merely assume that x0 is equal to 0.7, a value obtained for a sample of
D.
melanogaster from Raleigh, North Carolina (KREITMAN and A G U A D ~ 1986).Finally, we assume that R, =
I
i-
jI
Ro, that is, that recombination is uniform in the region. It remains only to assign a value to Ro. T h e value of this param- eter is perhaps the most uncertain of all. Recombina- tion per base pair has been estimated for several regions of theD.
melanogaster genome to be approxi- mately IO-’ per generation in females (CHOVNICK,GELBART and MCCARRON 1977). The neutral muta- tion rate has been estimated to be approximately 5 X
lo-’ per year in many organisms. If we assume that
D.
melanogaster has 4 generations per year then the ratio of recombination per generation to the neutral mutation rate per generation is approximately (1 O-*/ 2)/(5 X 10-’/4) = 4, where the factor of !/2 in the numerator comes from the fact that recombination does not occur in males. This implies that Ro is ap- proximately 4 times B0/2 or 0.012.To calculate the expectation and variance of 7rFs(k), 7rss(k) and 7 r m ( k ) we assumed that the variation at each nucleotide site could be approximated by an infinite- allele model rather than a finite-allele model which would have been more realistic. This assumption is B0/6 = 0.00 1.
3000
FIGURE 5.-The expected and
observed number of differences be- tween Fast sequences in a “sliding window,” (?TFF(k)), plotted as a func- tion of the nucleotide position, k. For these calculations, it was assumed that RO = 0.012. All other parameters were as in Figure 3.
appropriate if B is sufficiently small, so that with high probability at most one mutation can occur at a site in the history of the sample. The calculation of the expectation and variance of 7rFs(k), 7rss(k) and 7 r F ~ ( k )
is described in the APPENDIX. T h e expectations are plotted in Figures 3, 4 and 5 , together with the observed values. Two different values of Ro were used, both the a priori guess, 0.012, and a smaller value, 0.002 chosen to produce a better fit to the observa- tions. For Ro equal to 0.012, the mean (and variance) of nFs(k), 7rss(k) and 7 r F F ( k ) at the selected site are 1.3
(22.0), 0.33 (0.58), and 0.23 (0.83), respectively. For RO equal to 0.002, the mean (and variance) of T F S ( ~ ) ,
7rss(k) and 7 r F ~ ( k ) at the selected site are 4.9 (101), 0.32 (0.47), and 0.21 (0.84), respectively.
Note that a remarkably good fit is obtainable, but that the recombination parameter required for this fit
is about one-sixth of our a priori guess. The large uncertainty of the true value of RO and the high variance of 7 r F S ( k ) near the selected site make the
significance of this discrepancy difficult to interpret. The mean and variance of T F S ( ~ ) at the selected site
for a completely neutral model with the same muta- tion parameter (and ignoring the Fast/Slow polymor- phism) are 0.30 and 0.1 3 for Ro equal to 0.012, and 0.30 and 0.14 for RO equal to 0.002.
The peak in the plot of observed values of 7rss(k) near the selected site was not expected under the balancing selection model (Figure 4). Adjusting the parameter RO has a relatively small effect on the expectation of T S S ( ~ ) and no value of this parameter
under the balancing selection model also needs con- sideration.
DISCUSSION
In the companion study (KAPLAN, DARDEN and HUDSON 1988), the coalescent process was studied for a locus completely linked to a locus at which selection operates. In this paper, the more general situation is considered in which a neutral locus is not completely linked to the locus at which selection operates. In this case, it is found that the coalescent process is similar in form to the process without recombination. T h e equations describing the process for the model with recombination can be obtained from those of the no- recombination model by replacing the mutation pa- rameters
(PI
and &) with simple functions (pl(x) and P2(x) defined by Equation 1) that depend on the mutation rates, the recombination rates, the popula- tion size and the frequency of the A 1 allele at the selected locus.STROBECK (1983) has studied the linkage disequi- librium and homozygosity at a neutral locus linked to a chromosomal arrangement that is maintained in the population by strong selection. T h e quantities
H42,
0), H,(O,
2),
and Hm(l, l), defined in the APPENDIX,are equivalent to STROBECK’S identity coefficients
a1
1,G2.22, a12. If P1 and 0 2 equal zero, then H 4 2 , 0 ) , Hm(O,
2),
and Hm( 1, 1) are identical to STROBECK’S all, a22,a12 as given by his Equation 7.
Under the no-recombination model with tight reg- ulation of the frequencies of the alleles at the selected locus, it was shown by KAPLAN, DARDEN and HUDSON (1988) that the moments of T , the sum of the lengths of the branches of the ancestral tree, do not differ from their values under the neutral model, unless p1
and p2 are small. It follows that, for a site not com-
pletely linked to the selected site, the moments of T are approximately the same as they are under the neutral model, unless the mutation parameters and the quantities, Rxo and R(l
-
XO), are small, say lessthan one. (Recall that R is 2N times the recombination rate between the neutral site and the site where selec- tion operates.) Only sites very tightly linked to the site at which selection operates are expected to have sig- nificantly larger ancestral trees than are expected under the neutral model.
T h e physical size of the region in which neutral variation is significantly elevated depends on the pop- ulation size and the rate of recombination per base pair. For what appear to be reasonable estimates of these parameters in Drosophila, the size of this region is quite small, on the order of a few hundred base pairs. This means that one needs high resolution techniques, such as sequencing or four-cutter restric- tion mapping to detect such narrow regions of high variability. Six-cutter surveys may not give sufficient resolution to detect such regions. In species with lower
population size the expected length of the region with increased heterozygosity is larger, but with smaller population size the amount of nucleotide variation is also expected to be smaller so high resolution tech- niques may still be required.
HUDSON, KREITMAN a n d A C U A D ~ (1 987) previously found that the variation in the Adh region of D. melanogaster in conjunction with between species di- vergence data were incompatible with the neutral model. As shown in Figures 3, 4 and 5 , a model in which balancing selection maintains the Fast/Slow amino acid polymorphism of Adh, predicts many as- pects of the within species variation in the Adh region of D. melanogaster. For example, the balancing selec- tion model predicts that comparisons between Slow and Fast sequences will show a narrow region of high variability. The predicted location and width of this region of high variability are similar to the location and width of the observed region of high variability in D. melanogaster.
Other aspects of the data do not match the predic- tions so well. With an a priori estimate of the recom- bination parameter, the predicted magnitude of the increase in variability is lower than observed. How- ever, the predicted variance of this magnitude is large, so that the observed peak in variation is not incom- patible with the a priori estimate of the recombination parameter. There is also great uncertainty in the a priori estimate of the recombination parameter. With lower values of the recombination parameter, the match between predicted and observed is good. Com- parisons of different sequences bearing the Slow al- lele, show unexpected high levels of variability in the region of the Fast/Slow polymorphism. This may not be a significantly high level of variability, since under the selection model, the variance of the level of vari- ability is high near the site of the balanced polymor- phism. An alternative explanation is that selection is maintaining variation at both the Fast/Slow site and an additional site located near to the Fast/Slow site.
the coalescent process for selective models will be useful in developing such tests.
LITERATURE CITED
AQUADRO, C. F., S. F. DEESE, M. M. BLAND, C. H. LANGLEY and C. C. LAURIE-AHLBERG, 1986 Molecular population genetics of the alcohol dehydrogenase gene region of Drosophila mela-
nogaster. Genetics 114: 1 165-1 190.
CHOVNICK, A., W. GELBART and M. MCCARRON, 1977 Organization of the Rosy locus in Drosophila melanogaster. Cell
11: 1-10.
HUDSON, R. R., 1983 Properties of a neutral allele model with intragenic recombination. Theor. Popul. Biol. 23: 183-201. HUDSON, R. R., M. KREITMAN and M. A G U A D ~ , 1987 A test of
neutral molecular evolution based on nucleotide data. Genetics
KAPLAN, N. L., T. DARDEN and R. R. HUDSON, 1988 The coa- lescent process in models with selection. Genetics 120 831- 840.
KAPLAN, N. L., and R. R. HUDSON, 1985 The use of sample genealogies for studying a selectively neutral M-loci model with recombination. Theor. Popul. Biol. 28: 382-396.
KARLIN, S., and H. M. TAYLOR, 1981 A Second Course in Stochastic Processes. Academic Press, New York.
KREITMAN, M., 1983 Nucleotide polymorphism at the alcohol dehydrogenase locus of Drosophila melanogaster. Nature 304:
KREITMAN, M., and M. A G U A D ~ , 1986 Excess polymorphism at the Adh locus in Drosophila melanogaster. Genetics 114: 93-
110.
LANGLEY, C. H., E. A. MONTGOMERY and W. F. QUATTLEBAUM,
1982 Restriction map variation in the Adh region of Dro- sophila. Proc. Natl. Acad. Sci. USA 79: 5631-5635.
G. ANDERSON and G. K. CHAMBERS, 1982 Alcohol dehydro- genase and glycerol-3-phosphate dehydrogenase clines in Dro- sophila melanogaster on three continents. Evolution 36: 86-96. STROBECK, C., 1983 Expected linkage disequilibrium for a neutral
locus linked to a chromosomal arrangement. Genetics 103:
545-555.
1 1 6 153-159.
412-417.
OAKESHOTT, J. G . , J. B. GIBSON, P. R. ANDERSON, W. R. KNIBB, D.
Communicating editor: B. S. WEIR
APPENDIX
In this appendix, a method is outlined for calculat- ing the mean and variance of rFs(k), rss(k) and rFF(k),
which are defined by Equation 5 . It is clear from the definitions, that
E ( m ( K ) ) = E(d,j.(K))
= E
(
m€WkC.
( 1-
a . ( m ) ) )where sequence i is a Slow sequence and sequence j is a Fast sequence, 6 v ( m ) is one if site m is the same in sequence i and sequence j , and zero otherwise, and Wh is the set of sites in the window centered at
k.
T h e expection of s,(m) is the probability of identity of site m in sequence i (a Slow sequence) and sequence j (a Fast sequence), which we will denote by Hm(l, 1). Thus, it follows thatE ( ~ F s ( ~ ) ) =
C.
( 1-
Hm(1, 1)). m€WkSimilarly,
and
where H,(O, 2) is the probability of identity at site m in two Fast sequences and Hm(2, 0) is the probability of identity at site m in two Slow sequences.
If the variation at each site m , is described by a neutral infinite-allele model, then
where Tm is twice the time in units of 2N generations to the common ancestor of a Fast and a Slow sequence at site m , and the expectation is over the distribution of T,,,. Similar expressions exists for H,(O, 2) and Hm(2, 0). In the case of a tightly regulated equilibrium, such as that considered in KAPLAN, DARDEN and HUDSON (1988) these identity coefficients, Hm(l, l), Hm(0, 2) and H42, 0 ) , satisfy the following system of three linear equations analogous to (4):
where
1 282(x)(1
-
x)h * o ( X ) = -
+
fX X
and Pl(x) and &(x) are given by Equation 1 .
T h e variances of rps(k), r ~ s ( k ) and r F F ( k ) are more
calculation of E(rFs(k)*). From the definition of 7 r f S ( k ) ,
+
c#i',lx
d,(k)diy(k)]in which i and i' refer to Fast sequences and
i
andif
By expanding the squared term on the right hand refer to Slow sequences. T h e expectations on the right
side, we get hand side can be expressed in terms of identity coef-
ficients for samples of size two, three, and four for E [(,E.Es d ~ k ) ) l ] = E
[E
d $ ( k ) one or two sites. These identity coefficients satisfyi.3 systems of linear equations such as (4) and can be