• Is this a test procedure that a new produc-tion team member or summer employee without previous experience could run over a couple of days?
• Is there any way that someone could auto-mate the test procedures to get beyond the “subjectivity factor,” especially when the same test needs to be run by different people on different shifts?
A brief history of lab-scale testing
In principle, a conventional handsheet appara-tus(1)ought to be sufficient to study effects of retention and dewatering additives. In practice, however, the flows to which the fibres are sub-jected during the formation of a handsheet are much gentler than those found on production-scale paper machines(2). Previous work has shown that hydrodynamic forces during paper-making can be strong enough to tear mineral particles from fibre surfaces, depending on the types and levels of retention aid treatments(3-6). As a consequence, handsheet tests can grossly overestimate the first-pass retention that can be achieved with a certain treatment. Also, the stock used to form a standard hand-sheet is so highly diluted as to raise doubts about the validity of using retention and drainage results from those tests to make pre-dictions about commercial paper machines. Many of the test procedures to be described in this review can be understood as different attempts to overcome such limitations of hand-sheet testing.
A key milestone in the history of lab-scale retention aid testing occurred in 1973, the year that Britt unveiled his Dynamic Drainage/Retention Jar(7). The “Britt jar” achieved two important goals in retention aid evaluation.
i) First, it broke ground in providing an adjustable and reproducible agitation, some-thing that might represent the net effect of unit operations in the approach flow to a paper machine. Pre-agitation tends to make test results more credible, since hydrodynamic forces can separate cellulosic fines or fillers from fibre surfaces or from other fine particles “You have to run it on the machine to
really find out whether it works.” Those are words you are likely to hear if you are respon-sible for the operation of a paper machine and somebody is suggesting a change in the reten-tion and drainage aid system. But you know, deep down, that if you always followed the train of logic suggested by the speaker, then you would be overwhelmed by trials of new chemical conditions on the paper machine.
The purpose of this article is to consider how paper technologists can use lab tests to increase their options. There has to be a mid-dle ground between “no, we aren’t interested in considering your chemical” and “sure, go ahead, run your chemical on my paper machine at different dosages and addition points until we’re convinced it won’t work or it’s absolutely not cost effective.”
Know Your Goals: Be realistic when selecting lab tests to predict the on-machine performance of retention aids and other chemicals that affect fine-particle retention or the rate of dewatering as paper is being formed. There are some simplifying assump-tions that you can make, and these assumptions may allow you to use a relatively simple and quick test. There are some more sophisticated tests that you can run if you are concerned about making increasingly accu-rate predictions about how different chemical strategies will perform on you paper machine. The “best” lab-based retention and drainage assay may depend on which of the following questions comes closest to your situation: • Is it even worth considering this particular
chemical additive? Is there even a reason-able chance that you will see some benefits – in retention or dewatering – if this additive is used?
• What are the two or three top candidate chemical programmes that would be most likely to achieve our retention and dewa-tering targets without wrecking formation uniformity?
• Will this suggested additive programme stand up to the high levels of shear in your paper machine system?
Predict Effectiveness of Retention
and Drainage Aid Programmes
Carolina State University
This paper compares labo-ratory test procedures which predict the performance of chemicals used to enhance retention or dewatering dur-ing the manufacture of paper. Key points of differ-ence among the various laboratory methods include: • the presence or absence
of fibre mat formation during the test
• the optional application of vacuum
• the presence or absence of pressure or velocity pulsations during dewa-tering
• the use of automation in some test procedures. A well-chosen laboratory test can provide useful infor-mation without incurring the high cost and risks associ-ated with full-scale evaluations of many differ-ent retdiffer-ention and drainage programmes and dosage lev-els. However, it is important to understand the compro-mises inherent in different lab-scale tests to guard against premature rejection of specific chemical pro-gramme options.
Fillers & Pigments for Papermakers,
much water is being tightly held inside the cell walls of fibres. The easiest way to obtain such information involves centrifugation of plugs of damp fibres, the so-called Water Retention Value (WRV) test(43-45). In the past it has been assumed that results of WRVtests were unre-lated to chemical flocculation effects occurring between the fibres and at their surfaces; how-ever, recent results showed a high correlation between changes in WRV measurements and freeness measurements, in response to treat-ment with dewatering aids(46).
Recently it has been shown that the effec-tiveness of different retention aid programmes can be compared by measuring the size or strength of fibre-to-fibre flocs in a treated slurry of fibres(47-58). The measurement princi-ples include light transmission(56-58) and viscometry(47-51,53-56). In interpreting the results of such tests it is important to bear in mind that fibre flocculation, per se, usually is undesir-able. Ideally one would prefer to achieve high retention efficiency and increase dewatering rates without harming the uniformity of sheet formation. However, the fibre floc tests often can be carried out more quickly than a typical retention test.
Decisions in Selecting a Lab Test: Let’s say that you are among the people responsible for the performance of “Paper Machine 1” at a certain mill, and it has been suggested that the performance would be better with a different programme of chemical additives for retention and drainage promotion. Let’s assume that there is a certain reluctance to go ahead with full-scale trials of new chemistry – unless there is a pretty good chance of substantial cost and/or performance benefits. Your customers are happy with the performance of your paper product, and your management team is reluc-tant to make changes.
How, then, do you choose the most appro-priate lab-scale test? As shown in the sections that follow, the overall decision can be broken down into a series of questions.
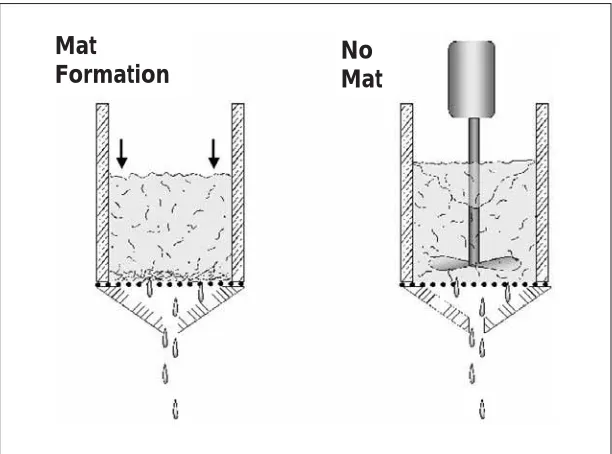
Question 1: Mat or no mat?
As illustrated in figure 1, one of the first con-siderations ought to be whether or not to allow mat formation to occur during the lab proce-dure. The reasons can be subtle. If you are concerned only about the effects of additives on retention efficiency – not drainage rates or any sheet properties – then there is potential to save time and achieve good statistical results with a method that avoids formation of a mat.
Tests with No Mat Formation: As shown in figure 1, formation of a fibre mat, during a retention aid evaluation, can be prevented by continuous agitation. In practice no mat will form as long as the stirring speed is above some minimum value and the flow rate of fil-trate through the screen is kept low. The principle behind such a test is that the full-that have become attached by the action of a
retention aid treatment(8). Ideally, one would like to use a range agitation level that would effectively break chemical-induced attach-ments among the fibres in the slurry, leading to a suitably low level of fibre flocculation during the jar-type test. The minimum intensity of hydrodynamic shear stress needed to detach fibres from each other tends to be much less than that needed to detach fine particles either from each other or from fibre surfaces(5,8-10).
ii) The second area where the Britt jar broke new ground was in evaluating colloidal reten-tion, i.e. retention of fine particles onto fibres, without allowing a fibre mat to form during the test. History has been friendly to the Britt jar, and it remains one of the most widely used tests for screening of retention aids.
Several researchers have championed the idea of testing retention and drainage aids under conditions rather similar to the Britt jar test, but with formation of a fibre mat(11-17). A key benefit of forming a mat is the ability to evaluate rates of dewatering, and differences in these rates resulting from changes in the dosages of chemical additives. Gess(15-17) and others(14,18-28)advocated the use of vacuum dur-ing such tests. In some cases it was found that one could draw conclusions about the effec-tiveness of different retention aid programmes just by looking at how the measured vacuum varied over time(14-17,26).
Unfortunately, procedures that merely form a fibre mat on a screen, either by gravity or by steady application of vacuum, can give mis-leading information. The magnitudes and trends of retention and dewatering perfor-mance predicted by the lab tests often do not match the results of trials carried out at indus-trial scale(21,24,29). For example, simple filtration tests tend to exaggerate the importance of chemicals on drainage rates and retention, especially in cases where the furnish has a high fines content(30).
Deviations of this type are sometimes explained by considering what happens during industrial-scale forming of a paper sheet. Paper machines use such devices as hydrofoils(2,31), table rolls(2), forming blades(32), and vacuum boxes(29). These devices create pulsations of flow or pressure perpendicular to the wet mat as paper is being formed. The “action”(31) cre-ated by such pulsations tends to increase both the dewatering rate and mat uniformity, often at the expense of lower first-pass retention(33-35). Many of the unattached fines, instead of blocking drainage channels in the wet web, are merely washed out of the sheet as it is being formed. In an effort to achieve more realistic predictions, several innovative lab test designs incorporate pulsations of repro-ducible frequency and amplitude(30,36-42).
machine, is placed in a cylindrical plastic jar. In the classic Britt jar test the screen consists of a thin, machine stainless steel sheet, having conical-section holes with a minimum diame-ter (at the top surface) of 76 µm. Subsequent users sometimes have substituted a forming fabric from a paper machine, or a woven stain-less steel screen of a desired mesh size.
Agitation is supplied by an impeller, the position of which needs to be kept constant from test to test in order to achieve repro-ducible results.
The agitation speed is adjustable to what-ever rpm level is selected by the user. The most popular model of the Britt jar, in current use, is fitted with small “baffles” at three locations on the inner wall of the jar(59-60). These baffles partly break up the vortex that forms within the jar, and they also make it possible to use some-what higher agitation speeds.
To carry out a test, the user closes a stop-cock or pinch clamp below the jar, fills the jar with slurry, starts the agitator, adds a selected type and amount of chemical additive(s), waits a chosen period of time, then briefly withdraws a small sample of filtrate. An eyedropper tip, below the stopcock or pinch clamp, restricts the flow of filtrate, minimising the tendency of mat formation. The mass of filterable solids in the filtrate, per unit volume, is taken as an indi-cation of the proportion of the fine particles in the furnish that are not attached to the fibres under the conditions of testing.
There have been many reported studies that follow the essentials of the Britt jar proce-dure(21,24,59,61-64), though not all of them have used the same equipment. For instance, the basic Britt jar procedure even has been carried out using a modified freeness test apparatus(14).
Some key assumptions inherent in the use of the Britt jar test include (a) that it is possible to represent the overall effect of hydrodynamic shear in a real paper machine system by select-ing a suitable agitator speed, (b) that fine-to-fibre attachment is a dominant, or at least very important contributing mechanism responsible for the effect of the retention aid under consideration, and (c) that retention effects in the absence of mat formation will follow the same trends as retention effects in the presence of mat formation.
One recommended approach has been to adjust the agitator speed such that the Britt jar test results yield the same first-pass retention as observed on the paper machine under con-sideration, when the same retention aid system and dosage are applied in each case(65). Another approach has been to adjust the agitator speed to whatever level provides a strong differentia-tion among the different chemical condidifferentia-tions being compared.
In addition to demonstrating different reten-tion capabilities of treatment schemes based on charge neutralisation, charge patches, and length fibres in the slurry are too long to pass
through the openings in the screen.
By definition, the fine particles are small enough to pass through those holes, but not all of them do so. The fraction of the fines passing into the filtrate depends on “colloidal reten-tion”, i.e. the proportion of the fine particles that remain attached to fibres. That fraction is expected to depend on the previous chemical treatments, in addition to any hydrodynamic shear. By far the best-known test of this type is the Dynamic Drainage/Retention Jar(7), or Britt jar.
Essential features of the Britt jar are illus-trated in figure 2. A sample of papermaking furnish, usually having a consistency similar to that of a headbox sample from a paper
Figure 1Illustration of the first question, whether or not to form a fibre mat as part of a test protocol to evaluate retention aid performance.
Figure 2Classic design of Britt’s “Dynamic Drainage/Retention Jar”
“Jar” with fibre slurry
Impeller Stand
Mat
Formation
No
Mat
Beaker Screen
dures that use gravity alone to measure either drainage rates or fines retention through a forming mat of fibres.
Simple Filtration Without Vacuum: Sim-ple is often better. This is especially true when comparing test protocols intended for routine use in the field. The Canadian Standard Free-ness test(75-77) is among the most widely used means of comparing dewatering tendencies of different pulp samples. Though the dilute slurry is agitated before the start of a freeness test, the test itself is carried out in the absence of stirring. The fibre mat that forms during a freeness test tends to filter out cellulosic fines and other fine particles very effectively, yield-ing filtrate that is much clearer than what would be observed on a paper machine running with the same furnish. Also, the mat tends to have high resistance to flow, compared to what might be assumed based on dewatering rates observed on paper machines.
Nevertheless, in the hands of a careful tester, freeness tests can provide quite good reproducibility, with respect to dewatering analysis. Reproducibility of test results is usu-ally considered to be a priority, compared to haw closely a test procedure mimics the condi-tions of hydrodynamic shear found on a paper machine.
Certain modifications of freeness test pro-cedures are especially worth noting by those who may be interested in evaluating retention and drainage chemical programmes. The basic freeness test procedures involve passage of some of the filtrate through a narrow orifice at the base of the apparatus(75). The validity of the results rests upon the assumption that the vis-cosity of the liquid phase does not change, except for a small effect of temperature, which can be corrected. However, it is well known that addition of high-mass polyelectrolytes to aqueous solution will tend to increase the effect of temperature, which can be corrected. However, it is well known that addition of high-mass polyelectrolytes to aqueous solution will tend to increase the effect of viscosity, especially in cases where the fluid must con-verge and pass through a narrow hole(78-91).
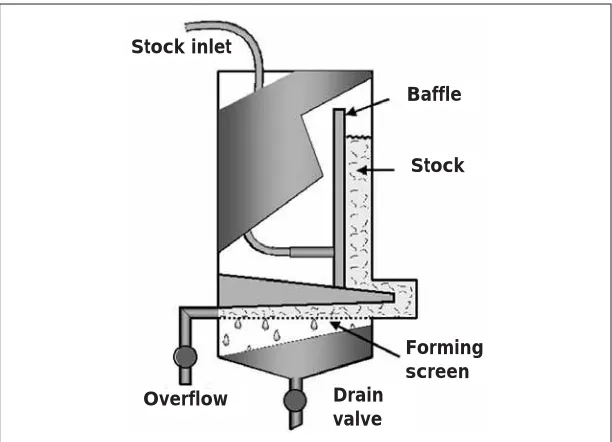
Therefore, for evaluation of retention and drainage chemical treatments it is recommended to use a modified design of freeness apparatus that has only one, relatively large outlet for the flow of filtrate. Rather than measuring the final volume of liquid collected from a side-port(75), results are expressed as either the volume of fil-trate in a pre-selected time or the time required to collect a pre-selected volume. Some excellent mechanistic studies have been carried out by means of such modified freeness tests with auto-matic logging of filtrate mass versus time(80-81). Figure 3, for instance, illustrates the system used by Sampson, which incorporates a flow spreader to separate air and water, giving a more consistent flow to an electronic balance. polymer bridging(66-68), the Britt jar also has
been used to demonstrate the relative reversibility of different treatments(56,61,69-70). In other words, some flocculant systems seem to “recover” after the speed of agitation is increased, and then decreased. In contrast, other retention aid treatments sometimes are broken down irreversibly after exposure to suf-ficiently high rates of agitation. It has been proposed that the chemical programmes lead-ing to higher reversibility tend to be those that also give better overall dewatering rates and good formation uniformity(67).
Build a better mousetrap and the world will attempt to improve upon it. Though most pub-lished work following the essential features of Britt’s procedure(7,59,62-63,65)has been based on the weighing of tared filter paper samples, to determine the consistency of the filtrate (or “white water”), it is possible to save time by measuring the turbidity(19,56,71-73).
Despite the practical advantages of such approaches, the results of optical tests have to be regarded with caution. Though it is possible to establish a calibration curve of turbidity (or other optical measurement) versus consistency, flocculants can be expected to agglomerate the suspended particles, rendering the base-line calibration curve inaccurate. Depending on the purpose of the tests, sometimes such inaccura-cies are ignored.
To provide a more convincing demonstra-tion, it is possible to substitute a forming fabric piece from the paper machine or interest in place of the standard drilled screen(74). Another trick has been to apply a small pressure below the screen, before the start of an experiment, to prevent any premature passage of liquid through the screen(59).
Question 2: Mat formation with or without vacuum?
Tests that involve the formation of a paper sheet make sense in those cases where one wants information about how chemicals affect either dewatering rates or the resulting paper properties. In principle, such tests also have the potential to give realistic information about retention, since a fibre mat has to play a role in filtering some of the fine materials from the process water during formation of a typical paper sheet. We will return later to this issue, since the relative importance of filtration by the fibre mat will depend a lot on both the paper machine situation, and also the selection of a lab method.
Though there is potential to be more realis-tic, one has to be careful when making assumptions about whether sheet-forming con-ditions prevailing during a particular laboratory test adequately represent what is happening on a larger scale.
proce-byproduct of procedures that also result in testable sheets of paper. For the tests to be use-ful it is important that the forming screen be in excellent, clean condition. The gasket of the handsheet device needs to be properly aligned, avoiding leakage of air, which might vary from test to test.
Also, especially when testing low basis weight sheets, the results can be expected to be dominated by the way that the initial fibre align themselves on the screen(89), an effect that can depend on just how the stock was agitated and whether there is any residual swirling motion of the stock when the drain valve is opened.
Some drainage tests have been automated with level sensors(22,28,90-92), and similar methods can be used with handsheet tests. Tanaka et al.(93)carried out an elegant set of experiments, using a handsheet procedure and sheet-split-ting, to show the retention aids tend to make paper more uniform in composition as a func-tion of distance perpendicular to the plane of the sheet.
Those with an eye for detail may have won-dered why Britt called his now-famous device the “Dynamic Drainage/Retention Jar.” Most of the work done by others with that apparatus has been in the presence of agitation. Usually only a relatively small amount of filtrate is col-lected, and the filtrate flow is kept slow. All of these factors tend to prevent the formation of a fibre mat. One has to go back to Britt’s very first report in the series(11)to appreciate that the Britt jar originally was intended to be used in two different ways:
i) Tests with the agitator turned on were intended to emphasise retention effects. ii) Tests with the agitator turned off before dewatering, allowing all of the water to drain under laminar conditions, were intended to emphasise drainage effects. One of the earliest experiments of this type showed a strong effect of salt concentration on retention of TiO2 particles
(11). Subsequent workers have used similar methods(13,59), often substituting a coarser screen to make sure that most of the flow resistance was due to the fibre mat and not the screen.
Disputes about the meaning or validity of the original Britt jar procedure(7) have prompted further useful work. Davison(13) found evidence that a retention aid can produce agglomorates of filler particles that are too large to fit through the holes in the screen of a standard Britt jar. Li and Scott(94)showed that the distribution of clay filler between the fibre surfaces, agglomerates, and as dispersed parti-cles during a Britt jar test was affected by both the conditions of chemical treatment and by hydrodynamic shear.
Finally it is worth mentioning that some automatic pulp quality test devices provide information that is closely analogous to drainage rates, though the results may be Once one has modified the standard
free-ness device with a single, large outlet port, as noted above, then, with a further modification it is possible to evaluate effects of increasing levels of hydrodynamic sheet(82-83). This is done by adding a stopcock at the base of the appara-tus and using a speed-controlled agitator, a setup that resembles the Britt jar setup shown in figure 2.
Most often, the point of running the experi-ment in a modified freeness apparatus, rather than with a Britt jar, is to be able to compare the results with routine freeness test results(75-77). The same kind of experiment can also be achieved by agitating the furnish samples in a separate container, then quickly transferring the material to a freeness test device immedi-ately before drainage evaluation.
Speaking of simple, one of the most elegant ways to evaluate dewatering effects of chemi-cal additives is to use a “drainage tube”(84-86). The tube consists of a clear PMMA cylinder, one end of which is bonded to a piece of form-ing fabric or a standard screen. The user covers one end and inverts the tube a specific number of times – two or more – before allowing the furnish to drain. Usually one measures the time required for the level of stock in the tube to reach a pre-selected mark.
The drainage tube can be an excellent choice if either (a) you don’t have access to a suitable freeness test device, or (b) you want to carry something that is extremely portable and durable. In one case it was reported that a drainage tube was more sensitive to the addi-tion of a drainage aid, compared to a freeness test(85).
Laboratory handsheet procedures also have been used to compare dewatering rates(84,87-88). The advantage of this kind of approach is that drainage times often can be recorded as a
Figure 3Modified Schopper-Riegler freeness tester with single, large outlet and continuous recording of filtrate mass
Screen
Balance Spreader cone
Sealing cone
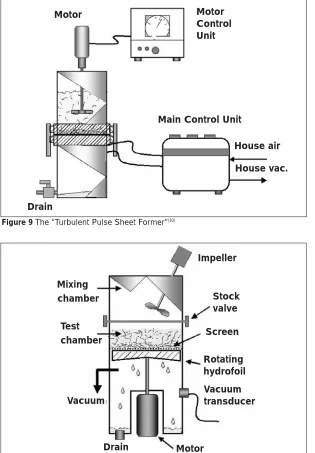
Retention and Drainage Tester(20), the Dynamic Drainage Analyser(14,25-26), the dynamic Filtra-tion System(14), the Retention Process Analyser(72,97), and the Gess/Weyerhauser (G/W) system(15-17). Figure 4 shows the essen-tial features of the G/W device.
Few investigators have considered the ques-tion about whether the presence or absence of vacuum assistance affects the main conclu-sions and trends observed with simple filtration tests(90). Ideally, the application of vacuum ought merely to speed up the test. In practice, however, one needs to be aware that the stronger hydrostatic and hydrodynamic forces in a vacuum-assisted test are likely to do such things as compress the fibres, wash fine particles out of the sheet in some locations, and possibly cause premature “sealing” of the forming fabric with an initial layer of fibres draped over and into its openings(90-91). High correlations have been reported between some vacuum-assisted test results and results of free-ness tests(15).
Most(14-18,20-22,24-26,28,91), but not all(27), vacuum-assisted dewatering tests end up with air being drawn through the sheet. As shown by Britt and Unbehend(21), a flocculated sheet tends to allow relatively easy passage for air to pass through, resulting in less effective dewatering. It is important to apply a sufficient amount of agitation to break up such flocs, and ideally one would want to break up the flocs to the same degree as would happen on the full-scale paper machine under consideration.
Most of the reported work with this kind of method involves a variable or standardised agi-tation, either as part of the device itself(21-23,25-26,28,98)or done separately in a beaker just before the dewatering test(18,19).
Vacuum-Time Curves: As noted by Gess, one can learn a lot about a given papermaking furnish sample just by observing how the mea-sured vacuum changes with time during a vacuum-assisted dewatering test(15). Results of such measurements depend on the pumping capacities and recovery rates of the vacuum systems employed(14). For instance, a constant volumetric rate of pumping has been used in the G/W procedure(17). Figure 5 illustrates the kind of data that has been obtained with the Dynamic Drainage Analyser(25-26).
Referring to figure 5, the sharp drop in vac-uum, starting at time equal to zero, is associated with the initial rapid flow of white water through the forming fabric, i.e. free drainage through the screen. It seems likely that point “A” on the curve is related to the point where the fabric effectively has become covered with a layer of fibres. The rise in vac-uum, going from point “A” to point “B” appears to coincide with build-up of the fibre mat. Point “B” appears to be associated with the “dry line”, just before breakthrough of air. The vacuum at the right-hand limit of the curve expressed as “permeability”(95). The advantage
of using such equipment is that the results can be automatically interpreted in terms of an equivalent hydrodynamic specific surface area, based on a simplifying model of resistance to flow through a uniform packed bed(96).
Simple Filtration with Vacuum Applied: Anyone who has watched the change in appearance of a paper web on a Fourdrinier paper machine as it passes over vacuum boxes will appreciate the importance of vacuum to promote the release of water. There is a whole list of test procedures that basically do the same thing – dewater a sample of pre-agitated papermaking furnish over a forming screen, using vacuum to pull filtrate through the screen(14-28,91).
Names of apparatus that have been coined to describe such experiments and equipment include the Water Release Analyser(1,23-24), the
Figure 4Apparatus to evaluate dewatering rates and retention in the presence of vacuum
Sample
Screen Vacuum
pump
Vacuum transducer
Valve and drain
Figure 5Interpretation of vacuum-time output from a DDA test(25-26)
Dry line (air breaks through)
0
0
C
A B
Time
V
acuum
Final vacuum value related to porosity Screen
is just covered by fibres
faster or slower than the fabric speed at the point of impact.
One of the effects of such speed differences is to cause a preferred orientation of fibres in the sheet, usually aligned preferentially with the direction of manufacture. Though such effects usually are associated with efforts to improve the uniformity of paper, it is also worth considering some lab-scale tests that involve oriented flow.
Figure 6 illustrates a design concept of a handsheet device that has been called the “Minidrinier”, to emphasise the fact that the sheets have characteristics related to those from a Fourdrinier paper machine(85,100). The version shown in figure 5 is the M/K Sheet Former. From the standpoint of evaluation of additives, the Minidrinier concept has the advantage that the stock consistency tends to be much closer to industrial practice, compared to a conventional handsheet forming proce-dure. First-pass retention data obtained with this device was lower, and closer to industrial practice, compared to straightforward filtration tests(85,100).
Despite these potential advantages, rela-tively little has been published with respect to this method. Those who are interested in high-quality paper samples with a controllable (by trial and error) degree of fibre orientation should also consider the use of a dynamic sheet former that uses a centrifugal forming princi-ple(101).
One of the most intriguing recent studies of retention and dewatering involves the use of a truncated cone to apply a nearly uniform aver-age shear stress over the surface of a forming fabric during formation of a sheet(92,102). The key parts of this apparatus are shown schematically in figure 7. Remarkably, a certain moderate stirring action was found to increase, rather than decrease the resistance to flow through the mat of fibres that formed on the screen – even in the presence of flow. Similar observations were reported by Forsberg and Bengtsson(25).
A likely explanation for these effects is that the flow tends to align the fibres so that they can form a dense mat, not unlike well-combed, wet hair. By contrast, non-aligned fibres are expected to form a more bulky, porous mat. One complication that resulted from continued stirring during mat formation was the tendency for non-uniform mat thickness as a function of distance from the axis of the stirring device(92,102).
Question 3: Whether to apply pulsations During the industrial-scale production of paper the continuous mat of fibres (or “wet web”) passes over a series of dewatering devices, which may include hydrofoils, blades, and brief applications of vacuum. Such devices give rise to pulsations of both vacuum and pressure(2,29,31-32).
Figure 6Essential parts of an M/K sheet former, achieving some fibre orientation, and using higher consistency than conventional handsheets.
Figure 7Use of rotating cone to provide near-uniform average shear stress at forming fabric surface during sheet formation(92)
Stock inlet
Overflow
Baffle
Stock
Forming screen Drain
valve
Motor
Fibre slurry
Truncated
10ºcone
Forming screen
Filtrate receptacle and vacuum
(point “C”) can be used as a measure of the air-permeability of the damp sheet.
These principles have been used to predict how various additives affect such things as the position of the dry line on a paper machine(14,26). At the other extreme, relative to the tests just mentioned, is the concept of keeping the applied vacuum nearly constant throughout the dewatering experiment(90-91). Wildfong et al. continuously monitored the level of stock, at its upper surface, by means of a triangulation method with a laser beam(91).
The pulsations also result in rippling motions at the surface of a Fourdrinier sheet, a phenomenon that has become known as “action on the table”(31,34). Though it is usually much easier to form a sheet of paper in the lab-oratory without attempting to reproduce such effects, it might be argued that generation of “action” has the potential to make a lab test more realistic.
In principle, pressure or velocity pulsations perpendicular to the plane of the wet web of paper are expected to decrease retention by “washing” fine particles out of the sheet. Pul-sations also are expected to make the paper slightly more uniform in the plane of the sheet by loosening up some of the fibre flocs. Figure 8 illustrates the principle of using pulsating flow during a suitable laboratory test.
Figure 9 shows one of the best-known portable systems for evaluation of retention and dewatering in the presence of pressure pul-sations(30). This “Turbulent Pulse Former” employs vacuum regulators, valves, and timing adjustments to superimpose a series of pulses during drainage of the sheet. The design also allows for the jar to be quickly dissembled, making it possible to weigh the damp sheet. The moisture content after vacuum application sometimes is used to predict trends of moisture after the couch on a paper machine.
The type of device shown in figure 9 can produce a well-defined frequency of pulsation. Because the turbulent pulse sheet former design can yield a high quality sheet of paper the method has been used for the evaluation of starch products for dry-strength, as well as for retention effects(103), and also for evaluation of sizing agent systems(104).
One might argue that, if you want to mimic the effects of a hydrofoil, then you ought to go ahead and use one. The apparatus illustrated in figure 10 does just that(38-40). The “Pulsed Drainage Device”, a patented design, has been used within Betz-Dearborn and now Hercules for evaluation of their products in the field.
A suspension of stock is treated under con-tinuous agitation in an upper chamber. At a signal from a computer, a pneumatically acti-vated stock valve – an inverted stopper with a conical top – is opened, allowing the sample to fill a lower chamber. Though rotation of the foil device under the forming fabric at the base of the lower chamber is continuous, the vac-uum can “kick in” after an adjustable delay, allowing the user to draw conclusions about the gravity drainage rate vs. the vacuum response.
Various adjustments in design have made it possible to increase the accuracy with which the test results match what is seen later when the same chemical programmes and dosages are tried out at a commercial scale(40). These improvements included an increase in the con-sistency (and reduced volume) of the slurry Figure 8The absence or presence of velocity or pressure pulsations during
form-ing is expected to affect the way the fibre mat is formed.
Figure 10Pulsed Drainage Device(38-40)
Figure 9The “Turbulent Pulse Sheet Former”(30) Filtration
Mode
Pulsation (thickening) Mode
vs. time
Velocity
Motor Control Unit Motor
Drain
Main Control Unit
House air
House vac.
Impeller
Stock valve
Screen
Rotating hydrofoil
Vacuum transducer Mixing
Test chamber
Vacuum
Drain Motor
ing on the basis weight and other properties of the wet paper mat(41).
The results also were consistent with a model in which the fibres nearest to the form-ing fabric can act as a kind of “pump”, helpform-ing to dewater the rest of the paper as it goes through cycles of compression and release(29,41). This “pumping” action also helps to explain the absence of filler particles in the part of the sheet adjacent to the fabric, as shown by sheet-splitting experiments.
The “High Speed Retention Tester”, unveiled in 2000(105-106), combines some of the essential features of the moving belt tester, but the belt is replaced by a series of parallel hydrofoils.
A key deficiency of the “pulsation” devices described up to this point in this review is that one does not know the average velocity of flow through the forming screen as a function of time. In the case of valve-actuated puffs of vac-uum it takes an undefined length of time for pressure beneath the forming fabric to come to equilibrium. Nobody has attempted to make a detailed prediction of pressure or velocity fluc-tuations resulting from the hydrofoils or moving belt motions.
The most elegant effort to overcome the challenge of precisely defining the average velocities associated with pulsating flow in a lab-scale retention test was reported by Pers-son and Osterberg(36), whose publication actually predates other developments men-tioned in this review, with the exception of handsheet and freeness tests. Essential features of their apparatus are shown in figure 12. A pneumatic control system was used to drive a hydraulic piston, controlling the flow through a screen. The resulting pressure pulses were evaluated with a transducer. Pulse frequencies could be adjusted up to 100 Hz. It is worth not-ing that this is one of only a very few publications in which retention or drainage were tested with a continuous water column (no air) below the forming screen(36,107).
Question 4: What can one learn from water retention?
There is a long history behind the use of cen-trifugal dewatering tests to determine the relative amounts of water held within swollen pulp fibres(43-45). As shown in figure 13, the test is carried out by placing a sample of wet pulp in a centrifuge tube insert that has a fitted glass filter at its base. The tubes are accelerated at 900 g’s(43-44)or 3000 g’s(108)for 30 minutes. The wet mass of the fibre plug is determined after centrifugation and again after oven-drying. The Water Retention Value (WRV) is usually expressed as the mass of water, divided by the mass of solids.
Usually it has been assumed that WRVtests mainly show effects due to water held in tiny slit-like pores within the cell walls. In particu-samples, use of a coarser forming fabric, and
application of a moderate vacuum as soon as the sample dropped down into the lower com-partment.
The “peak to equilibrium vacuum level” ratio was found to be a useful parameter when comparing the relative effectiveness of differ-ent treatmdiffer-ents. Useful results were obtained at basis weight values of about 45 g/m2or higher, and much of the work with the device has been in the development of paperboard grades.
The device illustrated in figure 11, the “Moving Belt Drainage Tester”, was designed especially to mimic some of the effects of vac-uum boxes on a paper machine(41-42). The moving belt, running continuously under a sta-tionary forming fabric, is covered with holes that momentarily allow vacuum to reach dif-ferent areas under the forming fabric. The duration of pulses can be approximately 2 mS or longer.
By means of this test the inventors showed that there can be an optimum condition of both frequency and amplitude of vacuum pulses to achieve the most effective dewatering,
depend-Figure 11Moving Best Drainage Tester(41-42) schematic diagram
Figure 12Pulsating flow drainage test device with hydraulic piston
Fibre slurry
Forming screen
Belt with
holes
Vacuum
Water
Fibre slurry
Hydraulic piston
Forming
screen
in the regions between fibres during WRVtests was proposed earlier by Abson and Gilbert and by Maloney et al.(109-110).
In summary, one can view the WRVtest as a way to estimate the maximum amount of water that can be removed from a certain furnish before the wet web leaves the press section of a paper machine.
There has been a debate, over the years, on whether it is better to use the centrifugal test just described, or rather to carry out “fibre sat-uration point” measurements based on the inability of very high mass sugar molecules to enter small pores within the cell walls of fibres(111). Points raised in the previous para-graph help add ammunition to the argument that WRVis not always a true or accurate mea-sure of cell wall water.
However, other questions have been raised regarding the meaning of solute exclusions tests(112), since the main work in this area did not take into account osmotic pressure effects and excluded volumes of solution very close to surfaces, regions having a low probability of being occupied by polymer segments in the absence of molecular attractions(113). Further work is needed in this area.
Question 5: Can fibre-flocculation tests be used to evaluate retention aid programmes? In addition to promoting retention of fine par-ticles(68), and speeding up dewatering(114-116), addition of chemical flocculants to papermak-ing furnish usually makes the resultpapermak-ing paper less uniform due to increased fibre floccula-tion(33,117). Though fibre flocculation, per se, is not usually considered to be a desirable effect, it sometimes can be used as an indicator of the relative effectiveness of retention aid treat-ments.
Figure 14 illustrates an innovative test pro-cedure developed in Japan and recently introduced into the US for lab-scale testing(53-54). The “Flocky Tester” senses the resistance to rotation of a specially shaped rotor in the pres-ence of a fibre slurry. The signal becomes higher after the stock is treated with a floccu-lating agent. The effect appears to be due to friction caused by fibre flocs being pressed between the rotor and the walls of the cylindri-cal beaker. The maximum torque can be compared to either the control – untreated fibre slurry – or to the final torque after a specified duration of shearing. The rate of decay of the resistance can be interpreted as an indication of the durability of the extra degree of floccula-tion induced by the chemical treatment. Because the tests are quick, this test has been proposed for field evaluations of flocculating chemicals(54).
One of the potential drawbacks of the pre-viously described test is that it gradually destroys the fibre flocs as it senses their pres-ence. Recently Hubbe(56) demonstrated a related test procedure that was designed to lar, it has been assumed that “external water” is
mostly removed by centrifugation(45). Recent results reported by Ström and Kunnas(46)make it necessary to question that assumption, espe-cially if the WRVtest is used to assess affects of drainage-aid chemicals(27). Contrary to some theories, these researchers found that the abil-ity of a highly charged cationic polymer to decrease the WRV increased with increasing molecular mass.
To explain these results it was proposed that the drainage aid mainly acts by precipitating microfibrils flat onto the fibre surface, and that the WRVcontribution due to water within fine pores probably is less affected by the polymer treatment. The possibility of water being held
Figure 13Centrifuge tube insert, as used in Water Retention Value (WRV) tests(43)
Figure 14Floccky Tester to evaluate effects of additives on strength and persis-tence of fibre flocs(54).
Centrifuge tube
Filter insert
Damp plug of fibres
Sintered glass
Absorbent felt
Motor & load cell
Rotor, top view
Slurry sample
Another approach to quantifying fibre floc-culation involves monitoring light transmission or reflection as dilute stock flows through a transparent tube or past a window in a channel. One of the easiest ways to achieve such measurements is to use a flow scheme as illustrated in figure 16, which is based on the use of a Photometric Dispersion Analyser (PDA)(56). To study papermaking fibres it is nec-essary to use a “low-gain” version of the PDA, with a fitting to accommodate a larger-than-usual tubing size, having an internal diameter of about 6 mm(56-58).
The addition of a chemical flocculant to a dilute fibre slurry – paper machine headbox solids level or lower – has been found to greatly increase the root-mean-squared varia-tion in intensity of the transmitted light through the clear tubing. Though such results clearly indicate changes in the degree of fibre floccu-lation, more work is needed to understand how the signals depend on either the size or the den-sity of fibre flocs(57-58).
More sophisticated studies, using the scat-tering of laser light, have achieved more success in separately determining the effects of various treatments on floc size and on different degrees of flocculation, in cases where the floc sizes were similar(119).
Some of the most sophisticated evaluations of retention aids recently have been carried out by means of a “Focused Beam Laser Reflec-tant Measurement” (FBLRM or SLM) method(47-52). This method works by estimating the “cord lengths” of objects that pass in front of a sapphire window.
The device rotates a focused beam of laser light in a circular pattern and detects the lengths of time over which some of the reflected light either does or does not return to the window after being reflected from objects in the path of the light. Because the light fol-lows a circular path at a known rate of speed, it is straightforward to convert time periods of continuous reflected signal to equivalent linear lengths, i.e. cords of the circular path. FBLRM measurements have been used, for instance, to compare the effectiveness of different microparticle retention aid programmes(48).
Question 6: Can automation help eliminate operator bias and achieve more reliable retention and drainage test results?
Though automation certainly will affect the amount of effort required to run a lab evalua-tion of retenevalua-tion and drainage chemicals, the important goal should be reproducibility, i.e. the precision of the results. This is especially important if one needs to rely on results obtained by different staff members. Experi-ence has shown that results of jar-type retention and drainage tests can be sensitive to subtle differences in mixing practices, the time intervals between chemical injections, and minimise disruption of the flocs. As shown in
figure 15, pencil-like probes were slowly rotated through the fibre slurry samples. Resis-tance to the motion of the probes was detected with a digital viscometer. Treatment of the slurry with flocculating agents appeared to increase the size of fibre floc able to remain on the front surface of a probe element without coming apart.
The viscometric test made it possible to dis-tinguish the separate contributions of time and hydrodynamic shear in breaking down fibre flocs(56,118). Such results find use in helping to justify decisions about whether to add reten-tion aids before or after pressure screens(118).
Figure 15Viscometric test of effects of chemicals on fibre flocculation in a pulp slurry(56).
Figure 16Fibre floc evaluation by means of a low-gain Photometric Dispersion Analyser(56).
Rotation
Spindle No. 1
Probe
Baffle
Sample
Photodetector
Pump Light
dewatering effects, it is recommended to first consider the classic Britt jar test(7). The equipment can be ordered from Paper Research Materials(60). Alternatively, simi-lar tests can be carried out with fairly straightforward modifications of freeness tests or with a homemade drainage jar. 3) In cases where one is most interested in
obtaining highly reproducible dewatering rate evaluations, following treatment with different chemical recipes, it is recom-mended to consider the Dynamic Drainage Analyser (DDA), which also is currently available(122). The DDAoffers advantages of automation. However, for short-term, low-budget needs, one should be aware that similar information could be achieved with various related devices, some of them essentially homemade, as described earlier. If you facility has either freeness testing equipment or handsheet forming equip-ment available for your use, such devices can be used possibly with some modifica-tions, for evaluation of dewatering rates under simple filtration conditions. 4) None of the pulsation type of test
appara-tus described in this review is currently available for sale as a portable test. It is recommended that only serious
researchers, willing to devote considerable development time, attempt to go down this road. Although pulsations can, in principle, make tests more representative of what happens during industrial-scale formation of paper, there is also a danger of increas-ing the noise-to-signal ratio.
5) Water retention value (WRV) tests offer a way to obtain supplemental information, requiring very little sample and fairly con-ventional centrifugation equipment. Assuming, as noted earlier, that the WRV results predict the maximum solids that can be achieved by mechanical means, there may be situations where such infor-mation could help in deciding between which of two alternative chemical pro-grammes to evaluate first.
6) Depending on what kind of information you are looking for, it is recommended to view fibre-flocculation-sensing tests with caution. It is important to bear in mind that a chemical programme that produces a high degree of fibre flocculation is not nec-essarily the most desirable programme for increasing retention efficiency or dewater-ing rates in a given paper machine situation. But as long as those cautions are well understood, then either the Floccky Tester(54)or the FBRLM(47-52)test equipment can be obtained. Also, the non-destructive floc test described earlier can be carried out with a conventional Brookfield vis-cometer and a simple modification of one of the standard probes(56).
anything that one does at the moment when water starts to flow through the forming fabric or screen(89).
Issues related to portability and cost are expected to become less important with the passage of time, especially in systems that can be run with a laptop computer.
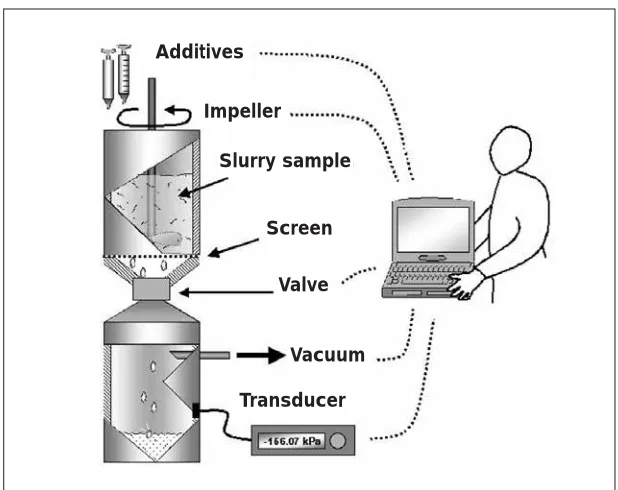
Though automation could, in principle, be applied to just about any of the tests described in this review, and some have been(90), let us focus on one example. As shown in figure 17 the Dynamic Drainage Analyser(14,25-26), which was discussed earlier, incorporates automatic control of such things as chemical additions, stock agitation, opening of the value to start drainage, and acquisition of dewatering rate data. As had been pointed out(25), it is often dif-ficult to add chemicals quickly enough in manual tests to fairly mimic what happens on a real paper machine. Highly precise repetition of experimental conditions is also essential when one wants to distinguish subtle differ-ences between paper sheets that result from different levels of chemical treatment.
Conclusions and recommendations: 1) Though only a few of the test devices
described in this review are currently avail-able for sale(7,25,120-121), many of them are simple enough to be reproduced in a machine shop or the essential features can be assembled from conventional laboratory equipment, such as a Büchner funnel. Since different kinds of tests have different strengths and weaknesses, it is best to start out by deciding which type of test is most suitable for obtaining the information that you need.
2) For quick, relatively reproducible compar-isons of retention effects, not considering
Figure 17Automatic features of the Dynamic Drainage Analyser (DDA)(14,25-26). Additives
Impeller
Slurry sample
Screen
Valve
Vacuum
Literature Cited
1. Anon., “Forming Handsheets for Physical Tests of Pulp,” Tappi Test Methods T 205, Tappi Press, Atlanta.
2. Tam Doo, P.A., Kerekes, R.J., and Pelton, R.H., “Estimates of Maximum Hydrody-namic Shear Stresses on Fibre Surfaces in Papermaking,” J. Pulp Paper Sci. 10(7):J80-J88 (1984).
3. Pelton, R.H. and Allen, L.H., “Factors Influ-encing the Adhesion of Polystyrene Spheres Attached to Pyrex by Polyethyleneimine in Aqueous Solution,” J. Colloid Interface Sci. 99(2): 387-398 (1984).
4. Hubbe, M.A., “Detachment of Colloidal Hydrous Oxide Spheres from Flat Solids Exposed to Flow. 4 Effect of Polyelec-trolytes,” Colloids Surf. 25 (2-4): 325-339 (1987).
5. Hubbe, M.A., “Retention and Hydrodynamic Shear,” Tappi J. 69 (8): 116-117 (1986). 6. Goto, S. and Pelton, R., “The Link between
Strength and Shear Sensitivity for Filler Flocs Formed with Retention Aids,” Tappi J. 83 (4): 82 (2000). [One page only in print version.]
7. Britt, K.W., “Mechanisms of Retention Dur-ing Paper Formation,” Tappi 56 (10): 46-50 (1973).
8. King, C.A. and Williams, D.G., “Cellulose Fibre-to-Fibre and Fines-to-Fibre floccula-tion: A Dynamic Comparison,” Tappi 58 (9):138-141 (1975).
9. McKenzie, A.W., “Structure and Properties of Paper. XVIII. The Retention of Wet-End Additives,” Appita 1 (4): 104-116 (1968). 10. Hubbe, M.A., “Detachment of Colloidal
Hydrous Oxide Spheres from Flat Solids Exposed to Flow. 2. Mechanism of Release,” Colloids Surf. 16(3-4):249-270 (1985). 11. Britt, K.W., “Retention of Additives During
Sheet Formation,” Tappi 56 (3):83-86 (1973). 12. Nelson, J.A. and Simons, P.B., “Retention
and Drainage Studies Usig the ESPRI Dynamic Jar,” ESPRA Invited Papers Sprint 1978 Mtg. (Mobile, AL):51-56 (April 3-5, 1978).
13. Davison, R.W., “Mechanism of Fine-Particle Retention in Paper,” Tappi J. 66 (11): 69-72 (1983).
14. Roschy, A., Fisher, K. and Kleeman, S., “Comparison of Modern Wet-End Methods of Determination of Drainage and Retention at a Laboratory Scale,” Wochenbl. Papierfabr. 130 (18):1187-1196 (2002).
15. Gess, J.M., “A New Drainage Analysis Sys-tem,” Tappi J. 67 (3):70-72 (1984). 16. Gess, J.M., “Method of Measuring Drainage
Rate,” U.S. Pat. 4,613,406, Sept. 23, 1986; priority April 4, 1983.
17. Trepanier, R., “The B/W Drainage – Reten-tion Tester,” Tappi J. 75 (5):139-142 (1992). 18. Arno, J.N., Frankle, W.E. and Sheridan, J.L.,
“Zeta Potential and its Application to Filler Retention,” Tappi 57 (12):97-100 (1974). 19. Moore, E.E., “Charge Relationship of Dual
Polymer Retention Aids,” Tappi 59 (6):120-122 (1976).
20. Abson, D., Bailey, R.M., Lenderman, C.D., Nelson, J.A. and Simons, P.B., “Predicting the Performance of Shear-Sensitive Addi-tives,” Tappi 63 (6):55-58 (1980). 21. Britt, K.W. and Unbehend, J.E., “Water
Removal During Sheet Formation,” Tappi 63 (4):67-70 (1980).
22. Wegner, T.H., Springer, A.M. and Chan-drasekaran, S., “Single Procedure for Measuring Drainage, Retention, and Response to Vacuum of Pulp Slurries,” Tappi
43. Anon., “Water Retention Value (WRV),” Tappi Useful Method UM 256, 1981. 44. Thode, E.F., Bergomi, J.G. and Unson, R.E.,
“The Application of a Centrifugal Water-Retention Test to Pulp Evaluation,” Tappi 43 (5):505-512 (1960).
45. Jayme, G. and Büttel, H., “Regarding the Determination and Meaning of Water Reten-tion Value (WRV) of Various bleached and Unbleached Cellulosic Pulps,” Wochenbl. Papierfabr. 96 (6):180-187 (1968). 46. Ström, G. and Kunnas, A., “The Effect of
Cationic Polymers on the Water Retention Value of Various Pulps,” Nordic Pulp Paper Res. J. 6 (1):12-19 (1991).
47. Alfano, J.C., Carter, P.W. and Gerli, A., “Characterisation of the Flocculation Dynam-ics in a Papermaking System by
Non-Imaging Reflectance Scanning Laser Microscopy (SLM),” Nordic Pulp Paper Res. J. 13 (2):159-165 (1998).
48. Alfano, J.C., Carter, P.W. and Whitten, J.E., “Use of Scanning Laser Microscopy to Investigate Microparticle Flocculation Perfor-mance,” J. Pulp Paper Sci. 25 (6):189-200 (1999).
49. Clémonçon, I. and Geri, A., “The Effect of Flocculant/Microparticle Retention Pro-grammes on Floc Properties,” Nordic Pulp Paper Res. J. 14 (1):23-29 (1999). 50. Gerli, A., Keiser, B. and Strand, M., “Use of
a Flocculation Sensor as a Predictive Tool for Paper Machine Retention Programme Perfor-mance,” Tappi J. 83 (10:59 (2000). 51. Gerli, A., Keiser, B. and Surya, P.I., “Use of
Focused Beam Reflectance Measurement in the Development of a New Nanosize Parti-cle,” Appita J. 54 (1):36-40 (2001). 52. Blanco, A., Fuente, E., Negro, C., Mente,
M.C. and Tijero, J., “Focused Beam Reflec-tant Measurement as a Tool to Measure Flocculation,” Tappi J. 1 (10):14-20 (2002). 53. Laleg, M. and Collins, R., “A Novel Method
of Monitoring the Flocculation Caused by chemical Additives,” Preprints of PAPTAC Annual Meeting, Montreal, Jan. 2001, p. C169.
54. Anker, L., “Practical Experiences in Additive Screening using a Torque-Based Flocculation Analyser,” Tappi J. 1 (6):3-8 (2002). 55. Swerin, A., “Rheological Properties of
Cellu-losic Fibre Suspensions Flocculated by Cationic Polyacrylamides,” Colloids Surf. 133 (3):279-294 (1998).
56. Hubbe, M.A., “Reversibility of Polymer-Induced Fibre Flocculation by Shear. 1. Experimental Methods,” Nordic Pulp Paper Res. J. 15 (5):545-553 (2000).
57. Burgess, M.S., Curley, J.E., Wiseman, N. and Xiao, H., “On-line Optical Determination of Floc Size. Part I: Principles and Techniques,” J. Pulp Paper Sci. 28 (2):63-65 (2002). 58. Burgess, M.S., Curley, J.E., Wiseman, N. and
Xiao, H., “On-line Optical Determination of Floc Size. Part II: The Effect of Shear on Floc Size,” J. Pulp Paper Sci. 28 (10):323-326 (2002).
59. Nelson, J.A., “Retention Aid Performance. Effects of Process Variables,” Tappi 61 (11): 108-110 (1978).
60. For information about obtaining Britt jar equipment, see the website of Paper Research Materials at http://www.brittjar.com 61. Unbehend, J.E., “Mechanisms of ‘Soft’ and
‘Hard’ Floc Formation in Dynamic Retention Measurement,” Tappi 59 (10):74-77 (1976). 62. Unbehend, J.E., “The ‘Dynamic Retention/
Drainage Jar’, Increasing the Credibility of Retention Measurements,” Tappi 60 (7):110-112 (1977).
J. 67 (4):124-126 (1984).
23. Scalfarotto, R.E. and Tarvin, R.F., “Effi-ciency of Polymeric Additives in Drainage and Dewatering,” Tappi J. 67 (4):80-84 (1984).
24. Britt, K.W. and Unbehend, J.E., “Water Removal During Formation,” Tappi 68 (4):104-107 (1985).
25. Forsberg, S. and Bengtsson, M., “The Dynamic Drainage Analyser (DDA),” Proc. Tappi 1990 Papermakers Conf., 239-245 (1990).
26. Forsberg, S. and Ström, G., “The Effect of Contact Time between Cationic Polymers and Furnish on Retention and Drainage,” J. Pulp Paper Sci. 20 (3):J71-J76 (1994). 27. Liu, J., “Cationic Polyacrylamide as a
Drainage Aid in Mechanical Pulp,” Tappi J. 78 (4):149-154 (1995).
28. Mantar, E., Co, A. and Genco, J.M., “Drainage Characteristics of Pulp Slurries under Dynamic Conditions,” J. Pulp Paper Sci 21 (2):J44-J50 (1995).
29. Räisänen, K., “High-Vacuum Dewatering on a Paper Machine Wire Section – A Literature Review,” Paperi Puu 78 (3):113-120 (1996). 30. Britt, K.W., Unbehend, J.E. and Shridharan,
R., “Observations on Water Removal in Papermaking,” Tappi J. 69 (7):76-79 (1986). 31. Kiviranta, A. and Paulapuro, H., “The Role
of Fourdrinier Table Activity in the Manufac-ture of Various Paper and Board Grades,” Tappi J. 75 (4):172-185 (1992). 32. Green, S.I. and Kerekes, R.J., “Numerical
Analysis of Pressure Pulses Induced by Blades in Gap Formers,” Tappi J. 81 (4):180-187 (1998).
33. Jokinen, O., and Palonen, H., “Interdepen-dence of Retention and Formation in the Manufacture of SC Paper,” Paperi Puu 68 (11):801-808 (1986).
34. Manson, D.W., “The Practical Aspects of Formation,” Wet End Operations Short Course Notes, Tappi, Atlanta, 1996. 35. Sodergren, O.F. and Neun, J.A.,
“Develop-ments in Activity Generation on Fourdriniers,” Tappi J. 83 (10):62 (2000). 36. Persson, T. and Osterberg, L., “A Laboratory
Apparatus for Pulsed Drainage,” Svensk Pap-perstidning 72 (8):446-452 (1969).
37. Davison, R.W., “A New Vacuum Pulsation Drainage Procedure for Determining Fine Particle Retention,” Tappi J. 7 (8):121-127 (1989).
38. Lin, J.T. and Schuster, M.A., “Predicting Drainage, Retention and Formation Develop-ment on High Ash Alkaline Paper
Machines,” Proc. Tappi 1992 Papermakers Conf., 253 (1992).
39. Lin, J.T., Schuster, M.A. and Schellhamer, A.J., “Apparatus for Simulating Processing Parameters and Predicting Variables in a Papermaking Operation Including Sequential Pulsation, Gravity and Vacuum Drainage, Fines Retention and Paper Formation,” U.S. Pat. 5,314,581, May 24, 1994.
40. Suttman, F.J., “Development and Validation of an Improved Drainage Testing Methodol-ogy,” Tappi J. 83 (4): 69-70 [digital version] (2000).
41. Räisänen, K., Paulapuro, H. and Karrila, S.J., “The Effects of Retention Aids, Drainage Conditions, and Pretreatment of Slurry on High-Vacuum Dewatering: A Laboratory Study,” Tappi J. 78 (4):140-147 (1995). 42. Räisänen, K, Karrila, S. and Maijala, A.,
83. Beck, U. and Müller, F., “Optimisation of Drainage and Sheet Formation – Laboratory Tests and Practical Results,” Wochbl. Papier-fabr. 107 (11/12): 411-418 (1979). 84. Ulrick, J.M. and Fisher, B.D., “Factors
Affecting the Use of Chemical Drainage Aids,” Tappi 59 (10):78-81 (1976). 85. Gunder, W. and Melzer, J., “The Evaluation
of Retention Aids in Laboratory and Prac-tice,” Papier 33 (10A): V95-V100 (1979). 86. Wei, H. and Ramarao, B.V.,
“Characterisa-tion of Pulp Slurries Using a Novel Drainage Tester,” Proc. Tappi 1996 Engineering Conf., 517-524 (1996).
87. Brill, H.C. and Hecklau, F.L., “Titanium Dioxide Retention,” Tappi 43 (4): 229A-237A (1960).
88. Heath, H.D. and Hofreiter, B.T., “Filler-Retention and Dry-Strength Additives,” Tappi 61 (12): 21-23 (1978).
89. Kufferath, W., “Dewatering Process on the Paper Machine. Part 4,” Deut. Papierwirt. 1983 (1):63-64, 66, 68-70, 73-76 (1983). 90. Pires, E.C., Springer, A.M. and Kumar, V.,
“A New Technique for Specific Filtration Resistance Measurement,” Tappi J. 72 (7): 149-154 (1989).
91. Wildfong, V.J., Genco, J.M., Shands, J.A. and Bousfield, D.W., “Filtration Mechanics of Sheet Forming. Part 1. Apparatus for Determination of Constant-Pressure Filtration Resistance,” J. Pulp Paper Sci. 26 (7):250-254 (2000).
92. Paradis, M.A., Genco, J.M., Bousfield, D.W.., Hassler, J.C. and Wildfong, V., “Determination of Drainage Resistance Coef-ficients under Known Shear Rate,” Tappi J. 1 (6):12-18 (2002).
93. Tanaka, H., Luner, P., and Côté, W., “How Retention Aids Change the Distribution of Filler in Paper,” Tappi 65 (4): 95-99 (1982). 94. Li, H.M. and Scott, W.E., “The use of Britt
Jar Retention-RPM Curves and Microscopic Analysis to Determine the Aggregation State of a Papermaking Furnish,” Proc. Tappi 2000 Papermakers Conf., 733 (2000).
95. Anon., “Pulp Quality System,” brochure from Pulmac, Box 50, HCR 34, Montpelier, VT 05602, (800) 829-9280; 802-223-3480 (rec’d. 1994).
96. Ingmanson, W.L., “An Investigation of the Mechanism of Water Removal from Pulp Slurries,” Tappi 35 (10):439-448 (1952). 97. Cheng, Z., Saharinen, E. and Paulapuro, H.,
“Laboratory Device (RPA) for Characterising the Influence of Shear Forces on Retention, Part Two: Influence of High Shear Pulse,” Proc. Tappi 1993 Papermakers Conf., 15 (1993).
98. Krogerus, B., “Impact of Retention Polymers on Flocculation, Retention, Drainage and Sheet Formation. A Laboratory Study,” Proc. Tappi 1994 Papermakers Conf., 445-452 (1994).
99. Wildfong, V.J., Genco, J.M., Shands, J.A. and Bousfield, D.W., “Filtration Mechanics of Sheet Forming. Part II: Influence of Fine Material and Compression,” J. Pulp Paper Sci. 26 (8):280-283 (2000).
100.Werdouschegg, F., M.K., “Interrelating a Practical Retention Testing Procedure with Wet End Retention Results – Theory and Practice,” Tappi 60 (7):105-109 (1977). 101.Website information for dynamic sheet
form-ers: http://www.canpa.ca/ADS_page.html; http://cybermetrics.com/dsf_dynamic_sheet_f ormer.htm;
http://www.labtech.ca/eng/pulp.htm 63. Avery, L.P., “Evaluation of Retention Aids.
The Quantitative Alum Analysis of a Paper-making Furnish and the Effect of Alum on Retention,” Tappi 62 (2):43-46 (1979). 64. Pelton, RlH., Allen, L.H. and Nugent, H.M.,
“Survey or Potential Retention Aids for Newsprint Manufacture,” Pulp Paper Can. 81 (1):T9-T15 (1980).
65. Britt, K.W. and Unbehend, J.E., “New Meth-ods for Monitoring Retention,” Tappi 59 (2):67-70 (1976).
66. Hubbe, M.A., “How do Retention Aids Work?” Proc. Tappi 1988 Papermakers Conf., 389-398 (1988).
67. Lindström, T., “Some Fundamental Chemical Aspects on Paper forming,” in Fundamentals of Papermaking, Vol. 1, Barker C.F. and Pun-ton, V.W., eds., Mechanical Eng. Pub. Ltd., London, 311-412 (1989).
68. Horn, D. and Linhart, F., “Retention Aids,” in Paper Chemistry, J.C. Roberts, ed., blackie, Glasgow, UK, Ch. 4, 44-62 (1991). 69. Hedborg, F. and Lindström, T., “Some
Aspects on the Reversibility of Flocculation of Paper Stocks,” Nordic Pulp Paper Res. J. 11 (4):254-259 (1996).
70. Hubbe, M.A., “Reversibility of Polymer-Induced Fibre Flocculation by Shear. 2. Multi-Component Chemical Treatments,” Nordic Pulp Paper Res. J. 16 (4):369-375 (2000).
71. Milliken, J.O., Spectrophotometric Determi-nation of Fines Retention Using the Dynamic Retention/Drainage Jar,” Seattle Retention and Drainage Short Course, 1977, pp. 55-57. 72. Saharinen, E., Cheng, Z. and Paulapuro, H.,
“Laboratory Device For the Characterisation of the Influence of Shear Forces on Reten-tion,” Wochenbl. Papierfabr. 122 (16):638-643 (1994).
73. Ovenden, C., Xiao, H. and Wiseman, N., “Retention Aid Systems of Cationic Microparticles and Anionic Polymer: Experi-ments and Pilot Machine Trials,” Tappi 83 (3):80-85 (2000).
74. Pelton, R.H., Allen, L.H. and Nugent, H.M., “Novel Dual-Polymer Retention Aids for Newsprint and Groundwood Specialties,” Tappi 64 (11):89-92 (1981).
75. Anon., “Freeness of Pulp (Canadian Standard Method),” Tappi Method T227-om-94. 76. Kerekes, R.J. and Harvey, D.M., “Tappi
Fluid Mechanics Committee Drainage Tester Survey,” Tappi 63 (5):89-91 (1980). 77. Tanaka, H., “Effect of Polymerisation Degree
and Charge Density of Cationic Polyacry-lamide on Drainage and Retention,” Japan tappi 62 (7):614-624 (1992).
78. Binding, D.M. and Walters, K., “On the Use of Flow through a Contraction in Extimating the Extensional Viscosity of Mobile Polymer Solutions,” J. Non-Newtonian Fluid 30 (2-3):233-250 (1988).
79. Ferguson, J., Walters, K. and Wolff, C., “Shear and Extensional Flow of Polyacry-lamide Solutions,” Rheol. Acta 29 (6): 571-579 (1990).
80. Sampson, W.W. and Kropholler, H.W., “Batch-drainage Curves for Pulp Characteri-sation Part 1: Experimental,” Tappi J. 78 (12):145-151 (1995).
81. Sampson, W.W., “The Independence of Sheet Structure and Drainage,” Paper Technol. 38 (8):45-50 (1997).
82. Müller, F. and Beck, U., “Dual Product Sys-tems for Retention and Dewatering in the Paper Industry,” Papier 32 (10A):V25-V31 (1978).
102.Arslan, K., Bousfield, D.W. and Genco, J.M., “Effect of Shear Forces on Fine Particle Retention,” Tappi J. 80 (1):254-261 (1997). 103.Sweger, R.W., “Novel Drainage Analysis of Chemical Additives in Systems with Increas-ing Mill Closure,” Proc. Tappi 1996 Papermakers Conf., 59 (1996).
104.Staib, R.R., “Evaluation of Paper Sizes using a Turbulent-Pulse Sheet Former,” Tappi J. 74 (10):102-105 (1991).
105.Sivén, S. and Manner, H., “Influence of Drainage Pressure Variation on Retention,” Paper Coating Chem. Symp. [digital ver-sions] 2000.
106.Sivén, S. and Manner, H., “Multicomponent Retention Systems in Twin Wire Forming,” Appita J. 54 (6):523-535 (2001).
107.Jaycock, M.J. and Pearson, J.L., “Effect of pH on the Retention of Inorganic Fillers,” J. Appl. Chem. Biotechnol. 25 (7):815-826 (1975).
108.SCAN Test Method, SCAN-C 10 XE. 109.Abson, D. and Gilbert, R.D., “Observations
on Water Retention Values,” Tappi 63 (9):146-147 (1980).
110. Maloney, T.C., Laine, J.E. and Paulapuro, H., “Comments on the Measurement of Cell Wall Water,” Tappi J. 82 (9): 125-127 (1999). 111. Scallan, A.M. and Carles, J.E., “The
Correla-tion of the Water RetenCorrela-tion Value with the Fibre Saturation Point,” Svensk Papperstidn. 75 (7):699-703 (1972).
112. Alince, B., Van de Ven, T.G.M., “Porosity of Swollen Pulp Fibers Evaluated by Polymer Adsorption,” in Barker, C.F., Ed., The Funda-mentals of Papermaking Materials, Vol. 2, Pira, Leatherhead, UK, 1997, p. 771. 113. Flory, P.J., “Principles of Polymer
Chem-istry,” Cornell Univ. Press, Ithaca, 1953. 114. Allen, L.H. and Yaraskavitch, I.M., “Effects
of Retention and Drainage Aids on Paper Machine Drainage: A Review,” Tappi J. 74 (7): 79-84 (1991).
115. McGregor, C. and Knight, P., “Utilising Process Chemicals to Improve Water Removal,” Paper Technol. 37 (8):31-37 (1996).
116. Farinato, R.S., Huang, S.-Y. and Hawkins, P., “Polyelectrolyte-Assisted Dewatering,” in Colloid-Polymer Interactions: from Funda-mentals to Practice, Farinato, R.W. and Dubin, P.L., Eds., Ch. 1, 3-51, Wiley-Inter-science, New York, 1999.
117. Linhart, F., Horn, D., Eisenlauer, J. and Hemel, R., “Monitoring and Control of For-mation by Means of a Fibre Optic Flocculation Senor,” Wochenbl. Papierfabr. 115 (8):331-338 (1987).
118. Hubbe, M.A. and Wang, F., “Where to Add Retention Aid: Issues of Time and Shear,” Tappi J. 1 (1):28-33 (2002).
119. Wågberg, L., “A Device for Measuring the Kinetics of Flocculation following Polymer Addition in Turbulent Fibre Suspensions,” Svensk Papperstidn. 88 (6):R48-R56 (1985). 120.Distributed by Koei,
http://www.uskoei.com/othrprod2.htm; and Cybermetrics,
httpaaaa;//cyber-metrics.com/floccky_flocculation_tester.htm 121.Distributed by Lasentech,
http://www.lasen-tech.com