Seismic Proving Test of a Reinforced Concrete Containment Vessel (RCCV)
Part-5 Simulation Analysis of the Safety Margin Test
Youichi Sasaki 1), Kiyoshi Hattori 1), Masataka Nakajima 2), Toshio Kobayashi 3), Atsushi Suzuki 4)
1) N u c l e a r P o w e r E n g i n e e r i n g C o r p o r a t i o n , J a p a n 2) Toshiba Corporation, Japan
3) Kajima Technical Research Institute, Japan 4) Kajima Corporation, Japan
A B S T R A C T
Seismic proving tests for a reinforced concrete containment vessel (RCCV) were carried out by Nuclear Power Engineering Corporation (NUPEC) with an 1/8 scale model using the large-scale, high perforrnance shaking table of Tadotsu Engineering Laboratory during 1998 to 1999. These tests consist of proving tests and margin tests. Proving tests were carried out to confirm the structural integrity and functional soundness of RCCVs for S1 and $2 levels. Meanwhile, margin tests were performed to measure Seismic margin. On the proving test, summary, test results and simulation analysis results have been already reported in 15 th SMiRT. In the previous part-4, summary of the margin tests is presented and the test results are discussed. In this report, simulation analysis results are compared to the test results and discussed. Moreover, safety margins were estimated by the analysis.
1. I N T R O D U C T I O N
Since 1980, NUPEC has conducted a series of seismic proving tests of nuclear power plant facilities. As one of the seismic proving tests, shaking table tests for RCCV were carried out using the Tadotsu Engineering Laboratory and the results were reported in the previous papers [1 ][2][3]. The objectives of this test were to measure the structural integrity and functional soundness of RCCV's for both S1 and $2 excitations, and to establish the safety margin by ultimately collapsing the specimen with extreme shaking to estimate an excessive earthquake. To achieve the objectives, seismic proving test and seismic margin test were performed.
In the previous paper, summary of the safety margin test results is reported [4]. In tiffs paper, dynamic simulation analysis results of the seismic margin test are shown and discussed to understand the response characteristics of the RCCV model under the excessive earthquake excitation. Estimation of the safety margins was also performed by simulation analysis up to the collapse of the model during the final excitation.
The analysis is similar to that used in the practical seismic design of commercial nuclear power plant. This analysis method was basically same as that used in the simulation-analysis of the seismic proving test, which was reported in 15 th SMiRT. Measured horizontal and rotational accelerations at the top of the base mat slab were used simultaneously as input motion for the analysis because pitching motion of the specimen were observed during the excitations.
2. S I M U L A T I O N ANALYSIS OF S E I S M I C M A R G I N TEST 2.1 ANALYSIS C O N D I T I O N
(1) Analysis Method
The margin tests were carried out for the representative input levels 2"$2, 3"$2, 4"$2, 5"$2 and 9"$2 in series and the specimen reached to fracture in 9"$2, as shown in the previous part-4. Dynamic simulation analyses using a lumped mass model were performed to investigate the dynamic behavior of the specimen during each excitation. The simulation analyses were can-ied out by nonlinear time history dynamic response analysis based on the numerical integration of the dynamic equations of motion using Newmark's 13-method.
(2) Mathematical Model
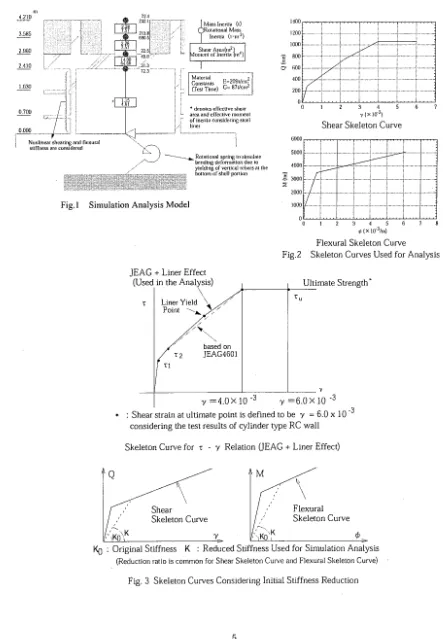
One stick model with multiple mass points was used with a fixed condition at the top of the base mat, as illustrated in Figure 1. Each mass point is connected with stick element which has shear and flexural stiffness. Both shear and flexural stiffnesses are evaluated considering material properties of concrete, reinforcement bars and liner which were based on material test results. The nonlinearity was taken into account for the elements of the shell potion. Rotational spring connecting the lowest part of the shell element and the top of the base mat, was adopted to simulate bending deformation due to yielding of vertical rebars of shell wall slipping out of the base mat.
SMiRT 16, Washington DC, August 2001 Paper # 1165
(3) Restoring Force Characteristics of Nonlinear Element
Nonlinear characteristics of shell portion stiffness were defined from 'their shear force (1:) - shear strain (1,) relationship (shear skeleton curve) and bending moment (M) - c u r v a t u r e relationship (flexural skeleton curve). Each skeleton curve was evaluated based on JEAG 460115] which is used in the practical seismic design of commercial nuclear power plant. Effects of the liner were also considered in the evaluation. In such a situation that the shear strain exceeded the maximum shear strain ('/3=40001a), shear force was regarded, as keeping the maximum value ('t3) as illustrated in Figure 2.
The initial stiffness of each skeleton curve was evaluated as that of the shell wall without damage by excitation at all. However, the seismic margin test was conducted after the seismic proving test, in which the large excitations with the input $2 were performed and concrete potion of shell wall had damage a little. The margin test was also conducted through some steps in series with the stiffness of the model decreasing from step to step. Considering this situation, initial stiffness of each simulation analysis was set to that derived from the corresponding test results. The same reduction factor was applied for both shear and flexural stiffness. General concept of the skeleton curves used in the analysis considering initial stiffness reduction is shown in Figure 3.
For hysteresis loops of shear force shear strain relationship, the INADA model [6] was used which takes into account structural damping and slip effects at small shear stresses. The concept of INADA model is shown in Figure 4 and parameters used in the analysisare shown in Table 1. For those of bending moment and curvature relationships, tri-linear loop with stiffness degrading during the maximum curvature exceeding ~2 was applied, which is used in the current design procedure.
Rotational spring connecting the lowest part of the shell element and the top of the base mat was evaluated as bending moment and rotational deformation angle relationship, based on the test results. The spring characteristics applied for the analysis is shown in Figure 5.
(4) Damping
Damping values obtained from test results were used in the analysis. These damping values consist of viscous damping, structural damping and plastic deformation damping effects. Viscous damping was assumed to be internal and in proportion to the initial stiffness. Structural damping was given by a parameter of the INADA model, while plastic deformation damping effects came from the skeleton curves and hysteresis loops automatically.
(5) Input motion
The excitations were performed with control of actuators so as to input horizontal motion at the top of the base mat. Actually, pitching motion at the top of the base mat was observed during each excitation. Therefore, measured horizontal and rotational accelerations at the top of the base mat slab were used simultaneously as input motion for the analysis.
(6) Analysis case . . .
The nonlinear simulation analyses were performed for 2"$2, 3"$2, 4"$2, 5"$2 and 9"$2, correspondent to the actual excitation cases. To evaluate the initial stiffness and damping values, frequency transfer functions were obtained and compared to those from the test results before starting.each time history nonlinear simulation analysis.
2.2 ANALYSIS RESULTS
(1) Frequency transfer functions
Frequency transfer functions were obtained and compared to those obtained from test results as shown in Figure 6. The peak frequencies and the peak heights of the frequency transfer functions showed good agreement with those of test results. Thus, we conclude the estimation of the initial stiffness and the damping factor applied to the analysis model at each analysis case was valid.
(2) Time history nonlinear analysis results
Response acceleration time history at the upper slab obtained by the analysis is compared to that of test results for 5"$2 excitation in Figure 6. This comparison shows good agreement between the analysis results and test results during relatively high level excitation period fiom the beginning of the excitation to around 15 second. However, the response acceleration by the analysis tends to be larger than that of test after around 20 second.
(3) Hysteresis loops
those of test results. In this figure, hysteresis loop shapes, the maximum shear forces and the m a x i m u m deformations are shown good agreement with those of test results for both 5"$2 and 9"$2 excitations. Even for the final excitation the specimen reached fracture by large acceleration input, the analysis model gave a reasonable result.
As for bending moment and curvature relationship, which are shown in the same figure, the maximum bending moments and maximum curvatures obtained by the analysis correspond to those of test results. However, hysteresis loop shape is not shown well agreement with those of test results.
(4) Maximum response values
Table 2 shows the maximum response values by the representative excitation analysis comparing those of test results. In the table, values in brackets are ratios of analysis results to the test results. These results show a good agreement between the analysis results and the test results.
The analysis method considering the stiffness reduction depending on several times of excitation and the rotational spring depending on the yielding of the vertical reinforcing bars at the bottom of the shell portion, could simulate such test results with strong non-linear behavior by large acceleration input exceeding $2 greatly. It was also concluded that this analysis model is possible to be applied to the seismic margin evaluation in which reasonable estimation of maximum deformation of the upper slab is needed at the moment when the RCCV model reaches to fracture.
3. E V A L U A T I O N O F S A F E T Y M A R G I N
Analytical safety margins of the model at the fracture were evaluated by using the same model as the simulation analysis. The safety margins were estimated as multiple number of $2.
3.1 E V A L U A T I O N M E T H O D
Time history nonlinear analysis of the model was carried out using the same analytical model and analysis method as the simulation analysis. The analyses were performed by increasing acceleration amplitude of input motion as multiple number of $2. The safety margin was estimated as the value of multiple number of the input motion by which the model was judged to be reached to fracture in the analysis. Basically, we judged the fracture in the analysis when the deflection angle at the upper slab R reached the fracture criteria Re which was obtained from the test results (Re=14.7*10 -3 rad ). As another fracture criteria, shear deformation angle at the upper slab, 3' was used (7e=9.3"10 -3) as well. The 3'e was also obtained from the test results.
For restoring force characteristics of the shell portion of the analysis model; the same skeleton curves and the same hysteresis loops as those of the simulation analysis model are used. However, initial stiffness values were particularly set for the safety margin analysis. The rotation spring connection between the bottom of the shell mad the top of the base mat
was also considered. ' . . . . . . . . . . . .
2 cases of analysis were performed as described below;
Case l : The case that the RCCV model reaches to fracture by several times of excitations (the same way as those of the excitations of this test).
Case2 : The case that the R C C V model reaches to fracture by an excitation.
In the analysfs of Casel, it was thought that the R C C V model would reach to fracture during the 9 " $ 2 excitation, the initial stiffness of the analysis model was determined as a value before the 9"$2 excitation. Multiple number of the motion observed at the top of the base mat during 5"$2 was input to the analysis model. The analysis was done by input of horizontal acceleration time history and rotational angle acceleration time history, simultaneously.
In the analysis of Case2, it was thought that the R C C V model would have no damage, therefore, the stiffness of the specimen was set as the initial value. Horizontal motion of multiple $2 was input at the top o f t h e base mat, supposed that compensation for target motion at the top of the base mat would be achieved perfectly and the vertical motion derived from pitching motion would not be observed.
3.2 E V A L U A T I O N R E S U L T S
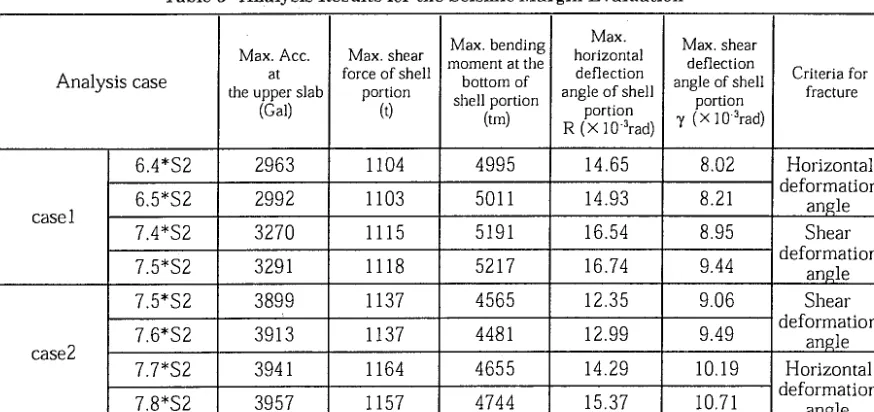
Table 3 shows the analysis results obtained by the analysis of both Case 1 and Case 2. In the table, maximum response values by several analyses with different levels of input motions are shown. These levels of input motions were expected to make the shell portion of the RCCV model reached around fracture.
smaller than the fracture criteria 14.7"10 3 rad. However, by input of 6.5"$2, R reached larger value, R=14.93"10 3 rad. Therefore, tlle RCCV model was thought to be collapsed during the 6.5"$2 excitation, analytically.
For the Case 2, the case the RCCV model would be collapsed in an excitation, even by input of 7.7"$2, the maximum horizontal deformation angle R was smaller than the fracture limit. By input of 7.8"$2, R increased 15.37"$2 which is larger than the fracture ctiteria. Therefore, the RCCV was thought to be collapsed during the 7.8"$2 excitation for the Case 2.
Considering the shear deformation angle T obtained from the displacement between upper slab and the base mat, as the fracture criteria, excitation of 7.5"$2 input made T exceeded the limit value 9.3"10 .3 rad for the Casel. For the Case 2, excitation of 7.6"$2 input made T exceeded the fracture criteria.
By the analysis results above mentioned, for the Case 1 which is considered several times of excitation, the seismic margin of about 6.4 times of $2 was estimated. For the Case 2, which is considered an excitation, the seismic margin of 7.7 times of $2. These results are correspondent to the seismic margins of both 6.6"$2 estimated by the input energy evaluation and 8.1"$2 estimated by the accumulative energy input evaluation, as described in the Part-4.
4. CONCLUSIONS
Dynamic simulation analysis of the seismic margin test are performed and discussed to understand the response characteristics of the RCCV model during the excessive earthquake excitation. The safety margins of the RCCV model was also evaluated analytically by nonlinear simulation analysis up to the collapse of the model.
(1) In such cases that large acceleration motion which exceeds $2 greatly is input into the RCCV model, the behavior of the RCCV model can be well simulated up to the fracture level by nonlinear time history analysis using lumped mass model considering liner effect and slip stiffness effect established by NUPEC.
(2) The seismic margin of the RCCV model estimated by nonlinear simulation analysis was about 7.7 times of $2. This result was correspondent to the seismic margin estimated by the test results.
A C K N O W L E D G M E N T
Since 1980, NUPEC has conducted a series of seismic proving tests of nuclear power plant facilities under the sponsorship of Ministry of Economy, Trade and Industry (METI) of Japan. The seismic proving test of RCCV was carried out as one of the seismic proving tests. The authors would like to acknowledge the advice of the steering committee of NUPEC.
REFERENCES
1. Nakamura, S., Sasaki, Y. Horibe, K.,' Nakajima, M., Hoshino, K., Takahashi, T., Hasegawa, T., Kei, T., Mieda, T., Takiguchi, K., Akiyama, H., "Plan of the seismic proving test for reinforced concrete containment vessel. Test plan and test model design", Transactions of the 14 th International Conference on Structural Mechanics in Reactor Technology (SMiRT 14), Session K04, Lyon, France, August, 1997.
2. Hattori, K., Tateno, S., Shiba, K., Kei, T. and Akiyama, H., "Seismic Proving Test of a Reinforced Concrete Containment Vessel (RCCV) Part-2. Results of Shaking Table Tests", Transactions of the 15 th International Conference on Structural Mechanics in Reactor Technology (SMiRT 15), Session K08, Seoul, Korea, August, 1999. 3. Sasaki, Y., Tsurumaki, S., Tateno, S., Kobayashi, T. and Nakajima, M., "Seismic Proving Test of a Reinforced Concrete
Containment Vessel (RCCV) Part-3. Simulation Analysis of Shaking Table Test", Transactions of the 154 International Conference on Structural Mechanics in Reactor Technology (SMiRT15), Session K08, Seoul, Korea, August, 1999.
4. Sasaki, Y., Hattori, K., Goto, M., Hasegawa, T., Shiba, K., Hirama, T., and Tanaka, R., "Seismic Proving Test of a Reinforced; Concrete Containment Vessel (RCCV) Part-4. Results of Shaking Table Tests up to Ultimate Strength", Transactions of the 16 th International Conference on Structural Mechanics in Reactor Technology (SMiRT 16), Session H, Washington D.C., U.S.A., August, 2001.
5. Technical Guidelines tbr Aseismic Design of Nuclear Power Plants, Transaction of Japan Electric Association Guidelines, 4601-1987, NUREG/CR-6241
Ill
4.210 72.4
::::::::::::::::::::::::::: ... :.:v:.:--v:-:,:- . ~ 2321 :""~:"--'"": ... "-~:"
!: ... ~: ; .... :::i i .... i:~i.:! v v 8 " [!~::il/:.i!Cii::i:: ~T. [ M a s s l n e r t i a (I) . ::/:!i!ii:ii!i:.!i~ii::i 7:~7 -13 8 li:iiiiiii!!/'i(ii:iiiiiii /-'i!i:! ( ~ , R o l a l i o n a l Mass
3.585 i!i//,ii:/!~-i:::iiiii!iii:~ ...i!i!!i!!i~i:::-i:.i;il;ii:!i:i @ ~9osi:~!~i~!i::i!~:!:::::,ii~}:iii:j/ ii:-:il T l.ertJ. (,.,.b
i:i:!i!i!::i;;::iiii~:::iii!!/-:!;:i;i::i;i:i::i:i::i 1 2 ~ a I I;;i~;~;:;:;::i:-:.i;;ii[ !:!i:, ~
2..q60 i:::::i:;::i:::i~:ii~i:i~ii:i] ;: :i : ! !i:: !: ii:i I 7,~! [ 22 5[ii::i:i!i iiiii:i!i:il;i:i ii:;: [ Shear Area(,n 2) 4
i ~ : ~ > " ":':'~::::~:~':'-:'~-'!~'-49"0..~...-/- :,.~;~:~':" "' ~4 oment, ol" ] n e r l i a (m') I
2.4~o ) - : / . ... :~gi:/i:~ ... !....!~!..! ~1.3 ... I
. . . ...-! ! I ~ 72.3 ) )
: " ! ; o E=209t/cn"
1.630 I ~,-~ m !/! C nstanls '2
" ,--l! . 3.~ I )i
/ii 1 4.61 ] ~)
/ ( ~ i i * denoles effective shear
o7oo .... : ... f .... I --: I i L.. area and effective moment
... - r .... 1-~ i ! ['" o f i n e r l i . . . j d c r i n g steel
/ i! m / i l i n e r
0.0o0 ~ ... ~ i ~ . } ~ L ... i
Nonlinear shearing and flexural "\
I
stiffness ldered
\ ~ ' - - ~ ' ) \ ~ Rolali . . . . l spring Io simulate
/"~-~; bending d e f o r m a l l o n due to
/ ' / yielding of vertical rebars at the
~)i)ii~i)!jii))i~)i)!ii~ii)!)i))~i)iii)))i~)i~j~)i)~i)ii)~j)~i)~ii~j)i))))i)!j)~i~! b o l l o m o f shell portion
Fig.l Simulation Analysis Model
1400 . . . ,
1200 ...
~" 800 o
°~ ~OO,
oo ~:.iiiiii.iiiiiiiiiiii.iiiiiiiiii.i.iiiiii.iii'.
200 ... ~ ... , ...
0 0
i i I I j . . . . ! . . .
1 2 3 4 5
3' ( x l 0 3 )
Shear Skeleton Curve
6 7
6000 . . . . i ' ' " . . . i . . . . ! . . . . J . . . . ! . . .
s°°°I
... ...
! ...
...
t ...
J
,000 ... ~ i ...
!
~000
... i ... t ... i ... i ... i ... ~ ...0
::i':i:: i::i:i::
0 1 2 3 4 5 6 7 8 ( X 1 0 3 / m )
Flexural Skeleton Curve Fig.2 Skeleton Curves Used for Analysis
JEAG +
L i n e r E f f e c t(Used in the Analysis) L
\ ~ ..7
z Liner Yield \ J r Zu
Point "~--~ o~.-f&/
. / ~ . . . .
. . / "--..
~ / ~ based on
/ r2 JEAG4601 "el
31
~ / = 4 . 0 x 10 -3 31 = 6 . 0 X 10 -3
• • Shear strain at ultimate point is defined to be 3I = 6.0 x 1 0 -3
considering the test results of cylinder type R C wall
Ultimate Strength*
Skeleton Curve for z - 3/ Relation (JEAG + Liner Effect)
Q
Mal
/
S~oae~o~
Cu~e
l~
~k~o~o~ Cu~voK 0 " Original Stiffness K • Reduced Stiffness Used for Simulation Analysis
(Reduction ratio is common for Shear Skeleton Curve and Flexural Skeleton Curve)
f
Variation of Hysteresis loop shape depended on structural damping
L/
/
o%
Small -- Small Loop AreaVariation of Hysteresis loop shape depended on slip stiffness ratio
\
Large --
Large Loop A r e a . ~
Slip Stiffness Ratio Accompanied Structural Damping
<
Slip Stiffness Ratio k,,, Parameter
Loop Area is Constant
Slip Stiffness Ratio Accompanied Structural Damping
>
Slip Stiffness Ratio
Parameter . ~
4.0
3.0!
2.0
1.0
0.0
... i ... ... i
/
I
!
i . . . .
0.0 1.0 2.0 3.0 4.0
0 (* 10 -4 rad)
Fig.5 Rotational Spring between the bottom
of the shell and the top of the base mat, based on yielding o f vertical rebars at the bottom of shell
Fig.4 Variation of Hysteresis loop shape
denended on the I N A D A model narameters
Tablel
[ I:-7 relation
heq
0.03
Structural Damping
Parameters o f INADA Model used in the Analysis
I
M-,
Slip Stiffness
Ratio
II
~1 ~2 ~3
aeq defined by tri-linear depending maximum ;hear strain experienced
heq = 0 (1'=0)
heq = 0.03 (Y>TI)
mq is linearly incorporated between the points
1.00 --"
0.65 ,
,
1,1 R= 1.00 (3,1>3,>0) R= 0.65 (7>71)
relation
heq
i
0.03 I ...
, .
4) 1
heq defined by tri-linear depending maximum shear strain experienced
-heq = 0 (~=0)
-heq=0.03 (¢>¢1)
heq is linearly incoqmrated between the points
Analysi,,
Test
Table 2 Comparison of transfer functions between Analysis and Test
5 X S 2 ( H ) 9 X S 2 ( H )
~" -180 'o-Io 2 'o 30 40 ; 50 0-1z) ~ Q
~, 20 i I !' ~ '
! : , n=~.4Hz
i ! !h:~:0~
° , ° ~ i
,, 00 ~0 20 ~0 .40 ~0 ~"~ is° l t I I ' "r'~'~
°h"~! ...."---+--I
~o L~t&t ~ . ' : : I ~ - Q
" 0 I0 . 20 30 40 50 (Hz~ 20 I I I I
' ' ' fl =5.4Hz
= ; o - - 4 . . . . i. . . !----4 . . . .
- ~ ' i ' : " "
0 I0 20 30 40 50 d-iz~
"~'"°/ .... /
.~ o~:-M-::---i ....
i... 1
~. i ', ~ _
' , fI:.I.OHz ', ,
m ---~-- ' i
0 0 I0 20 30 40 50 (Hz)
"~ Iso I ~ ', ~ "~ ', r.-r~ ,, : ',
~ ~ to 20 :~o 4o 3c,'~
1~ 20 I i I I
, , , fl=4.gHz
,o- --i---i .... i .... ~ ....
' l Hz 00 10 20 30 .10 50 ~ )
Fig.6
~-, 4000
" ~ 2 0 0 0
0 .,,-i o ID -2000 O < -4OOO
4 0 0 0
, ~ 2000
.o
*-' 0
ID o o -2000 O <
-4000
A n a l y s i s r e s u l t
! I I I
::::::::::::::::i ):i::::::::: ... i ... :: ...
... ll~ i ... i ... i ... ....
~,~ , II i,
l
l llli~,,
iii~,,"
' ~ . . . .... :
0 5 10 15 20 25 30
T i m e (see)
T e s t r e s u l t
I I I I
' i i i i
0 5 10 15 20 25 30
T i m e (see)
Acceleration time history at the Upper Slab by 5'$2
Acceleration time histmaj between Analysis and Test
Table 3 Compm'ison of hysteresis loops between Analysis and Test
Analysis
x 2(H)
T e s t
Analysis
x 2(H)
T e s t
Q-R (Shear force-ldeflection)
120 I i i
60
-12 t t
0 0.01 0.02
-0.02 -0.01 R (.rad)
12u~['~" i I i i i I /
-~, 60
-60
-1200 t t
-0.02 -0.01 R ~rad) O.01 0.02
12 t i
,¢77
... 6 / ~ , ~ -
f
O' .60( 1
- 12(10 t
-0.02 -0.01 R (r0ad) 0.01 0.02
1 2 0 0 ~
°°°I .V,~ 1
0 0.01 0.02
-0.02 -0.01 R (rad)
Q-7
(Shear force-Shear deflection)
1207 I
CY -60f[
-12(10
-0.01 -0.f*)5 0 0.fX)5 0.01 7 (rad)
,2!
-60(.
-1
-0.01 -0.005 )' t Orad ) 0.005 0.01
12(:
~_6c
-12( I
0.01 0.02 -0.(12 -(I.(11 0
). (rad)
Q-Rb (Shear force- flexural angle)
120 I I
- 60 ~] -
Y
£ O' .60f l
- 1200 I
-0.01 -0.005 Rb0rad)0.005,. 0.01
-60
-1201 I
-0.01 -0,005 RbOrad)0.005( 0.01
1201 i 1 r
-60
- 120~ t I
-0.02 -0.01 Rbqrad) 0.01 0.02
M-~
(Bending moment- curvature)
4
-'4
I I I
-8 10 "5-4 10 "5 0 4 10 -5 8 10 -5
(llcm)
4
/
._.2
°
/
-4
, I
-1 10"4-5 10 -5 0 5 10 -5 1 110 4 (1/cm)
I -1 10"4-5 10 .5 0 5 1(1"51 110"4
( l/oral
12C I i
_,~ 60 /
-6(
-12( t I
-0.02 -0.01 (rOad) 0J)l 0.02 7
"°1
~'
6o
-60([
- 1200 I
-0.02 -0.01 0 0.01 0.02
Rb (tad)
i i i i
4
-4
i I
Table 4 Comparison of maximum response values between analysis and test
Case
2 X S2 (H)
3 X S2 (H)
4 X S2 (H)
5 X S2 (H)
9 X S2 (H) .2
Analysis Test Analysis Test Analysis Max. Acc. at the upper slab (Gal) Test 1622 (0.81) 2007 2928 (1.10) 2654 2816 (0.99) Max. shear force of shell portion (t) 631 (0.89) 710 1079 (1.18) 914 1060 (1.09)
Test 2857 971
3316 1106
Analysis
(1.08) (1.06)
3076 3537 (0.98) 3626 Analysis Test 1040 1115 (1.04) 1070
*1 : () : ratio to test results
*2 : Values evaluatedfrom recorded data before 8.54 sec *3 : Evaluated from data when the displacement
at upper slab is the max.value
Max. bending moment at the bottom of shell portion
(tin)
2732
(0.92)
Max. Max. shear
horizontal deflection
deflection
angle of shell angle of shell portion portion
R (X l O-3rad) g ( x in m,,,-3ra w
2.92 1.67
(0.66) (0.60)
2957 4.41 2.78
4361
(1.26)
8.63 5.07
(1.20) (1.16)
3459 7.19 4.36
4265
(1.16)
7.34 4.09
(0.90) (0.83)
3678 8.18 4.95
4723
(1.21)
1 1 . 9 1 , 7.26
(1.10) (1.17)
3901 10.83
4891
(1.20)
6.20
14.67 9.03 *5
(0.93) (0.96)
4067 15.72 9.36
g/R (%)"
Time to generate the Max. Acc. at the upper slab "4
TI (S) T2 (S)
57
7.39 15.57
(0.90)
63 15.48 8.42
59
8.65 10.99
(0.97)
61 8.53 15.50
56
8.64 15.59
(0.92)
60 8.54 15.50
61
9.19 15.75
(1.06)
57 8.65 15.52
62
8.45 (1.03)
60 i 7.53 --
*4 : TI: time to generate the max. value
T2: time to generate smaller value of the max. value before 10sec. and the max value post 10sec. *5 : Max. shear deflection angle during
9 × $2 (H) excitation : 5, max=6.8 × 10 -a
T a b l e 5 A n a l y s i s R e s u l t s for t h e S e i s m i c M a r g i n E v a l u a t i o n
A n a l y s i s case
Max. Acc. at
.4"$2
the upper slab (Gal)
2963
Max. shear force of shell
portion
(t)
1104
Max. bending moment at tim bottom of shell portion (tm) 4995 Max. horizontal deflection angle of shell
portion R ( × 10 arad)
14.65
Max. shear deflection angle of shell
portion T ( X 103rad)
8.02
. 5 " $ 2 2992 1103 5011 14.93 8.21
c a s e l
. 4 " $ 2 3 2 7 0 1115 5191 16.54 8.95
. 5 " $ 2 3291 1118 5 2 1 7 16.74 9.44
7 . 5 " $ 2 3899 1137 4565 12.35 9.06
7 . 6 " $ 2 3913 1137 4481 12.99 9.49
case2
7 . 7 " $ 2 3941 1164 4655 14.29 10.19
7 . 8 " $ 2 3957 1157 4744 15.37 10.71
Criteria for fracture
H o r i z o n t a l d e f o r m a t i o n
a n g l e
S h e a r d e f o r m a t i o n
a n g l e
S h e a r d e f o r m a t i o n
angle
H o r i z o n t a l d e f o r m a t i o n