Effective Sizes for Subdivided Populations
Ronald
K.Chesser,*.t Olin
E.
Rhodes, Jr.,* Derrick
W.
Sugg*and Andrew Schnabel*
*Savannah River Ecology Laboratory, Aiken, South Carolina 29802, and ?Department of Genetics and Institute of Ecology, University of Georgia, Athens, Georgia 30602
Manuscript received August 24, 1992 Accepted for publication August 26, 1993
ABSTRACT
Many derivations of effective population sizes have been suggested in the literature; however, few account for the breeding structure and none can readily be expanded to subdivided populations. Breeding structures influence gene correlations through their effects on the number of breeding individuals of each sex, the mean number of progeny per female, and the variance in the number of progeny produced by males and females. Additionally, hierarchical structuring in a population is determined by the number of breeding groups and the migration rates of males and females among such groups. This study derives analytical solutions for effective sizes that can be applied to subdivided populations. Parameters that encapsulate breeding structure and subdivision are utilized to derive the traditional inbreeding and variance effective sizes. Also, it is shown that effective sizes can be determined for any hierarchical level of population structure for which gene correlations can accrue. Derivations of effective sizes for the accumulation of gene correlations within breeding groups (coancestral effective size) and among breeding groups (intergroup effective size) are given. The results converge to traditional, single population measures when similar assumptions are applied. In particular, inbreeding and intergroup effective sizes are shown to be special cases of the coancestral effective size, and intergroup and variance effective sizes will be equal if the population census remains constant. Instantaneous solutions for effective sizes, at any time after gene correlation begins to accrue, are given in terms of traditional F statistics or transition equations. All effective sizes are shown to converge upon a common asymptotic value when breeding tactics and migration rates are constant. The asymptotic effective size can be expressed in terms of the fixation indices and the number of breeding groups; however, the rate of approach to the asymptote is dependent upon dispersal rates. For accurate assessment of effective sizes, initial, instantaneous or asymptotic, the expressions must be applied at the lowest levels at which migration among breeding groups is nonrandom. Thus, the expressions may be applicable to lineages within socially structured populations, fragmented populations (if random exchange of genes prevails within each population), or combina- tions of intra- and interpopulation discontinuities of gene flow. Failure to recognize internal structures of populations may lead to considerable overestimates of inbreeding effective size, while usually underestimating variance effective size.
T
HE effective size of populations is a concept of paramount importance to biologists. T h e im- portance of accurate effective sizes lies in their utility for predicting the dynamics of genetic variation within and among populations of organisms. Effective pop- ulation size can be operationally defined as the size of an ideal population that would undergo the same amount of genetic change, via random union of ga- metes, as the actual population (WRIGHT 1969; LANDEand BARROWCLOUGH 1987). Traditionally, two types of effective size have been recognized; one that re- flects the accumulation of gene correlations within individuals (inbreeding effective size, Ne[) and one that reflects effects of gene-frequency drift (variance effec- tive size, Ne"; CROW 1954; CROW and KIMURA 1970;
CROW and DENNISTON 1988). T h e concept of effec- tive population size is central to much of population genetics theory primarily because it incorporates those characteristics that affect the conservation or loss of
Genetics 135: 1221-1232 (December, 1993)
genetic diversity within and among populations or subdivisions of populations (WOOD 1987; CHESSER
199 1 b).
Numerous mathematical treatments, involving vari- ables such as the proportions and ages of males and females within populations, the mean and variance in reproductive contributions by each sex, and the co- variance in male and female progeny contributed by each sex have been used to provide realistic formula- tions with which to calculate NeI and Ne" (KIMURA and
CROW 1963; CROW and KIMURA 1970; CROW and
DENNISTON 1988). Models for estimation of effective population size often differ in their treatment of gen- eration interval as either discrete or overlapping
(CHOY and WEIR 1978; HILL 1979). Further models have been derived to account for systems of mating between relatives (POLLAK 1987; CABALLERO and
1222 R. K. Chesser et al.
content, and interpretability (WOOD 1987; HARRIS and ALLENDORF 1989).
A common shortcoming of most existing formula- tions, beyond the general lack of convergence (HARRIS and ALLENDORF 1989), is their failure to address population organization (CHESSER 199 1 b). There is evidence that many organisms are arrayed into com- plexes of breeding units or subpopulations (EHRLICH
1965; SELANDER 1970; CHESSER 1983a). For the pur- poses of this paper we will define a population as a network of social units, breeding groups, or subpop- ulations ( e . g . , CHESSER 199 la,b) and genetic exchange may take place within and among the groups. Regard- less of geographic scale, subdivided populations can be maintained by means of intrinsic factors, such as behavioral segregation, or extrinsic factors, such as geographic distance and habitat fragmentation. Given the impact of structure on the gene diversity of breed- ing groups or subpopulations (CROW and KIMURA
1970; CHESSER 1991a,b), the importance to inbreed- ing and variance effective population sizes is irrefuta- ble.
Changes in Ne[ and N,v under conditions of incom- plete migration by males or females have been previ- ously assessed (CHESSER 1991b). Models used to ap- proximate values for N,I and N,v were based on pop- ulations composed of varying numbers of social units and incorporated the number of breeding females within each unit, the rates of migration by each sex, and potential polygynous breeding tactics. This work demonstrated that Ne[ and Nev were approximately equal under conditions of complete migration by males or females and that N,I and N , V differ markedly under various conditions of incomplete migration by both sexes.
T h e present work adds to the original models of CHESSER (1991a,b) by integrating the concept of ef- fective population size into a theoretical framework for the assessment of genetic variation in subdivided populations. Specifically, we will extend the formulas of CHESSER (1 991b) to include variance in progeny numbers, random sex of progeny, and the mean and variance in the number of mates per male. We also provide solutions for Ne[ and Ne" when breeding groups are changing in size and a new derivation of WRIGHT'S (1 969) island model that is appropriate to any scale. Throughout the text the terms breeding group and subpopulation will be defined as the lowest level of structure at which nonrandom exchange of genes occurs.
TRANSITION OF GENE CORRELATIONS
T h e expressions needed to derive equations for effective population sizes will be developed through methods similar to those presented in CHESSER (199 la,b). To circumvent restrictive assumptions,
however, it will be necessary to rederive the following variables:
F = average correlation of genes within in- dividuals (inbreeding coefficient)
19 = average correlation of genes between random progeny within breeding groups (coancestry)
CY = average correlation of genes of random individuals from different breeding
groups
T h e parameters used to derive the state of the critical variables are:
n =
s =
k =
a: =
dm and df =
d , =
number of breeding females within a breeding group for a given generation number of breeding groups within the population
average number of progeny, which sur- vive to reproduce, produced by each female
variance in number of progeny/female surviving to reproduce
migration rates for males and females, respectively
probability that random females within a breeding group mate with the same male.
CHESSER (1 99 la,b) defined the parameter
4
aswhere m is the number of males per breeding group, and
bi
is the number of females mated by the ith male(zi
b, = n). This parameter, however, can be expanded to include the mean and variance of the number of females mated by each male ( b and a;, respectively). Because b! = m(a;+
b'), the expression for4
be- comesand b = (X, b,)/m = n/m. It should be noted that m
may represent either the number of mating or poten- tially mating males, provided
02
is determined from the corresponding pool of males. In the instance when a single male mates with all of the females in a group, if the number of potentially breeding males is used, then m = n, b = 1 and a; = ( n-
1) because n-
1 males per subpopulation breed with zero females and one male in each subpopulation breeds with n females. Such a situation results in d, = 1. Alternatively, if theactual number of breeding males is used, m is set to one, b = n and a; = 0 because there is only one actual male breeder per subpopulation that mates with n
CHESER (1991a,b) assumed that each female pro- duced exactly two progeny, one male and one female. This assumption dictated that two variables were nec- essary to denote gene correlations (coancestry) within breeding groups, Om, for the correlation of genes among male progeny within breeding groups (which is identical to that among female progeny) and dmf for the coancestry between male and female progeny. However, if we permit the sex of the progeny to be determined randomly (each sex produced with a prob- ability of %), we find that B,, = 8, = dmf, and there is no need to differentiate between the coancestries of like-sexed and different-sexed progeny. Hence, we will designate the average coancestry of progeny born within breeding groups as simply 8.
The average coancestries of progeny born within subpopulations (or breeding groups) can be deter- mined from a triangular matrix. For example, if there are kn progeny born within a breeding group, then the average coancestry is the mean of the values for progeny pairs
(eii
denotes the coancestry between the ith and jth progeny born within a subpopulation)8 1 , ~ O I , ~ *
.
o l , k n02.3 '
.
fl2,kn(3)
. . .
...
8kn- 1 ,kn
The expected proportion of full siblings represented in this matrix is
with
ki
denoting the number of progeny produced by the ith female within a subpopulation. Because 2k? =
n[u:
+
k2], Equation 4 simplifies to(sibs) = ui
+
k(k
-
1) k(kn-
1) 'The expected coancestry of full siblings is
c[B(sib~)]~+~ = - (1 +Ft
+
2F,+,)(CHESSER 1991a, Equation 15) where t references the generation. The gene correlatio.ns among the remain- der of the progeny (non-sibs) within the subpopulation will be equal to the average coancestry of their parents
( y t ; CHESSER 1991b). Therefore, the expectation for
the average coancestry within subpopulations is 1
4 ( 6 )
[a::
+
k(k
-
I)][f
(1+ R
+
2Ft+1)1et+]
=k(kn
-
1 )[u:
+
k(k
-
l)]k(kn
-
1)(7) + [ 1
-
The coancestry of non-siblings, y t , is determined using Equations A.7 through A.9 of CHESSER (1991b, p. 583) and substituting &+I for Omm(t+l),
CP(1
+
Ft) Yt =8
7 -
4
Ft+ 1
+-+
2 kns- 14
fft.The expression for Ft+l can be derived from equations presented by CHESSER (1 991b, Equation A. 1) with the stipulation that now the sex of progeny is randomly determined;
F t + l = [ 1
-(
1 -:)(dm+df-d.d,) Br1
(9)Using Equations 8 and 9, expression
(7)
can be ex- panded, giving the average coancestry among progeny born within a subpopulation,. 2 - 4 ) -
[
(
~ kns- )(d.(l -4))+df) (10) hn(s-
1)11
[i'
-:)(dm+df-dmdf) k2(n-
1 )-
u:+
aI2
+(
4k(kn- 1))
Finally, the transition for the correlation of genes among subpopulations can be expressed as
1224
R.
K. Chesser et al.structed from Equations 9, 10 and 1 1
T =
1 - ( 1
-3).
( I-
$40
1
-
(1 - : ) Akn(s - 1 )
( 2
-
+)u:+
2k(k-
1 )+
+k2(n - 1) 2 8k(kn - 1 )0 2A/s
+
- kn - 1 kn - 1( d m + 4 ) 4
-
2A/s --
kns - 1 kns
-
14 4
( d m + d ~ )
with A , B , and
G
denoting ( d m+
d f - d,df), (d,(l-
4)
+
d f ) , and [k2(n-
1)-
ui]/(4k(kn-
1)) respectively. Aconstant vector,
L
01
must be included such that a,+I] = TIF,,
Of,
a,)+
C .EFFECTIVE POPULATION SIZES
Eigenvalue solutions to the matrix T would provide implicit solutions to the transitions of gene correla- tions. A single eigenvalue solution is possible, how- ever, only if the population remains in a steady state. When the population is either growing
(k
>
2) or declining (k<
2) the numbers of breeding females (n) and males (m) change each generation. Given an equal sex ratio of breeding individuals, n and m would change according toLikewise, if R represents a constant proportion of males in the subpopulations, R = m / ( m
+
n), thenn,+l = n,k(l
-
R ) ; m,+l = mfkR(1 5) n, = no[k(l
-
R ) ] , ; m , = mo[kR]'.With changing population size, unique eigenvalues would be found for each generation. Additionally, numerical solutions would necessarily incorporate the changes of n and m each iteration.
T h e derived eigenvalue solutions for steady state population sizes are extremely lengthy and complex and will not be presented here. We will derive expres- sions for effective numbers in three stages. First, the initial effective numbers will be presented and our
results will be compared to formulas derived for sin- gle, isolated populations with random mating. COCK- ERHAM (1970), however, showed that with nonran- dom mating, the values for effective population size change over generations. COCKERHAM (1 970) and C A - BALLERO and HILL (1992b) derived expressions appli- cable to the asymptotic value of effective population size. Therefore, we subsequently will derive instanta- neous effective numbers that are accurate for any generation, whether or not asymptote has been at- tained. Last, we derive approximations for the asymp- totic effective population size.
Initial effective numbers: Using the constant value of coancestry transition in the vector C (Equation 13) the recursions for F and a are
L \ s/ J
I
+ ( I -( 2
-
+)u:+
2k(k-
1 ) +gk2(n-
1)8k(kn - 1 )
I
I
and
4
( 2
-
+)u:+
2k(k-
1)+
+k2(n - 1)8k(kn - 1)
+ I -
Furthermore, because F,+, = I/zN,I
+
(1-
l/zN,,)F1expanded expression ( 2 ) for
41
4k(kn
-
1)26:
+
2k(k-
1)+
m(ab' + b(b-
')) [k2(n-
1)-
a:]][
1-
(1-
:)(dm+
d f-
dmdf)n(n
-
1)Equation 17 can likewise be expressed as the "inter- accumulation of gene correlations among breeding group effective size," Ne,, which reflects the overall groups,
~~
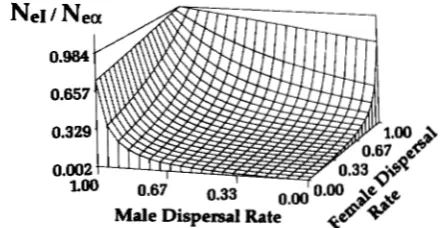
Figure 1 depicts some general effects of male ( d m )
and female ( d f ) migration rates on the relative values of
ne^
and Ne,. Regardless of the number of breeding groups, when d m and d f are small, the inbreeding effective size is much smaller than the intergroup effective size (NeI/Nc,<<
1). T h e two sizes attain nearly equivalent values (NeI/Nc,=
1 ) only when migration of one or the other sex is very high, but under no conditions is N,I greater than Ne,.Although the expression for Ne, in (1 9) is equivalent to that defined as variance effective size (Ncv) by CHESSER (1 991b), this equivalence holds only under
certain circumstances. For example, because Ncv de- pends on the number of progeny, whereas Ne, de- pends on the number of parents
(4.
CROW andKIMURA 1970, p. 361), the relative values of Nev and ,VC, will be affected by changing population size. When this occurs, the value of Ne, is readily determined from expression ( 1 9) by substitution of nt+l and mt+l
for n and m. Assuming that sex ratio of breeding individuals ( m / n ) is not changing over generations, its value can be represented by R/(1
-
R ) . Substituting R/(1-
R ) for m/n and nk(1-
R ) for n in Equation19, the variance effective size is determined to be
4k[k2n( 1
-
R )-
11Nev = ( 2 0 )
( 2
-
@)a::+
2k(k-
1)+
- Rk2 [[ab'+
b(b-
l)] d m+
d f - d df +
(k%(
1-
R )-
l ) ( d m+
df) 1 - R 4(k2n( 1-
R)s-
1)If the population is rapidly growing
(k
>>
2) or declin- ing(k
<<
2) Ncv may be considerably different fromNe, (larger or smaller, respectively).
CROW and DENNISTON (1988) determined inbreed- ing and variance effective numbers for single, isolated populations as (using our parameter symbols)
and
Our equations for initial effective sizes can be ex- pressed in terms that are consistent with those used by CROW and DENNISTON (1988). T h e variance in numbers of progeny produced by females, a:, is ex- plicitly included in all measures of effective numbers whereas variance in progeny sired by males is not. However, it can be shown that the variance in progeny produced by males is
a:(m) = &2(n
-
1)+
( 1-
$)a: ( 2 3 )and the variance in progeny number produced by
parents (regardless of sex) is
d T = d ( m )
+
+
2ah,k(m). ( 2 4 )If the covariance (ah,,+(,)) of sire and dam progeny numbers is assumed to be zero [a reasonable assump- tion (CROW and DENNISTON 1988, p. 491)], then
0.984
0.657
0.329
FIGURE 1 .-Three-dimensional diagram depicting the influence of migration rates by males (d.) and females (dr) on the ratio of the inbreeding effective size to the interpopulation effective size
(N,,/N,-). The graph was generated using 15 females per breeding
group, 20 breeding groups, and values of 2, 2, and 0.1 for k, ui,
1226 R.
K.
Chesser et al.Equation 24 can be expressed as Substituting Equation 25 into our measures of pri-
aL = (2
-
$)a:+
4k2(n-
1). (25) mary effective numbersNea = 4k(kn
-
1)[a&-+ 2k(k
-
l)][dm+d,f,fd
d f+ (kn- 4(kns-
1)dm
+
df- d d(k%(
1-
R )-
l)(dm+
df)] ’4(k2n(l
-
R)s-
1)[&+ 2k(k
-
l)]f+
These equations can be compared to those of CROW and DENNISTON (1988) by assigning s = 1 (a single population), dm = df = 1 (all individuals disperse back into their native population), and random mating (thus m = n, b = 1, and 0% = 0). With these stipulations
a& = 2a:, and our equations become
2k(kn
-
1) a::+
k(k -
1)N,I
2k(kn
-
1)N e , = Ne, =
a:
+
K(k
-
1)Remembering that 2n = N , it can be seen that Equa- tions 21 and 29 for Ne, are identical whereas those for
‘Nev, (22) and (30), are convergent as N becomes large. Furthermore, when
k
= 2, indicating constant popu- lation number, then Equations 21, 22, 29 and 30become
Thus, our expressions for primary effective numbers are either equal to or are close approximations of those of CROW and DENNISTON (1 988) when applied to a single isolated population. Our results also con- firm that CROW and DENNISTON’S (1988) equations are relevant to initial rather than ultimate effective population sizes (e$ CABALLERO and HILL 1992a,b).
T h e large number of parameters in Equations 18-
20 makes it difficult to discern clearly the relative importance of male and female contributions to effec- tive population sizes. It could be argued that because the distribution of possible values for a: is bounded for particular values of n and
k,
and the value of ab2 is limited by m and b , that we should not present all of these as parameters. Indeed, if we assign4m
as equiv- alent to4
(Equation 2) and4f
to Equation 5, theinbreeding effective population size can be repre- sented as
Here
4m
and4f
are defined as the probabilities that random progeny were the product of a particular adult male or female, respectively, and each may vary from essentially zero (progeny produced by many parents of a particular sex) to unity (all progeny pro- duced by a single mother or father). Although Equa- tion 32 is operationally identical to Equation 18, the relative roles of male and female contributions are more clearly envisioned by this reduced expression. Figure 2 shows that for a given number of subgroups, number of breeding females per group, and male and female dispersal rates, the inbreeding effective size isFIGURE 2.-Three dimensional diagram depicting the influence of the probabilities that random progeny are a product of a partic- ular adult male (6,) or female (&/) on inbreeding effective size (Ne,).
smallest when either & or &f is large and increases
dramatically as both & and
&
approach zero. Simi- larly, the intergroup effective size can be reduced to16s
Nm =
[2&
+
$ m ( l-
cbf)][S(dm+
df)
-
2dmdfl (33)if it is assumed that (kn
-
l)/(kns-
1) GZ l/s. Unfor-tunately, such reductions are not easily extended to
N,v when populations are growing or diminishing in size.
Instantaneous effective numbers: Perhaps the greatest utility of the effective sizes is for the predic- tion of changes in gene diversity within individuals and within populations over successive generations. Traditionally, recursive equations such as
(34)
would be used to estimate the value of inbreeding ( F ) ,
correlations among groups (a) and genetic variance (V) for any generation. T h e solution for NeZ provided in Equation 18, however, is for an initial rate of inbreeding at any given beginning time zero. It is clear from Equation 9 that the rate of accumulation of inbreeding over successive generations must also include the correlations among groups ( a ) as well. Thus, the accumulation of inbreeding over genera- tions may be represented as
which may be expanded using Equation 34 to
Both N,I and Ne, must be taken into account for accurate assessment of the dynamics of inbreeding in subdivided populations. Calculation of F from expres- sion (36) over many generations is only slightly less tedious than numerical iterations of the matrices (Equations 12 and 13).
COCKERHAM (1970; also see CABALLERO and HILL 1992a,b) demonstrated that nonrandom mating
changes the gene correlations over generations and alters the ultimate value of effective population size.
As is demonstrated by equations 35 and 36, expres- sions for effective population numbers presented thus far apply to the rates of change at the initial generation
( t = 0 to 1) of gene correlations within individuals
(Ne,) and among groups (Ne=); these rates will be altered as gene correlations accrue. CABALLERO and HILL (1 992b) derived the asymptotic value of effective size as
which would be attained after several generations of consistent mating tactics (the "hat" is used to reference asymptotic values). Their approach, however, was considerably different than ours in that breeding groups and dispersal rates were not explicitly defined.
As such, CABALLERO and HILL'S (1992b) analyses could not incorporate all of the gene correlations necessary to define asymptotic effective sizes. In par- ticular, lack of specific group definitions prevents inclusion of intragroup coancestry
(e)
values, the most predominant gene correlation under many breeding and dispersal tactics in our expressions. T h e rate ofchange of inbreeding is defined as
FALCONER (1989). Using Equation 9 to replace F , + ] ,
Equation 38 becomes
where the gene correlations (F,, Or, and at) are given in equations (9-1 1). T h e F-statistics given by CHESSER (1991a,b)
(using subscripts I ,
S,
and T refer to individuals, breed- ing groups, and total array of breeding groups, re- spectively) can be substituted into Equation 39 to yield1228
R.
K. Chesser et al,Similarly, A a = (at+l
-
at)/(l-
at), and using Equa- tions l l and 40 the rate of change of gene correlations among groups isand the intergroup effective population size is deter- mined as
Equation 44 also suffices for Nev if there is a constant census number. Interestingly, group ( n ) or total pop- ulation size ( N ) and variance of progeny number (cT:~)
are absent from the derivations of effective numbers, although they are important in determining the ulti- mate values of the F statistics.
Expressions (42 and 4 4 ) for effective population sizes provide exact fits for the values obtained via iterations of Equations 12 and 13, as would be ex- pected. Therefore, Equations 42 and 44 represent instantaneous effective population sizes chat are appii- cable at any generation (other than t = 0). CHESSER
(1991a,b) showed that with constant breeding and dispersal tactics the rates of change in gene correla- tions (F, 8 , a) also become equal, and the F statistics attain steady-state values. When the asymptotic values of the fixation indices are acquired, the effective pop- ulation numbers will likewise become asymptotic.
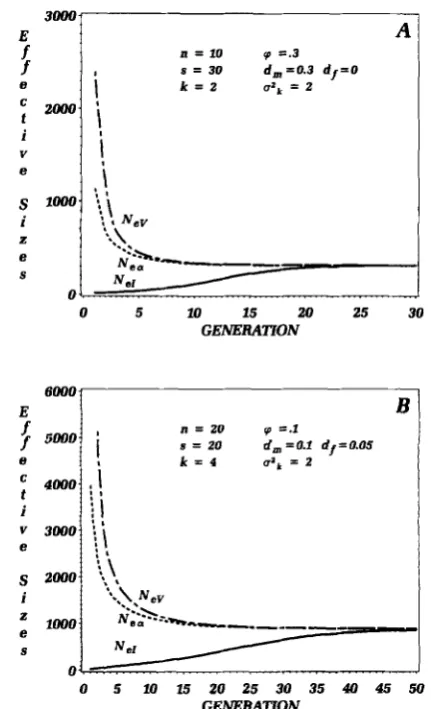
Asymptotic effective number: Although initial val- ues of Ne[ and NEv (assuming stable census number) may be dramatically different, the instantaneous val- ues of the effective sizes converge upon similar quan- tities when there is even slight genetic exchange among breeding groups ( d f
+
dm # 0; Figure 3). T h e time required for convergence is dependent upon the rates of genetic exchange with low rates requiring more generations until convergence is achieved.The asymptotic effective population size can be estimated readily using Equations 42 and 44. Assign- ing D = d m
+
df-
d,df in Equation 44, thenAt asymptote Ne]
=
N,,, therefore2s 1
-
6,T
8000
E
f 5mfl
f
e
t
i
V 3000 e
s
2000=
1000 4000i
S
0
c
0 5 1 0 2 5 2 0 2 5 3 0 3 5 4 0 4 5 5 0
GENERATON
FIGURE 3,"Changes in inbreeding (Ne,), variance (Nt"), and in- tergroup (N,) effective numbers over successive generations for two different breeding and dispersal scenarios. All converge on the same asymptotic value and the rate of convergence is dependent upon the rates of genetic exchange. Parameter values are explained in the text.
Solving Equation 46 for D yields
4S(fST
-
f J T )Fsd4.5
-
FIT
-
1)D = 4 A ( 4 7 )
which when substituted into Equation 42 or 45 results in the asymptotic estimate for effective population size
THE ISLAND MODEL
CHESSER (1 99 1 b) showed that WRIGHT'S (1 969) is- land model did not account for variation at intra- populational levels. CHESSER'S (1 99 1 b) solutions indi- cated that breeding tactics may be much more impor- tant in determining genetic differentiation among
Effective Population Size
complex form of the island model:
T h e value of F above is intended to represent the steady state value of inbreeding relative to the genetic variation remaining among groups and may not de- note the value for genetic differentiation (FsT) among groups as originally intended by WRIGHT (1969; see CHESSER 1991b). If there is one mate per male
( 6 = 1, uz = 0, and m = n), a very large number of subpopulations (1,’s z 0), a constant population size
(k
= 2; a i = 0), and equal migration rates by males and females (dm = dr = d ) , the result of Equation 45 will converge on WRIGHT’S (1969, p. 291) original asymptotic solution(1
-
d)’2N
-
(2N-
1)(1-
d)‘F = ( 5 0 )
as n becomes large (note that N = 2n). T h e reason that Equations 49 and 50 will not match exactly, given
WRIGHT’S assumptions above [as did CHESSER’S
(1 99 1 b) equation], is that not all progeny will have a sibling of the opposite sex as a potential mate. In
WRIGHT’S original derivations sex was not taken into account (random admixture of genes) and in
CHESSER’S (1 99 1 b) expressions each female produced a male and female offspring; thus, there was always a potential sibling mate.
If mating is not random then the island model will be biased by the accumulation of gene correlations just as were the effective sizes. Thus, Equations 49
and 50 represent overestimates of the asymptotic value of inbreeding, whereas Equations 4 1 and 43 are unbiased estimators of asymptotic changes in gene correlations. Rearrangement of Equation 44 presents an asymptotic estimate of the FST as
Furthermore, the total number of effective migrants per generation in the population is determined as
2s Nm[3(dm
+
d/)-
2(dmd/)J = 7F S T (52)
and the average number of migrants per breeding group is found by dividing both sides by s (comparable to Nm of WRIGHT 1969). If dispersal is performed by only one sex (dm.df = 0), then Nc,d/s = 2/(3FsT) and if dispersal is performed equally by both sexes (dm = d f = d ) yet is sufficiently low that terms with d 2 can be ignored (e.g., WRIGHT 1969), the average
number of migrants per breeding group (N,,d/s) is 1 /
(3F.s~).
DISCUSSION
T h e expressions derived herein provide for the delineation of initial and instantaneous inbreeding and variance effective sizes for subdivided populations exhibiting varying degrees of isolation and with dif- ferent mating tactics and progeny production. Al- though these equations include several parameters not found in previous derivations of NcI and Ncv (WRIGHT
1922; CROW and KIMURA 1970; CROW and DENNIS- TON 1988), they permit the definition of critical values for complex population structures. Previous expres- sions for Ne, and N,v were limited to single population values.
Initial effective numbers: Failure to recognize the contributions of incomplete migration (by either or both sexes) and nonrandom breeding tactics can lead to considerable bias in the estimation of inbreeding and variance effective sizes, especially in early gener- ations. Consider, for example, a population that is organized into several breeding groups. T h e breeding groups may be characterized as harems for polygnous males
(6m
>
0) and/or the groups may be some- what isolated from other groups in the population(dm&<
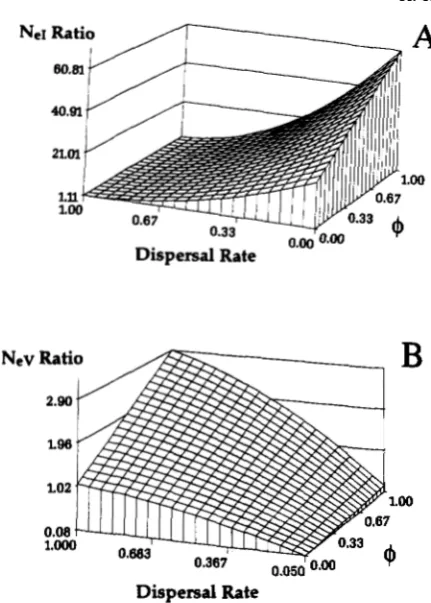
1). If such groups are ignored in the deter- mination of Nef, as would be done using traditional equations, the resulting value would overestimate the inbreeding effective size. This overestimation is clearly depicted in Figure 4A, which shows the ratio of a traditionally calculated N,I (CROW and KIMURA1970, p. 351) to that of equation (18). In this partic- ular example the traditional NcI may overestimate the true value by over sixty times. T h e ratio of the tradi- tional N,v (CROW and KIMURA 1970, p. 359) and our expression (Equation 20) also shows a large potential bias (Figure 4B). T h e traditional Ncv is often an un- derestimate of the true value (ratio approaches zero). Traditional estimates have not included the potential for conservation of gene diversity among totally or partially isolated breeding groups.
Breeding tactics ( 6 m ) and migration rates (dm, d,)
differ in their influence on the ratios for initial values
of inbreeding and variance effective sizes (Figure 4). In instances of complete migration (dm, df z l), there is little bias of traditional and newly derived values of inbreeding effective size regardless of the value for
1230
R.
K. Chesser et al.Dispersal Rate
FIGURE 4.-Three dimensional diagrams depicting the influence of dispersal rate and the probability that random females within a breeding group mate with the same male (6) on the ratios of traditionally calculated values for Ne, and N,v (CROW and KIMURA 1970) to our estimates for N,, (A) and N,. (B). The graphs were generated using 5 females per breeding group, 20 breeding groups, k = u: = 2, and 6 = 1.0.
partitioning of genetic variation among breeding groups; that is, the population functions as a single unit and the rate of inbreeding approaches that esti- mated by traditional methods. When groups become isolated (dm, d f < 1) the influence of breeding structure takes on greater importance in the calculation of NeI.
In contrast, the effects of breeding tactics are greater when migration rates are high if traditional N,v values are compared to those derived herein. As groups become isolated, Ne" approaches infinity regardless of
the breeding tactics employed whereas traditional val- ues remain finite. However, if even minute levels of genetic exchange persist among groups the effective numbers for N8, and Ne, will converge.
The expressions for N,I, Ne,, and Ne, are applicable at any hierarchical scale, including breeding groups within populations, among populations within regions, etc. As one progresses up the hierarchical scale, the effects of breeding tactics rapidly diminish ( n increases while 6 and ub2 remain fixed) yet rates of exchange (dm and df) remain of paramount importance. It is impor- tant to note, however, that regardless of the scale at which calculations are made, estimates will not be accurate unless all lower hierarchical levels exhibit random exchange of genes. Discontinuities in genetic exchange lead to relatively rapid rates of inbreeding within groups yet conserve variation among groups. Thus, calculations of inbreeding and variance effec- tive population sizes need to be determined at the lowest level at which these discontinuities take place.
The concept of effective population size can be extended to any unit for which gene correlations may accrue. The number of random breeders that are necessary to produce expected intragroup gene cor- relations (coancestral effective size; N d ) in initial gen- erations can be defined as
4k(kn
-
1)( 2 - & 3 + 2 k ( k - l)+-[ub2+b(b- l ) ]
24f+
4 4
1-
41)Nee =
mk2 n
(53) 4
-
-
which is derived from the nonzero second term of Equation 13. With this definition, the
ne^
and Ne, may be restated in terms of the N d asNee N,I =
1
-
(1-
(l/S))(dm+
df
-
d m d f )(54) Nd
= (dm
+
d,-
dmdf) + (An-
l)(dm+
df) *2 s 4(kns
-
1)Instantaneous effective numbers: The progression determined from Equation 10 to be of gene correlation within groups over generations is
As before, the instantaneous change in coancestry can noting that NeI and Ne, are for initial, rather than
T h e expressions derived herein document that effec- tive population numbers cannot be expressed as con- stant values over the range of generations commenc- ing with the initiation of a population unless mating is completely panmictic. Although effective sizes d o eventually attain steady state values, considerable ac- cumulation of gene correlations may be transpired prior to asymptote. Complete characterization of
Equations 12 and 13 into eigenvalues and eigenvec- tors would enable the dynamics of gene correlations to be determined using parameter assignments rather than by resultant F statistics and parameter combina- tions. Such characterization is intractable unless sim- plifying assumptions are made. Therefore, the most feasible way to depict accurately the dynamics of all relevant gene correlations is to iterate numerically Equations 12 and 13 using a simple computer pro- gram. In this manner, the F-statistics, inbreeding coef- ficients, coancestry values, correlations among groups, and all effective numbers, can be precisely tracked for each generation.
T h e definition of effective population sizes appli- cable to interacting breeding groups requires greater numbers of parameters for accurate description than traditional single population applications. Many sim- plifying assumptions are included in our derivations such as random migration (when present) among
groups, discrete nonoverlapping generations, and a relatively large (210) number of breeding groups. It is unlikely that substantial deviations from the numer- ical values will result if extensions of these scenarios are made to include overlapping generations (CHOY
and WEIR 1978; HILL 1979). Other methods such as migration matrices and variance in group sizes can be used to account for specific scenarios that deviate from those presented herein.
Asymptotic effective number: Our derivations of asymptotic values for variance (or intergroup) effec- tive population numbers were not consistent with those of CABALLERO and HILL (1992b; our Equation 37). It appears that the reason for the inconsistency is because CABALLERO and HILL’S (1 992b) approach did not permit the incorporation of intragroup coancestry
(e).
Although they used the Frs to account for devia- tions from random mating, their application is at the population level rather than that of the breeding groups; thus, their FIs = ( F-
a)/( 1-
a) (e.g., CHESSER1991a,b) and not ( F
-
e)/(
1-
e)
as defined herein (their F I ~ is equal to the FIT in this paper). Our deri- vations of Ne, include both the FST and the FIT andtherefore incorporate gene correlation values for 8, F , and a. Interestingly, our equations for Ner, Ne,, and
N,v show that knowledge of population census ( N ) and means and variances of progeny numbers are not required if the F statistics are known. From a theoret- ical perspective, however, knowledge of these param-
eters is necessary to derive the expected F statistics
(CHESSER 1991a,b).
Nonrandom mating and migration tactics have been documented both within and among populations for a large number of taxa (SELANDER 1970; CHESSER
1983a; RYMAN et al. 1980) and it has long been recognized that isolation of populations may act to conserve gene frequencies while promoting inbreed- ing (CHESSER, SMITH and BRISBIN 1980; CHESSER
1983b). Furthermore, knowledge of gene correlation values at various levels of population organization may elucidate the evolutionary significance of different breeding and dispersal tactics (CHESSER et al. 1993). Despite the ubiquity of population subdivision and its importance to gene conservation and evolutionary processes, previous models for effective population size have not taken such parameters into account. Our
intent, in the development of expressions for popula- tion effective sizes, is to facilitate the inclusion of complex population structures into programs for ge- netic conservation and evolution.
This work was supported by funds from contract (DE-ACO9- 765R00-8 19) between the Department of Energy and the Univer- sity of Georgia’s Savannah River Ecology Laboratory. Thanks go to I. L. BRISBIN, JR., M. H. SMITH, K. B. WILLIS and three anony- mous reviewers for their helpful comments and reviews of this manuscript.
L I T E R A T U R E C I T E D
CABALLERO, A., and W. G. HILL, 1992a A note on the inbreeding effective population size. Evolution 46: 1969-1972.
CABALLERO, A., and W. G. HILL, 1992b Effective size of nonran- dom mating populations. Genetics 1 3 0 909-916.
CHESSER, R. K., 1983a Genetic variability within and among p o p ulations of the black-tailed prairie dog. Evolution 37: 320-33 1. CHESSER, R. K., 1983b Isolation by distance: Relationship to the management of genetic resources, pp. 66-77, in Genetics and
Conservation. A Reference for Managing Wild Animal and Plant
Populations, edited by C. M. SHONEWALDCOX, S. M. CHAM-
BERS, B. MACBRYDE and L. THOMAS. Benjamin/Cummings Publ. Co., London.
CHESSER, R. K., 1991a Gene diversity and female philopatry. Genetics 127: 437-447.
CHESSER, R. K., 199 1 b Influence of gene flow and breeding tactics on gene diversity within populations. Genetics 1 2 9 573-583. CHESSER, R. K., M. H. SMITH and I. L. BRISBIN, JR., 1980
Management and maintenance of genetic variability in endan- gered species. Int. Zoo Ybk. 2 0 146-154.
CHESSER, R. K., D. W. SUCC, 0. E. RHODES, JR., J. N. NOVAK and
M. H. SMITH, 1993 Evolution of mammalian social structure. Acta Theriol. (in press).
CHOY, S. C., and B. S. WEIR, 1978 Exact inbreeding coeffkients in populations with overlapping generations. Genetics 8 9 59 1- 614.
COCKERHAM, C. C., 1970 Avoidance and rate of inbreeding, pp. 104-127, in Biomathematics, Vol.1, Mathematical Topics in Pop-
ulation Genetics, edited by K. KOJIMA. Springer-Verlag, New
York.
CROW, J. F., 1954 Breeding structure of populations. 11. Effective population number, pp. 543-560, in Statistics and Mathematics
1232 R. K. Chesser e t al.
GOWEN and J. L. LUSH. Iowa State College Press, Ames. CROW, J. F., and C. DENNISTON, 1988 Inbreeding and variance
effective population numbers. Evolution 42: 482-495. CROW, J. F., and M. KIMURA, 1970 An Introduction to Population
Genetics Theory. Harper & Row, New York.
EHRLICH, P. R., 1965 The population biology of the butterfly
Euphydryas editha. 11. The structure of the Jasper Ridge Colony.
Evolution 1 9 327-336.
FALCONER, D. A,, 1989 Introduction to Quantitative Genetics, Ed. 3. Longman, London.
HARRIS, R. B., and F. W. ALLENDORF, 1989 Genetically effective population size of large mammals: an assessment of estimators. Conserv. Biol. 3: 18 1
-
19 1.HILL, W. G., 1979 A note on effective population size with overlapping generations. Genetics 92: 31 7-322.
KIMURA, M . , and J. F. CROW, 1963 The measurement of effective population number. Evolution 17: 279-288.
LANDE, R., and G. F. BARROWCLOUGH, 1987 Effective population size, genetic variation, and their use in population manage-
ment, pp. 86-123, in Viable Populations fo r Conservation, editec by M. E. SOULE. Cambridge University Press, New York.
POLLAK, E., 1987 On the theory of partially inbreeding finitc populations. I. Partial selfing. Genetics 117: 353-360.
RYMAN, N., C. REUTERWALL, K. NYGREN and T. NYGREN 1980 Genetic variation and differentiation in Scandinaviar moose ( A h a h ) : are large mammals monomorphic? Evoh tion 3 4 1037-1049.
SELANDER, R. K., 1970 Behavior and genetic variation in natura populations. Am. Zool. 10: 53-66.
WOOD, J. W., 1987 The genetic demography of the Gainj 01
Papua New Guinea. 2. Determinants of effective populatior size. Am. Nat. 1 2 9 165-187.
WRIGHT, S., 1922 Coefficients of inbreeding and relationship Am. Nat. 56: 330-338.
WRIGHT, S., 1969 Evolution and the genetics of populations, Vol
4, The Theory of Gene Frequencies. University of Chicago Press
Chicago.