ABSTRACT
KEANE, ROSEMARY BRIGID. Social Media and the National Park Service: A Case Study of Visitor Preferences at Crater Lake National Park. (Under the direction of Dr. Jordan W. Smith)
New and emerging technologies such as social media and mobile applications have considerable potential for use by recreation resource management agencies, such as the National Park Service (NPS), to improve visitor services. These technologies can allow park managers to provide higher quality outdoor recreation opportunities to current visitors and also facilitate communication with previously unreached visitor groups. To maximize potential benefits, the use of social media by the NPS needs to be carefully planned and implemented so that it capitalizes on visitors’ current use of different platforms and reflects a clear understanding of the type of information visitors would like to receive through agency-managed social media channels. Using data collected via on-site surveys, this study
examined the extent to which Crater Lake National Park visitors currently use social media platforms, visitors’ preferences for specific types of information that can be delivered through those platforms, visitors’ preferences for Wi-Fi access at the park and visitors’ perceptions of trust in information sources commonly used for trip planning. The results indicate that visitors have clear preferences for specific park related content delivered
Social Media and the National Park Service: A Case Study of Visitor Preferences at Crater Lake National Park
by
Rosemary Brigid Keane
A thesis submitted to the Graduate Faculty of North Carolina State University
in partial fulfillment of the requirements for the degree of
Master of Science
Natural Resources
Raleigh, North Carolina 2016
APPROVED BY:
________________________________ ________________________________
Dr. Jordan W. Smith Dr. Erin Seekamp
Chair of Advisory Committee
ii
DEDICATION
To my family and friends, thank you for your unconditional love and tireless support. You made me the person I am today, and I could not have achieved this without you. To my parents, thank you for the opportunities you gave me. All of my success I owe to you.
iii BIOGRAPHY
Rosemary was born and raised in Champaign, Illinois. She learned her A.A. in Mass Communications and her A.A. in Sociology from Parkland College in Champaign, Illinois. She earned her B.S in Integrative Biology from the University of Illinois at
iv
ACKNOWLEDGEMENTS
This work was generously supported by the Crater Lake Science and Learning Center, the U.S. National Park Service, North Carolina State University College of Natural Resources,
v
LIST OF TABLES
Table 1: Research Framework ... 16
Table 2: Social Media Usage 2014 ... 19
Table 3: Basic Demographic and Visitor Characteristics ... 21
Table 4: Survey regarding visitor trust in non-social media information sources. ... 24
Table 5: Survey Response Rate ... 27
Table 6: Demographic Characteristics of Visitors to Crater Lake National Park ... 28
Table 7: Trip Characteristics of Visitors to Crater Lake National Park ... 29
Table 8: Social Media Usage by Visitors to Crater Lake National Park ... 31
Table 9: Facebook Usage by Visitors to Crater Lake National Park ... 32
Table 10: Twitter Usage by Visitors to Crater Lake National Park ... 33
Table 11: Instagram Usage by Visitors to Crater Lake National Park ... 34
Table 12: YouTube Usage by Visitors to Crater Lake National Park ... 35
Table 13: Flickr Usage by Visitors to Crater Lake National Park ... 36
Table 14: Visits to Crater Lake Social Media Pages ... 37
Table 15: Crater Lake Specific Information preferred on Facebook ... 38
Table 16: Crater Lake Specific Information preferred on Twitter ... 39
Table 17: Crater Lake Specific Information preferred on Instagram ... 40
Table 18: Crater Lake Specific Information preferred on YouTube ... 41
Table 19: Crater Lake Specific Information preferred on Flickr ... 42
Table 20: Trust in Various Sources of Park Related Information ... 43
vi
vii
LIST OF FIGURES
viii
TABLE OF CONTENTS
LIST OF TABLES ... v
LIST OF FIGURES ... vii
INTRODUCTION ... 1
LITERATURE REVIEW ... 5
Social Media and the National Park Service ... 5
Can Park Specific Empirical Evidence be used to Create Tailored Social Media Communication Strategies? ... 9
Social Media and Recreation Experiences ... 10
Attracting Visitors through Social Media ... 13
METHODS ... 15
Research Framework ... 15
Study Site ... 17
Survey Instrument and Analysis ... 19
Social Media Platforms ... 19
General Demographic and Trip Information ... 20
Objective 1: Evaluate visitors’ social media behaviors and preferences. ... 21
Objective 2: Assess preferences for the specific types of information to be disseminated via social media by Crater Lake National Park. ... 22
Objective 3: Assess other sources used to obtain trip-related information. ... 23
Objective 4: Assess visitor preferences for Wi-Fi access on site. ... 24
Sampling Methodology ... 25
Analysis... 26
RESULTS ... 27
Survey Response Rate... 27
General Demographic and Trip Information ... 27
Objective 1: Evaluate visitors’ social media behaviors and preferences. ... 30
Objective 2: Assess preferences for the specific types of information to be disseminated via social media by Crater Lake National Park. ... 36
Objective 3: Assess trusted sources used to obtain trip-related information. ... 42
Objective 4: Assess visitor preferences for Wi-Fi access on site. ... 44
ix
General Demographic and Trip Information ... 46
Objective 1: Evaluate visitors’ social media behaviors and preferences ... 47
Objective 2: Assess preferences for the specific types of information to be disseminated via social media by Crater Lake National Park. ... 51
Objective 3: Assess other sources used to obtain trip-related information. ... 56
Objective 4: Assess visitor preferences for Wi-Fi access on site. ... 58
BEST PRACTICES RECOMMENDATIONS... 59
DIRECTIONS FOR FUTURE RESEARCH... 62
REFERENCES ... 63
APPENDICES ... 69
Appendix A – Informed Consent Form for Adults ... 70
Appendix B – Informed Consent Form for Minors ... 72
Appendix C – Survey for Visitors without Social Media ... 74
1
INTRODUCTION
Emerging web-based technologies such as social media and mobile applications have rapidly altered how individuals search for, find and learn about new information (Kaplan & Haenlein, 2010). Individuals are increasingly turning to their online social networks to obtain desired information. However, many public trust resource management agencies have been slow to adopt the use of these technologies, often citing concerns over not knowing how, or even if, members of the general public would use the content they post to these platforms (Bertot, Jaeger & Hansen, 2012). This is unfortunate, as social media-based content has the potential to dramatically change how members of the general public engage with individual agencies and the resources they manage. This is particularly true for the National Park Service (NPS), an agency whose resources and outstanding recreational opportunities attract visitors from across the globe. Visitors to NPS-managed recreational resources are already posting, tweeting, instagramming and sharing video recordings of their experiences through social media.
2
communication strategies the agency can use to improve visitors’ experiences and their knowledge of the park’s unique natural and cultural history.
Recreation resource management professionals have a large suite of communication tools designed to make park visits more memorable and to increase visitors’ ability to have meaningful experiences during their visit (Oppegaard & Shine, 2014). These communication tools commonly include pamphlets, interpretive tours and educational displays.
Unfortunately however, each of these tools runs the risk of treating visitors the same regardless of their individual preferences or the preferences that tend to be shared by individuals with similar socio-demographic characteristics. For large public trust resource management agencies like the NPS, whose visitation is extremely diverse, the ability to develop targeted communication strategies capable transmitting specific information to specific populations in an efficient manner is particularly appealing (Parker, Green, & Johnson, 2014).
3
individuals’ interests and park-related information by enabling visitors to share information about their trip before, during and after their actual visit to the park itself (Litvin, Goldsmith, & Pan, 2008; Fotis, Buhalis, and Rossides, 2012; Yoo, Lee, Gretzel, & Fesenmaier, 2009).
For public trust resource management agencies like the NPS, the use of social media is not completely foreign; social media and user-generated content is being quickly (albeit inconsistently) adopted across all organizational levels of the agency. Social media and user-generated content has also been made a top priority in the agency’s long-range planning efforts. In the report “Advancing the National Park Idea,” published by The National Parks Second Century Commission, an independent group created by the National Parks
Conservation Association, social media and emerging user-generated content technologies were explicitly identified as critical avenues through which the NPS can communicate with the public (2009). One of the key recommendations of the report called for the NPS to “facilitate use of current and leading-edge technologies and media to enhance place-based learning, including social networking” (NCPA, 2009, p. 43.). Social media platforms are extremely flexible, allowing park managers to customize their information to a certain audience or individual in a very cost-effective way (Tham, 2013). Social media can also be used to facilitate the creation or management of online partnerships with community- or activity-related groups. This possibility can result in greater levels of visitor engagement and an increased ability of park personnel to effectively communicate with the public (Matloka & Buhalis, 2010; Ružić & Biloš, 2010).
4
national level, and generally in conjunction with research that includes visitor perceptions of other interpretive materials (Forist, 2003; Garrison & Li, 2014). Research has been
conducted on how certain technological platforms can be used by younger children, but those educational platforms might not be seen as relevant for other audiences (Subramaniam, Valdivia, Pellicone, Neigh, & Lowman, 2014; Littlejohn, Le, Russell, Hollenhorst, & Gramann, 2009; Gramann, 2003). While these studies were not conducted specifically by or for the NPS, their findings are likely to still apply to how park managers can use technology to engage with different audiences. However, more focused research conducted specifically at NPS units is needed given the iconic nature of the agency and the fact that NPS units draw a much more geographically- and demographically-diverse set of visitors relative to other public-trust recreation resources (Moore & Driver, 2005).
The research outlined below provides an exploratory analysis designed to determine if, and how, visitors to an iconic national park (Crater Lake National Park in Oregon, USA) use social media to plan their visit and learn about the park’s unique geophysical, biological and cultural history. The investigation focuses on major social media platforms (Facebook, Twitter, Instagram, Flickr and YouTube) commonly used by visitors in their personal communication networks. Using data collected from on-site surveys, the study explores: which platforms are used most often; how likely visitors would be to seek out information about their park visit from each source; and what kinds of information visitors would prefer from each platform.
5
information can be useful for the agency as they endeavor to develop more effective modes of communicating with visitors. The study also examines visitors’ attitudes toward, and preferences for, Wi-Fi access while at the Park. Coupled with data collected on visitors’ sociodemographic (e.g., age, gender, education level and ethnicity) and trip characteristics (e.g., length of stay, group size, group composition and first time or repeat visitor), the study aims to provide guidelines to inform an empirically grounded social media communication strategy for Crater Lake National Park personnel. Even though the study was conducted at only one park unit, it does focus on relatively common social media platforms, the findings are likely to hold implications for other parks and protected areas.
LITERATURE REVIEW
In examining the potential relationships between visitors’ use of social media and how the NPS can capitalize on its rapid growth, it is important to consider a number of topics including: 1) how the NPS has approached new and emerging technologies in interpretation and visitor outreach and how these approaches relate to current visitation trends; 2) whether park-specific empirical evidence can aid in the creation of better communication strategies; 3) how social media use relates to recreation experiences; and 4) how social media can be used to attract new visitors to the NPS.
Social Media and the National Park Service
6
nation’s population as a whole has become younger, more urban and racially diverse, the vast majority of domestic park visitors tend to be older, non-Hispanic white individuals (Murphy, 2005). A focus group organized by the NPS Park Planning and Special Studies Program has acknowledged the growing concern for these changing trends, especially the fact that “the fasting growing segment of the US population is made up of people who are
under-represented in visits to parks - Latinos and other peoples of color” (Gramann, 2003). Younger visitors are also less likely to value spending time outdoors, and as such are a critical audience for the NPS to target (Pergrams & Zaradic, 2008; NPS, 2015; Leask, Fyall & Barron, 2014). Outdoor recreation research suggests younger populations of visitors will be more comfortable with technology than their older counterparts (Gramann, 2003). Consequently, more effort needs to be made to integrate these kinds of media into park interpretation and outreach strategies.
A report recently published by the NPS identifies considerations that need to be made to better account for changing visitor populations. The report “Urban Matters: The Call to [Urban] Action” (2015) highlights the fact demographic changes are “not reflected in the National Park Service workforce, themes interpreted in its parks, or in its visitors” (p. 10). Additionally, the report calls for a greater integration in the NPS of the increasing diversity of the American public, charging managers to “in an age of increasing diversity…continually ask whether the way in which the National Park Service tells [its] stories has meaning for all our citizens” (p. 10, NPS, 2015).
Cultural constraints may also contribute to the divergence between the
7
Solop, Hagen and Ostergen (2003) suggest individuals who lack a personal/cultural
connection to a park are less likely to visit, and that younger individuals as well as minorities tend to have lower incomes relative to their older, white counterparts, also making them less likely to visit. Additionally, a lack of inclusion of varying cultural perspectives in the parks’ interpretive practices may limit underrepresented groups’ willingness to visit park units (NPS, 2015; Floyd, Bocarro & Thompson, 2008). The financial constraints faced by younger individuals may prohibit visitation to NPS units, which are more remote and charge higher access fees relative to other public recreation destinations such as those managed by the USDA Forest Service or the Bureau of Land Management (Stevens, More & Markowski-Lindsay, 2014; Benson, et al. 2013; Schultis & More, 2011).
8
source for NPS information, just as guidebooks, maps and other NPS publications are for older generations (Garrrison & Li, 2014).
The NPS has recognized the potential of web-based digital information and media. In their “Call to Action Report”, the agency identifies the need to better “showcase the meaning of parks to new audiences through…social media,” and to “use leading-edge technologies and social media to effectively communicate and capture the interest of the public” (p. 10, NPS, 2015). This need was also reflected by NPS Director Jon Jarvis, who released a memorandum specifically related to social media in 2011 (DOI, 2011). The memorandum discussed the need to develop a social media strategy and outlines basic considerations park staff need to keep in mind when starting their own social media accounts on behalf of the park units they represent (DOI, 2011). While the memorandum offered a general level of guidance, it largely left discretion of what information to post and how to communicate via social media channels up to individual park staff tasked with creating communication strategies. While this approach gives agency personnel a lot of flexibility, it lacks any evidence-based recommendations.
9
Trust plays a critical role in the kinds of engagement the NPS hopes to gain from increased communication with its current and potential visitors. Hong (2013, 2014)
concluded the general public is influenced by the kinds of communication they receive from government agencies online, and that they are more likely to have positive perceptions of the agency and trust the material more if it is presented through online communication channels. At present, no empirically based research has been conducted on the kinds of content the visitors to the NPS are willing to trust, nor how effective the current NPS social media communication strategies are proving to be. Mergel and Bretschneider (2013) have identified three stages in which social media is adopted by the government: 1) informal
experimentation with social media; 2) norms are established and regulations are made; and 3) order becomes formalized through successful strategies and policies. It is important to note that these three processes have been used by other scholars to examine how the NPS is using social media. Garrison and Li (2014) argue that the NPS is now using its interim policies developed by Director Jon Jarvis and are searching for successful strategies and policies. This research should illuminate key insights in developing such strategies.
Can Park Specific Empirical Evidence be used to Create Tailored Social Media
Communication Strategies?
Bertot and colleagues (2012) suggest that government agencies need a better
10
social media and emerging technologies as some of the most effective ways by which
government agencies can communicate with the public (Liu, Horsley & Yang, 2012; Mergel, 2012; Dadashzadeh, 2010).
Some logical goals of any park unit in creating a tailored social media communication strategy should be to: 1) improve the experiences of current park visitors; and 2) attract new visitors who otherwise might not have known about or considered the National Park as a leisure time activity. In the case of Crater Lake National Park, managers would benefit from understanding the differences in how and why visitors engage with the park’s social media accounts. For example, currently the Crater Lake National Park’s Facebook page is “liked” (i.e., followed or subscribed to) by 170,517 individuals. Managers could better tailor their communication efforts to those individuals by knowing things such as how often they visit the page, what content they interact with the most, or whether or not they follow Crater Lake National Park on any other social media platforms. Managers would also benefit from understanding what specific kinds of information (e.g., information about cultural resources, weather, wildlife, etc.) visitors would like to receive from the agency before, during and after their trip to facilitate the attainment of more desirable experiences while at the park.
Social Media and Recreation Experiences
The importance of visitor experiences at national parks and the personal significance of their memories of those experiences has been examined by many leisure scholars
11
diversity of those needs and preferences throughout the entire visitor experience (Leask, 2010; Wells, Lovejoy & Welch, 2009; Devesa, Laguna & Palacios, 2010). Social media can create a link between visitors and a park, potentially making their trip more relevant and personally salient.
Although very little research has examined the role of social media in NPS
management, studies into the role of social media for tourism and hospitality professionals have been conducted which can yield many insights useful for park managers (see Leung, Law, van Hoof & Buhalis, 2013 and Zeng & Gerritsen, 2014 for comprehensive reviews). Mobile technologies available through smart phones and other portable electronics have enabled visitors to more effectively find information they need to plan for park visits; these technologies have also made it easier for visitors to send information to others about their experiences and also store content about their experiences and memories (e.g., photos, videos, or other media) (Wang, Park & Fesenmaier, 2012).
12
understanding of what visitors want before they actually arrive at the park. However, this is only true if the visitor engages with the park’s social media page.
13
As visitors leave the park, social media can be used in much the same way as it is used for visitors on their way to the park. In terms of recollection, social media is an ideal way for visitors to not only share their memories with family and friends, but also to “archive” their experiences and reminisce about them at a later point in time. As a result, these unique capabilities may increase the personal impact and salience of visitors’ experiences. Social media use by managers can involve commenting and sharing content with previous visitors as well, increasing a visitor’s engagement with the park and potentially encouraging them to make return visits.
Attracting Visitors through Social Media
As mentioned above, one of the major goals of any park unit in creating a tailored social media communication strategy is to attract new visitors who otherwise might not have known about or considered the park as a leisure time activity. The dissemination of park-specific information via trusted information sources is likely to result in an increased awareness about park resources and potentially increased visitation amongst
underrepresented populations. Previous marketing research suggests information
14
Having the Internet available to park visitors might also offer an opportunity for individual park units to attract new visitors. The infrastructure costs of having Wi-Fi throughout parks and protected areas can be daunting for managers, but the potential
advantages should be examined. Visitors that can access free Wi-Fi at central locations in the park can more easily find park information, make reservations at nearby food and lodging establishments and access important personal or financial information while they are
traveling in the event they would like to change their plans. Wi-Fi within National Parks also allows visitors to instantly share their park experiences. NPS groups have acknowledged the increased visitor demand for Wi-Fi on site (Gramann, 2003). Providing Wi-Fi on site could potentially create conflict for visitors who seek solitude and a distancing from technology by visiting the park.
15 METHODS Research Framework
As stated above, the purpose of this study is to determine if, and how, NPS visitors use social media for trip planning and obtaining information while at a park. To achieve this goal, a multi-objective research framework was designed and used to guide the development of an on-site survey administered to visitors to Crater Lake National Park. The
multi-objective research framework is presented in Table 1. The individual multi-objectives described in the research framework were developed by first substantively reviewing the academic and non-academic literature related to social media and visitor experiences in publically managed recreation resources and then developing a set of research questions that had yet to be
empirically examined. The research questions each have related implications for park and visitor management; these implications are listed in the third row of the framework. These research questions and their associated management implications were subsequently used to identify lists of general measures to be included in the on-site survey.
16
Table 1: Research Framework
OBJECTIVE 1. Evaluate visitors’ social media behaviors and preferences. OBJECTIVE 2. Assess preferences for the specific types of information to be disseminated via social media.
OBJECTIVE 3. Assess other sources used to obtain trip-related information.
OBJECTIVE 4. Assess visitor preferences for Wi-Fi access on site.
Research Question
To what extent do visitors use specific social media platforms in general, outside of planning their visit? How would visitors share their trip related
experiences with others through specific social media platforms? What are visitors’ preferences for information about the park from specific social media platforms?
To what extent do visitors use non-social media for trip-related information? How much trust do visitors place in information disseminated via social media or other forms of communication?
Do visitors prefer Wi-Fi access on site? To what extent would Wi-Fi access improve visitors’ experience at the park?
Managerial Implication
Park staff will be equipped to reach audiences through the most used social media channels.
Park staff will be better able to understand what their audience is seeking, and how to best cater to that need.
Park staff will be able to target venues that might not have been utilized before to maximize communication impact.
Park staff will be better able to decide whether or not to invest in Wi-Fi infrastructure on site.
Survey Measures
• Prior use of social media • Social media platforms used • Desired information • Trusted information sources
• Support for Wi-Fi access on site • Wi-Fi and its
17 Study Site
The study site was Crater Lake National Park, located in the Cascade Mountains of Oregon (USA) (Figure 1). Established in 1902, Crater Lake National Park is home to the deepest lake in the United States and second deepest lake in North America. The lake was formed through the eruption, implosion and subsequent filling of Mount Mazama. Due to the lack of inlets and tributaries, Crater Lake has been described as one of the purest in the world (Harmon, 2002). Between 2009 and 2014, Crater Lake National Park has consistently
attracted more than 400,000 visitors each year, with visitation peaking from June through September. Visitors to the park can enjoy hiking, driving around the caldera on the Rim Drive (33 miles), swimming in the lake and taking boat tours to Wizard Island, among other activities. Visitors may hike to Mt. Scott, which boasts a full panoramic view of over 100 miles (on a clear day).
In addition to providing iconic and beautiful scenic views and facilitating a host of outdoor recreation activities, Crater Lake is also highly valued for its cultural significance to local Native American tribes (Deur, 2002). The ancient legends of the native Klamath Tribes describe the eruption of Mt. Mazama as a battle between Llao, the god of the underworld, and Skell, the god of the above world. The struggle ended with the eruption of Mt. Mazama (the destruction of Llao’s home), and the formation of Crater Lake.
18
States. The relatively remote location of the park may make NPS-provided Wi-Fi cost-prohibitive. The relatively remote positioning of Crater Lake National Park could be both an argument against social media (due to prohibitive costs and resources required for
installation) but also a motivation for provision of these services, especially in times of emergency.
19 Survey Instrument and Analysis
Social Media Platforms
Social media platforms vary in the types of content they allow users to share. To design and implement efficient communication strategies, park managers need to disseminate different types of content (e.g., short messages (Twitter) or images (Instagram)) to target audiences who prefer to use and share that type of content. Consequently, collecting
information about visitors’ preferences for specific platforms can assist managers in choosing where to disseminate specific types of information that might lend itself to one platform or another. This study focuses on the five most common social media platforms used in the United States; these platforms are Facebook, Twitter, Instagram, YouTube and Flickr. These platforms are listed and described in Table 2.
Table 2: Social Media Usage 2014 (Duggan et al., 2015)
Platform Name
Description Percentage of online US adults active on
platform
In Use by the NPS
In Use by Crater Lake National
Park Facebook Social
networking site
72% Yes Yes
Twitter Micro-blogging site
23% Yes Yes
Instagram Photo sharing site
26% Yes No
YouTube Video sharing site
63% Yes No
Flickr Photo sharing site
20
For the purposes of the study, visitor use of individual platforms refers to the
individual logging on to the website and engaging with its content. This could be in the form of uploading content themselves, viewing content provided by others or interacting with others in discussion over the content through “likes,” “shares” or discussion. Questions included in the survey (Appendix) establish how often and for what reasons visitors generally use social media platforms. Individuals were asked about which social media platforms they would prefer (Facebook, Twitter, Instagram, Flickr and YouTube) for certain kinds of park content (history, directions, park conditions, natural features and local amenities and activities).
General Demographic and Trip Information
21
Table 3 - Basic Demographic and Trip Variables
Trip Characteristics
Group Size and Composition
Basic Demographics of Individual Survey
Respondents • First or returning
visit
• Length of visit
• Number of individuals • Number of adults
(18+ years old) • Number of minors
(15-18 years old)
• Gender • Age
• Education level • Race/ethnicity • Home zip code
Objective 1: Evaluate visitors’ social media behaviors and preferences.
Data on the extent to which visitors use specific social media platforms in general, outside of planning their visit, was collected by asking individuals, “Which of the following social media sites have you used in the past month?” Respondents were prompted to give their response among six nominal categories that included, “Facebook,” “Twitter,” “Instagram,” “YouTube,” “Flickr” and “If another social media site, please specify:” followed by an open-ended response option.
Data on how visitors use each specific social media platform they indicated using was assessed by asking individuals several additional questions. The following questions are all specific to the social media platforms the visitor selected in the previous question.
22
among five nominal categories which included, “To keep in contact with family and friends,” “To stay informed of others in your extended social network,” “For entertainment purposes (e.g., games, video, etc.),” “To express your opinions” and “To find and share information.” Objective 2: Assess preferences for the specific types of information to be disseminated via
social media by Crater Lake National Park.
To accurately estimate how often visitors use the social media platforms already utilized by Crater Lake National Park, the following question were asked in connection to Facebook, Twitter and Flickr: “Have you visited the Crater Lake National Park [specific social media platform] page?” Individuals were prompted to respond with either “Yes” or “No.”
Data on what specific kinds of information visitors would prefer to receive from distinct social media platforms on which Crater Lake National Park has a presence was collected by asking individuals, “What types of information specifically from the Crater Lake National Park’s [specific social media platform] site would allow you to have a higher
quality recreation experience?” Respondents were prompted to give their response among eight nominal categories which included “Information about current weather/trail conditions in the Park,” “Information about the Park’s natural and cultural history,” “Information about available recreational activities in the Park,” “Information about wildlife that can be seen within the Park,” “Information about getting to/from the Park,” “Information about local amenities and activities around the Park,” “Other (please specify):” and “None of the above.”
23
which ones?” Respondents were prompted to select among seven nominal response categories which included: “Facebook,” “Twitter,” “Instagram,” “YouTube,” “Flickr,” “If some other social media site, please specify:” and “I did not use any of my social media accounts to plan this visit.” This question was only presented to respondents that indicated they were active on at least one social media platform.
Objective 3: Assess other sources used to obtain trip-related information.
Data were collected regarding the Crater Lake National Park website and whether visitors to the park had visited the website before their visit and if they had used it to plan their trip. Respondents were prompted to answer “Yes” or “No” to the following questions: “Did you visit the Crater Lake National Park website prior to this visit?” and “Did you use the Crater Lake National Park website to plan this visit?”
Individuals were also asked, “What other information sources did you use to plan this trip?” Respondents were given seven nominal response categories which included: “Close friends and/or family,” “Coworkers and/or friends you do not consider close,” “Online non-news source (e.g., Wikipedia),” “Material provided by an organization or group (e.g., school, church, non-profit, etc.),” “Magazines,” “National Park Service publications” and “Other (please specify):.”
24
response matrix shown in Table 4. Respondents were instructed to select only one response for each information source selected.
Table 4: Survey regarding visitor trust in non-social media information sources.
I would not get my information from this source.
I would seek out information from this source, but I would be cautious about trusting it.
I would seek out information from this source, and I would always trust it.
Close friends
and/or family ___ ___ ___
Coworkers and/or friends you would not consider close
___ ___ ___
Online non-news
source ___ ___ ___
Material provided by an organization or group
___ ___ ___
Magazines ___ ___ ___
National Park Service publications
___ ___ ___
Objective 4: Assess visitor preferences for Wi-Fi access on site.
25
Lake National Park allow you to have higher quality recreation experiences?” Respondents were prompted to respond by indicating “Yes,” “No” or “No opinion.”
Data about the extent to which visitors would support Wi-Fi access at the park was collected using the following question: “How strongly do you either support or oppose having Wi-Fi access at Crater Lake National Park?” Respondents were given five ordinal response options which included: “Strongly support,” “Somewhat support,” “Neither support nor oppose,” “Somewhat oppose” and “Strongly oppose.”
Sampling Methodology
Data were collected via an on-site paper survey administered by one graduate research assistant between July 15-24 and August 1-15,2015. These dates were selected to gain access to the highest possible number of visitors, as June through September is the peak season for Crater Lake National Park. On-site surveys were selected because they can accurately capture visitors’ perceptions and behaviors during their visit. Post-visit data collection methods such as mail-back surveys have been known to produce biased
assessments of on-site experiences (Armstrong & Overton, 1977). Although collecting data through on-site surveys is typically laborious and expensive, time and financial costs were offset by a Crater Lake National Park Science and Learning Fellowship, which provided housing and funding for survey administration.
26
Surveys were conducted on paper, with an incentive of a raffled iPad for participation. Surveys were administered daily from 10 AM until 4 PM.
To ensure unbiased representativeness of the results, every other visitor was intercepted and asked to complete the survey. If pedestrian traffic in the visitor center was particularly heavy, every third visitor was asked to complete the survey. Respondents were asked to read and sign an informed consent form approved by the Institutional Review Board at NC State University. If a group of visitors was selected, the individual with the most recent birthday was asked to take the survey; this helped ensure group leaders were not oversampled (they tend to be predominantly older white males). At the conclusion of the survey the
respondent was offered a chance to provide their email to the researcher to enter into a raffle for an iPad. The total number of visitors that were intercepted but declined to take the survey were tallied after each sampling effort to calculate a response rate.
Analysis
As the nature of this study is exploratory, the majority of conclusions drawn will come from general descriptive statistics of the responses. Analysis will also be performed using methods such as the chi-square test of independence to determine if there are
27
reached. With further research and different kinds of questions asked, other kinds of statistical analyses can provide more insight into visitor preferences.
RESULTS Survey Response Rate
Data were collected at the Steel Visitor Center at the base of the caldera and the entrance of the Xanterra Gift Shop in the Rim Village complex. Survey administration was designed to occur on an alternating basis, but due to weather constraints, the Xanterra Gift Shop entrance was surveyed slightly less than the Steel Visitor Center (11 days and 12 days, respectively). The survey response rates are reported in Table 5.
Table 5: Survey Response Rate
Accepted Declined Total Response Steel Center Visitor Center 273 142 415 66% Xanterra Gift Shop at Rim Village 307 189 496 62%
Total 580 331 911 64%
General Demographic and Trip Information
Results indicate the majority of respondents visiting Crater Lake National Park during data collection were predominantly Caucasian, college-educated, and middle-aged
28
NPS. The vast majority of respondents had some form of college degree, with 30% of respondents holding bachelor’s degrees and 35% holding advanced degrees (Table 6).
Table 6: Demographic Characteristics of Visitors to Crater Lake National Park
Demographic Characteristics Number of Respondents Percentage of Respondents Gender (n=556)
Male 298 54%
Female 258 46%
Age (n=554)
15-24 72 13%
25-34 128 23%
35-44 108 19%
45-54 114 21%
55-64 87 16%
65+ 45 8%
Education (n=554)
Less than 9th grade 2 <1%
9th-12th grade, no
diploma
13 2%
High school graduate 34 6%
Some college, no degree
91 16%
Associate’s degree 50 9%
Bachelor’s degree 168 30%
Graduate or
professional degree
196 35%
Ethnicity (n=546)
White/Caucasian 468 86%
Black or African American
4 <1%
Hispanic or Latino 13 2%
Asian 17 3%
American Indian 9 2%
Pacific Islander 1 <1%
Some other
race/multiracial/other
29
Respondents generally traveled to the park in smaller groups of less than 6 individuals (81% of respondents) (Table 7). The majority of respondents were first time visitors to Crater Lake National Park (65% of respondents). Over half of the respondents were only traveling through the park for one day (66% of respondents) (Table 7).
Table 7: Trip Characteristics of Visitors to Crater Lake National Park
Trip Characteristics Number of Respondents
Percentage of Respondents Group Size (n=555)
1 28 5%
2 183 33%
3-6 241 43%
7-10 60 11%
11+ 44 8%
First Visit (n=555)
Yes 361 65%
No 194 35%
Length of Stay (n=555)
Less than 4 hours 165 30%
4-8 hours 200 36%
Overnight (1-2 days) 138 25%
Overnight (3+ days) 52 9%
Chi-square tests of independence were performed to explore possible associations between respondents’ trip characteristics to the park. The relationship between how long respondents were staying at the park and group size was significant, χ2 (12, N = 555) =
30
the park and whether or not it was their first visit, χ2 (3, N = 555) = 10.662, p = 0.014. First
time visitors spent less time at the park than those who had visited before. These were the only significant relationships found between respondents’ trip characteristics.
Objective 1: Evaluate visitors’ social media behaviors and preferences.
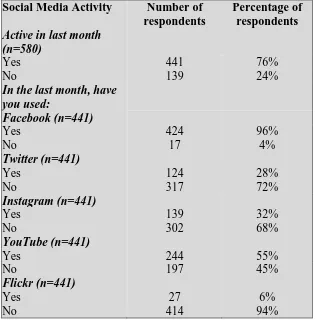
The majority of respondents visiting Crater Lake National Park (75%) indicated using social media in the month prior to completing the survey (Table 8). Facebook was the most frequently used social media platform, with 96% of respondents indicating they were active on social media identifying Facebook as a regularly used platform. The least frequently used social media platform was Flickr, with only 6% of respondents indicating they were active on it (Table 8).
A chi-square test of independence was performed to determine any significant relationships between survey respondents’ social media use and both their general
demographic characteristics and what information preferences they have for individual social media platforms. The relationship between first time visitors and use of social media was found to be significant, χ2 (1, N = 555) = 5.009, p = 0.025. First time visitors were more
likely to use some form of social media (in general, not specifically for planning their visit) than those who had previously visited the park. The relationship between group size and the use of social media was also found to be significant, χ2 (4, N = 555) = 14.399, p = 0.006. A
31
Table 8: Social Media Usage by Visitors to Crater Lake National Park
The majority of survey respondents (67%) indicated they were active on Facebook at least once a day. The predominant reasons behind the use of Facebook was reported as keeping in contact with family and friends (87%), keeping in contact with one’s extended social network (48%) and to find and share information (42%) (Table 9).
Social Media Activity Number of respondents
Percentage of respondents Active in last month
(n=580)
Yes 441 76%
No 139 24%
In the last month, have you used:
Facebook (n=441)
Yes 424 96%
No 17 4%
Twitter (n=441)
Yes 124 28%
No 317 72%
Instagram (n=441)
Yes 139 32%
No 302 68%
YouTube (n=441)
Yes 244 55%
No 197 45%
Flickr (n=441)
Yes 27 6%
32
Table 9: Facebook Usage by Visitors to Crater Lake National Park
Facebook Usage/Preferences Number of respondents Percentage of respondents (n=424)
How often do you use Facebook?
Several times a day 163 38%
Once or twice daily 123 29%
Several times a week 64 15%
Once or twice a week 48 11%
Monthly 26 6%
What are your main reasons?
To keep in contact with friends and family
371 87%
To stay informed of others in your extended social network
202 48%
Entertainment purposes
63 15%
To express your opinions
58 14%
To find and share information
122 42%
33
Table 10: Twitter Usage by Visitors to Crater Lake National Park
Twitter Usage/Preferences Number of respondents Percentage of respondents (n=124)
How often do you use Twitter?
Several times a day 20 16%
Once or twice daily 19 15%
Several times a week 18 15%
Once or twice a week 26 21%
Monthly 41 33%
What are your main reasons?
To keep in contact with friends and family
26 21%
To stay informed of others in your extended social network
41 33%
Entertainment purposes
27 22%
To express your opinions
26 21%
To find and share information
61 49%
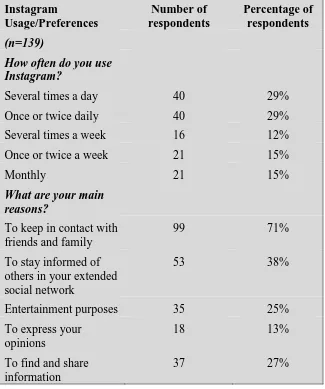
The number of respondents who reported using Instagram was not significantly higher than the number who reported using Twitter; however, the amount of time spent on the two platforms differed notably. More than half of the Instagram users (60% of
34
respondents indicating they use Instagram were active on the platform at least once a day (80%); they reported that they used the site primarily to keep in contact with family and friends (71%) (Table 11).
Table 11: Instagram Usage by Visitors to Crater Lake National Park
Usage/Preferences
Number of respondents
Percentage of respondents (n=139)
How often do you use Instagram?
Several times a day 40 29%
Once or twice daily 40 29%
Several times a week 16 12%
Once or twice a week 21 15%
Monthly 21 15%
What are your main reasons?
To keep in contact with friends and family
99 71%
To stay informed of others in your extended social network
53 38%
Entertainment purposes 35 25%
To express your opinions
18 13%
To find and share information
37 27%
35
(79% of respondents) and being able “to find and share information” (44% of respondents) were indicated as the main reasons for the use of YouTube (Table 12).
Table 12: YouTube Usage by Visitors to Crater Lake National Park
YouTube
Usage/Preferences
Number of respondents
Percentage of respondents (n=244)
How often do you use YouTube?
Several times a day 30 12%
Once or twice daily 37 15%
Several times a week 65 26%
Once or twice a week 59 24%
Monthly 53 22%
What are your main reasons?
To keep in contact with friends and family
14 6%
To stay informed of others in your extended social network
21 9%
Entertainment purposes 195 79%
To express your opinions
10 4%
To find and share information
108 44%
36
Flickr widely (Garrison & Li, 2014), these results are not encouraging nor do they support the continued use of Flickr as a popular National Park Service social media platform.
Table 13: Flickr Usage by Visitors to Crater Lake National Park
Flickr Usage/Preferences Number of respondents Percentage of respondents (n=27)
How often do you use Flickr?
Several times a day 1 4%
Once or twice daily 4 15%
Several times a week 1 4%
Once or twice a week 4 15%
Monthly 15 56%
What are your main reasons?
To keep in contact with friends and family
4 15%
To stay informed of others in your extended social network
4 15%
Entertainment purposes 4 15%
To express your opinions
2 7%
To find and share information
18 67%
Objective 2: Assess preferences for the specific types of information to be disseminated via social media by Crater Lake National Park.
37
Table 14: Visits to Crater Lake Social Media Pages
Have you visited the Crater Lake National Park official:
Number of respondents
Percentage of respondents
Facebook page? (n = 424) 40 9%
Twitter page? (n = 124) 2 2%
Flickr page? (n = 27) 2 7%
Slightly more than half of respondents (54%) who reported using Facebook indicated they would prefer to receive park related information such as current weather and trail conditions from the Crater Lake Facebook page. Slightly less than half of respondents (46%) indicated a desire to receive information about recreation activities available in the park via Facebook (Table 15).
38
Table 15: Crater Lake Specific Information preferred on Facebook
Crater Lake specific content on Facebook (n=424)
Number of respondents
Percentage of respondents Information about
current weather/trail conditions at the Park
231 54%
Information about the Park‘s natural and cultural history
171 40%
Information about available recreational activities in the Park
196 46%
Information about wildlife that can be seen within the Park
148 35%
Information about getting to/from the Park
154 36%
Information about local amenities and activities around the Park
156 37%
Other 38 9%
39
Table 16: Crater Lake Specific Information preferred on Twitter
Crater Lake specific content on Twitter (n=124) Number of respondents Percentage of respondents Information about current weather/trail conditions at the Park
65 52%
Information about the Park’s natural and cultural history
31 25%
Information about available recreational activities in the Park
45 36%
Information about wildlife that can be seen within the Park
33 27%
Information about getting to/from the Park
30 24%
Information about local amenities and activities around the Park
34 27%
Other 7 6%
None 27 22%
40
Table 17: Crater Lake Specific Information preferred on Instagram
Crater Lake specific content on Instagram (n=139) Number of respondents Percentage of respondents Information about current weather/trail conditions at the Park
72 52%
Information about the Park’s natural and cultural history
56 40%
Information about available recreational activities in the Park
62 45%
Information about wildlife that can be seen within the Park
69 50%
Information about getting to/from the Park
31 22%
Information about local amenities and activities around the Park
49 35%
Other 17 12%
None 21 15%
41
Table 18: Crater Lake Specific Information preferred on YouTube
Crater Lake specific content on YouTube (n=244)
Number of respondents
Percentage of respondents Information about
current weather/trail conditions at the Park
81 33%
Information about the Park’s natural and cultural history
131 54%
Information about available recreational activities in the Park
106 43%
Information about wildlife that can be seen within the Park
134 55%
Information about getting to/from the Park
62 25%
Information about local amenities and activities around the Park
81 33%
Other 12 5%
None 47 19%
42
Table 19: Crater Lake Specific Information preferred on Flickr
Crater Lake specific content on Flickr (n=27)
Number of respondents Percentage of respondents Information about current weather/trail conditions at the Park
6 22%
Information about the Park’s natural and cultural history
9 33%
Information about available recreational activities in the Park
6 22%
Information about wildlife that can be seen within the Park
7 26%
Information about getting to/from the Park
4 15%
Information about local amenities and activities around the Park
4 15%
Other 4 15%
None 5 19%
Objective 3: Assess trusted sources used to obtain trip-related information.
43
Chi-square tests of independence did not indicate any significant relationships regarding trusted information sources and visitor demographics, social media usage or information preferences.
Table 20: Trust in Various Sources of Park Related Information
I would not get my information
from this source.
N (%)
I would seek out information from
this source, but I would be cautious
about trusting it. N (%)
I would seek out information from this source, and I would always trust
it. N (%) Close friends and/or
family (n = 535)
27 (5%) 113 (21%) 395 (74%)
Coworkers and/or friends you would not consider close (n = 466)
62 (13%) 252 (54%) 152 (33%)
Online non-news source (n = 480)
70 (15%) 287 (60%) 123 (26%)
Material provided by a non-profit
organization/group (n = 455)
48 (11%) 249 (55%) 158 (35%)
Magazines (n = 458) 74 (16%) 229 (50%) 155 (34%) National Park
Service publications (n = 501)
44
Objective 4: Assess visitor preferences for Wi-Fi access on site.
Regarding Wi-Fi technology, the majority of respondents (62%) indicated they would support the NPS in providing Wi-Fi access at the park (Table 21). There was a very small minority of respondents (7%) that strongly opposed having Wi-Fi access on site, and an equally small number (7%) that somewhat opposed Wi-Fi access on site.
Table 21: Visitor Preferences for Wi-Fi Access on Site
Wi-Fi Access On Site
(n = 563) Number of
respondents
Percentage of respondents Strongly Support
232 41%
Somewhat support
119 21%
Neither support nor
oppose 131 23%
Somewhat oppose
41 7%
Strongly oppose
40 7%
45
Table 22: Wi-Fi Access and Higher Quality Recreation Experience
Wi-Fi would provide a higher quality
recreation experience (n = 563)
Number of respondents
Percentage of respondents Agree
270 48%
Disagree
141 25%
No opinion
152 27%
A chi-square test of independence was performed to examine possible relationships between respondents’ general demographic variables, their reported social media usage and their preferences regarding Wi-Fi access at the park. The relationship between visitor age and support for Wi-Fi access on site was found to be significant, χ2 (20, N = 555) = 42.641, p =
0.002. Additionally, visitor age was also significantly related to reporting that Wi-Fi access would lead to a higher quality recreation experience χ2 (10, N = 555) = 25.789, p = 0.004. Younger visitors were significantly more likely to be supportive of Wi-Fi access on site; they were also more likely to believe having Wi-Fi access would lead to higher quality recreation experiences.
46 DISCUSSION
Visitors’ online behavior in an increasingly technologically-integrated society could prove to be very useful for recreation resource managers, depending on how those managers choose to provide content to, interact with and promote park activities to visitors. This study offers some interesting insights into how, why and where visitors turn to for information they might want from park managers. Park managers should consider how the social media
platforms and alternative information sources discussed here might be best used for their own outdoor recreation areas.
General Demographic and Trip Information
Results from this study indicated the demographic composition of visitors to Crater Lake National Park is consistent with the average visitor demographic statistics nationally (based on survey respondents) (Solop, Hagen & Ostergren, 2003; Taylor, Grandjean & Gramann, 2011). Given this study did not find significant relationships between ethnicity and general use of social media, preferences for content or use of the Crater Lake Website to plan their trip, there are no specific recommendations that can be offered relative to the race and/or ethnicity of visitors and their preferences for park-related social media content.
47
information could be a cost effective method of communicating with younger first time visitors.
Providing visitors (regardless of age or demographic background) with information before their trip could also potentially enhance the trip for visitors that are not staying at the park for very long. Results from this study indicate that most of the survey respondents were only staying at Crater Lake National Park for one day. If managers could communicate with these visitors before they arrive and make them aware of any changing conditions at the park or potential activities particular aspects of the park the visitors might enjoy, the visitor could be better prepared for their trip and their experience could be enhanced. Having information readily available could provide visitors with a greater sense of control over their visit.
Providing information about the park’s recreation resources via social media could also enhance visitors’ awareness of available opportunities. Each visitor brings different motivations and preferences to their outdoor recreation experience (Manning, 1999), and access to information about different activities available to them would allow visitors to plan an experience that is personally relevant. The majority of visitors were traveling in groups of between 3 and 6 people, with the results suggesting the larger the group’s size, the more likely they are to stay at the park for a shorter period of time. Given visitors in larger groups are only at the park for a limited amount of time, managers should attempt to make trip-relevant information available to visitors as early as possible before their trip.
Objective 1: Evaluate visitors’ social media behaviors and preferences
48
primarily to keep in contact with their social network. Flickr and Twitter, by comparison, were used primarily for finding and sharing information. Dissimilarly, YouTube was used primarily for entertainment purposes (almost exclusively). These findings provide managers with important information regarding how different social media platforms can be used to disseminate the information more likely to be read or viewed by future visitors. No previous empirical study has identified content-platform preferences among visitors to publicly managed outdoor recreation resources.
Figure 2: Purpose of Social Media Usage by Respondents
49
using Facebook as the primary social media account could be extremely useful for park managers. Content posted on other social media platforms should be linked to the park’s Facebook page in order to more effectively spread information to individuals that might only be active on Facebook.
50
Table 23: A Call to Action Social Media Specific Actions
Action Objective Description
Step by Step Create deep connections between a younger generation and parks through a series of diverse park experiences. Stop talking and
listen
Learn about the challenges and opportunities associated with connecting diverse communities to the great outdoors
and our collective history.
Arts afire Showcase the meaning of parks to new audiences through dance, music, visual arts, writing, and social media. Go digital Reach new audiences and maintain a conversation with all
Americans by transforming the NPS digital experience to offer rich, interactive, up-to-date content from every park
and program.
Out with the old Engage national park visitors with interpretive media that offer interactive experiences, convey information based on current scholarship, and are accessible to the broadest range
of the public.
The National Park Service also recognizes that younger audiences are more present on social media than their older counterparts, and that having a presence on these platforms would increase their exposure to these younger groups. These initiatives might not all
51
Objective 2: Assess preferences for the specific types of information to be disseminated via
social media by Crater Lake National Park.
Visitors expressed clear preferences for the kinds of park-related information they preferred from different social media platforms. Facebook was primarily preferred for obtaining information regarding weather and/or trail conditions, directions to the park, recreational activities and local amenities and activities. Other platforms were preferred secondarily for varying kinds of content, which is important to note for managers after they post content to Facebook initially.
52
YouTube (followed closely by Instagram) was also the preferred platform for obtaining information regarding the park’s natural and cultural history and wildlife seen at the park (Figures 7 and 8). The reasoning for this might be similar to visitor preferences for visual information regarding activities and amenities. It appears that visitors would like to preview what they are going to experience at the park via visual content.
53
Figure 3: Social Media Platform Preferences for Weather and/or Trail Condition Content
54
Figure 5: Social Media Platform Preferences for Recreational Activities Content
55
Figure 7: Social Media Platform Preferences for Natural and/or Cultural History Content
56
While the preferences expressed by survey respondents are not generalizable to other parks, it is important for managers to consider that visitors to their parks might have similar content-platform preferences. It is equally important for managers to present their park-related material to visitors on the platforms those visitors are most likely to use.
The social media platforms included in this research were considered because of their widespread use by the general public, but managers should also consider other new and emerging social media platforms such as Vine, Snapchat and Soundcloud that might gain popularity in coming years. The various abilities of different platforms have different
strengths that managers can and should leverage so the posting of park-related information is performed using the most useful and accessible platforms for distinct types of audio, video and text content.
Objective 3: Assess other sources used to obtain trip-related information.
Survey respondents indicated the most frequently used source of park-related
information was family and friends; however, this result also included those respondents that would only sometimes trust that information. The most trusted source of park-related
57
populations. Additionally, park-related information communicated through on-line social networks by individuals’ friends and followers may garner more attention than if that same information were to be disseminated by the agency itself (although data analyzed for this study suggest it would not be trusted as much).
Figure 9: Trusted Information Sources used by Visitors for Park-Related Information
This study indicates that although visitors are very active on social media, few of them had accessed the official National Park Service website for Crater Lake National Park, and even fewer had visited the park’s official Facebook page. For managers looking for greater exposure to potential visitor populations, using social media and starting
conversations with the current or potential visitors online could result in greater information sharing via individuals’ social networks. As this study shows, information disseminated by the National Park Service is the most trusted, but also the least used in terms of social media website usage.
27
62 70 48 74
33 113
252
287
249
229
59 395
152
123 158 155
409
Family Colleagues Online non-news
Non-profit Magazines NPS
Trust in Information Sources
58
Objective 4: Assess visitor preferences for Wi-Fi access on site.
An important consideration managers might need to take into account is providing Wi-Fi access to visitors on-site. For this study, the survey instrument did not indicate whether or not the Wi-Fi coverage was widespread in the park or freely provided, but the answers provided still indicate a strong visitor preference for Internet access on-site, especially among younger visitors. Anecdotally, many visitors expressed a desire to access important financial documents, make alternative travel plans or access trip-related information for a later point in their visit.
Figure 10: Visitor Support for Wi-Fi Access on Site
Providing Wi-Fi for visitors would necessitate an investment in park infrastructure, a consideration that managers should not take lightly. However, if the park resources allow managers to provide Wi-Fi for visitors, this study provides insight into visitor support for
232
119 131
41 40
Strongly Support
Somewhat Support
Neither Somewhat Oppose