Copyright2000 by the Genetics Society of America
Quantitative Trait Loci Affecting Components of Wing Shape in
Drosophila melanogaster
Erika Zimmerman, Arnar Palsson and Greg Gibson
Department of Genetics, North Carolina State University, Raleigh, North Carolina 27695-7614
Manuscript received September 27, 1999 Accepted for publication February 10, 2000
ABSTRACT
Two composite multiple regression-interval mapping analyses were performed to identify candidate quantitative trait loci (QTL) affecting components of wing shape in Drosophila melanogaster defined by eight relative warp-based measures. A recombinant inbred line design was used to map QTL for the shape of two intervein regions in the anterior compartment of the wing, using a high resolution map of retrotransposon insertion sites between Oregon-R and Russian 2b. A total of 35 QTL representing up to 23 different loci were identified, many of which are located near components of the epidermal growth factor-Ras signal transduction pathway that regulates vein vs. intervein decision making and vein placement. Over one-half of the loci were detected in both sexes, and just under one-half were detected at two different growth temperatures. Different loci were found to affect aspects of shape in each intervein region, confirming that the shape of the whole wing should be regarded as a compound trait composed of several developmental units. In addition, a reciprocal backcross design was used to map QTL affecting shape in the posterior compartment of the wings of 831 flies, using a molecular map of 16 allele-specific oligohybridization single nucleotide polymorphism (SNP) markers between two divergent inbred lines. A total of 13 QTL were detected and shown to have generally additive effects on separable components of shape, in both sexes. By contrast, 8 QTL that affected wing size in these backcrosses were nearly dominant in their effects. The results confirm at the genetic level that wing shape is regulated independent of wing size and set up the hypothesis that wing shape is regulated in part through the regulation of the length and positioning of wing veins, involving quantitative regulation of the activity of secreted growth factors.
O
RGAN and appendage development can be di- The principle of recombination mapping is that loci that affect a trait can be localized by virtue of their vided into two phases: the generation of positionalassociation with genetic markers that differ between two information across a field of cells and refinement of
parental strains and can be readily traced in progeny mature sizes and shapes. Molecular genetic dissection
generations. This approach was initially proposed by of wing development in Drosophila has delineated how
Sax(1923) using visible markers, but in recent years it the dorsal-ventral and anterior-posterior axes of the
has been adopted using anonymous molecular markers wing are established and how secreted morphogens
em-such as microsatellites, restriction fragment length poly-anating from these organizing regions set up the
loca-morphisms, and single nucleotide polymorphisms (SNPs). tions of the future wing veins, thereby providing a
gen-In interval mapping, estimates of the association be-eral description of pattern formation in the wing (see
tween genotype and phenotype are made throughout de Celis1998;MorataandSanchez-Herrero 1999;
the genome by using recombination probabilities be-StriginiandCohen1999 for reviews). Genetic
dissec-tween each pair of markers to estimate the likely geno-tion of the refinement phase may also follow from the
type at each position between the markers (Landerand analysis of individual mutations, but since shape is a
Botstein 1989). The statistical power and accuracy of quantitative phenotype it can also be studied using the
interval mapping can be increased further by the pro-methodologies of quantitative genetics. An
understand-cess of composite multiple regression-interval mapping ing of the genetic basis for variation in the degree of
(CIM;Zeng1993), in which the estimates of genotype-roundness or pointedness of wings, their breadth and
phenotype associations are conditioned on marginal narrowness, or in the asymmetric placement of
particu-associations elsewhere in the genome. While CIM does lar veins will require identification of polymorphisms
not have the resolution to support the positional cloning that affect these traits. The first step toward this end is
of new genes, it does support the mapping of QTL at a the identification of quantitative trait loci (QTL).
resolution of a few centimorgans, depending on marker density (Zeng1994). In Drosophila, this resolution com-bined with the existing detailed genetic map generally Corresponding author: Greg Gibson, Department of Genetics,
Gard-allows the identification of candidate genes that may be ner Hall, North Carolina State University, Raleigh, NC 27695-7614.
E-mail: [email protected] responsible for the QTL effects (Mackay1996).
Drs. Jeff Leips and Trudy Mackay at NCSU and have been
Wing shape presents an alternative model system to
described previously (Nuzhdinet al. 1997). They were raised bristle number (Mackay1996) for quantitative genetic
on standard cornmeal medium supplemented with live yeast.
dissection in Drosophila. The shape of each intervein In most cases, larval density was controlled by transferring 30 region (IVR) in wild-type flies is regulated indepen- first instar larvae from a collection plate to a single vial. The
two 25⬚ replicates were grown 3 months apart, but the two
dently of the shape of the other intervein regions
(Bird-18⬚replicates were grown concurrently.
sall et al. 2000). This observation is consistent with
Lines W6 and W29 (Gibsonandvan Helden1997) were
molecular genetic data that indicate that wing veins
chosen from a preliminary survey of wing shape in a dozen
are positioned according to cellular responses to the isofemale lines (Birdsallet al. 2000). Near-isogenic lines were secreted morphogens Decapentaplegic, Wingless, and generated by 15 generations of sib-pair inbreeding, at which
point each of the 16 molecular markers were scored to confirm
Hedgehog (StriginiandCohen1999). Moreover, the
that the parents were homozygous at each marker. The F1 shapes of intervein regions are remarkably constant
generation was set up with two pairs of W6 male and W29 virgin
across temperature and sex, despite the fact that female
females, and each of the backcrosses (BC) were performed
wings are uniformly 15% larger than male wings, as are between 15 single virgin F
1females and a male of the respective the wings of flies raised at 18⬚ rather than at 25⬚(see parental line. Between 10 and 15 2- to 3-day-old adults of each
sex were taken from each vial, for a total of 211 BC-W6 females,
de Moedet al. 1997;Jameset al. 1997 for recent
discus-212 BC-W6 males, 203 BC-W29 females, and 205 BC-W29
sions of reaction norms for wing size in Drosophila).
males. The crosses were performed at 25⬚.
Since cell number and cell size are affected by sex and
Markers:The genetic map for the RI lines was based on
temperature differently in particular regions of the the previously published set of retrotransposon insertion sites wing, we have argued that shape is defined by a mecha- in the lines, modified slightly by the removal of several adjacent
markers that did not show any recombination (J. Leipsand
nism that is independent of cell growth and density and
T. F. C. Mackay, unpublished results). This left a set of 81
proposed that the lengths of the wing veins may be
independent markers, including the Sparkle visible marker
critical in establishing genotype-specific wing shapes
on chromosome 4 (which did not show any significant QTL
(Birdsallet al. 2000). This hypothesis then establishes associations and is not considered further here). There is a
genes involved in vein-intervein determination and dif- single gap in the map on chromosome arm 2R, between mark-ferentiation as candidate genes for QTL affecting wing ers 50F and 57C, which were separated by⬎50 cM as a conse-quence of map expansion in recombinant inbred lines. QTL
shape.
located within the gap would be missed in our analysis. The
In this article we report the results of two different
terminal markers were at 1B, 19C, 21E, 60E, 61A, and 100A,
QTL mapping experiments that confirm that different which in all cases are very close to the telomeres (or centro-genes contribute to variation in each intervein region mere of the X).
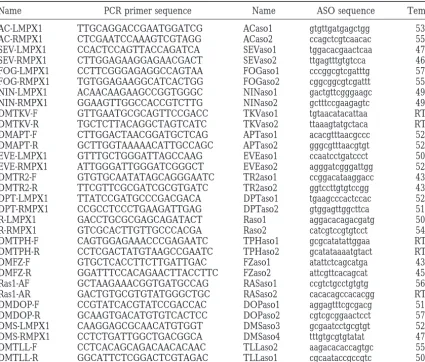
of the wing. The first experiment involved a set of 96 PCR primers and ASO sequences for each of the 16 markers used to map the BC populations are shown in Table 1. Each
recombinant inbred lines that derive from 2 isogenic
of the four combinations of backcross and sex yielded very
parental lines (Oregon-R and Russian 2b) that have
similar maps, so these were combined to generate a common
statistically indistinguishable overall wing shapes. The
map file for the QTL mapping. This enabled direct
compari-similarity is deceptive, though, since it is actually a result son of QTL locations across experiments in Figure 4, but may of complementary variation in anterior and central in- have slightly distorted the precise location of QTL peaks. The agreement between our genetic map and the published
cross-tervein regions. These lines had been genotyped
pre-over frequencies for the 16 markers was excellent, with the
viously according to the position of 94 roo transposons
exception of the DopR marker. DopR was initially mapped
on polytene chromosome squashes, which afforded the
to 35EF by an unpublished polytene hybridization squash
possibility of high resolution QTL mapping (Nuzhdinet (Gotzeset al. 1994), but genetically maps to the vicinity of al. 1997). The second experiment involved two isogenic cytological bands 88–89. The cDNA sequence is identical to
lines (W6 and W29) that were chosen for this study on sequence within BACR03J06, which maps to 88B, so we con-clude that the position defined by our recombination
frequen-the basis of morphological divergence in frequen-the posterior
cies is correct.
compartment of their wings. Approximately 200
individ-ASO genotyping (Saikiet al. 1986) was performed as follows. uals of each sex in backcrosses between F1progeny and A total of 20 l of PCR products generated with Taq DNA each parental type were genotyped at 16 SNPs using the polymerase were blotted directly from 96-well microtiter plates allele-specific oligohybridization (ASO;Saikiet al. 1986) onto nylon filters (Hybond N⫹; Pharmacia Biotech, Piscata-way, NJ) under vacuum and fixed by UV irradiation.32P end-method, providing low resolution mapping with the
op-labeled 15-mer allele-specific oligonucleotides were
hybrid-portunity to document the dominance of QTL effects.
ized to the filters in 10 ml of hybridization solution, and
QTL profiles in the experiments were not greatly
af-stringency washes were performed in 5⫻ SSPE, 0.1% SDS
fected by sex or growth temperature and suggest the at the temperatures indicated in Table 1. Hybridization was involvement of known regulatory genes in the refine- detected by autoradiography after between 2 and 8 hr of exposure according to the age of the probe. Both the perfect
ment of wing shape.
match and mismatch probes were hybridized to all filters, providing a control for success of the PCR reactions. Fewer than 5% of the genotypes for 16 markers across 831 individuals MATERIALS AND METHODS
(584/13,296) were represented as missing data.
Morphometrics:Wings were dissected from both sides of
Flies:The set of 96 recombinant inbred (RI) lines derived
TABLE 1
PCR and ASO oligonucleotide sequences
Name PCR primer sequence Name ASO sequence Temp.a
AC-LMPX1 TTGCAGGACCGAATGGATCG ACaso1 gtgttgatgagctgg 53
AC-RMPX1 CTCGAATCCAAAGTCGTAGG ACaso2 ccagctcgtcaacac 55
SEV-LMPX1 CCACTCCAGTTACCAGATCA SEVaso1 tggacacgaactcaa 47
SEV-RMPX1 CTTGGAGAAGGAGAACGACT SEVaso2 ttgagtttgtgtcca 46
FOG-LMPX1 CCTTCGGGAGAGGCCAGTAA FOGaso1 cccggcgtcgatttg 57
FOG-RMPX1 TGTGGAGAAGGCATCACTGG FOGaso2 cggcggcgtcgattt 55
NIN-LMPX1 ACAACAAGAAGCCGGTGGGC NINaso1 gactgttcgggaagc 49
NIN-RMPX1 GGAAGTTGGCCACCGTCTTG NINaso2 gctttccgaagagtc 49
DMTKV-F GTTGAATGCGCAGTTCCGACC TKVaso1 tgtaacatacattaa RT
DMTKV-R TGCTCTTACAGGCTAGTCATC TKVaso2 ttaaagtatgctaca RT
DMAPT-F CTTGGACTAACGGATGCTCAG APTaso1 acacgtttaacgccc 52
DMAPT-R GCTTGGTAAAAACATTGCCAGC APTaso2 gggcgtttaacgtgt 52
EVE-LMPX1 GTTTGCTGGGATTAGCCAAG EVEaso1 ccaatcctgatccct 50
EVE-RMPX1 ATTGGGATTGGGATCGGGCT EVEaso2 agggatcgggattgg 52
DMTR2-F GTGTGCAATATAGCAGGGAATC TR2aso1 ccggacataaggacc 43
DMTR2-R TTCGTTCGCGATCGCGTGATC TR2aso2 ggtccttgtgtccgg 43
DPT-LMPX1 TTATCCGATGCCCGACGACA DPTaso1 tgaagcccactccac 52
DPT-RMPX1 CCGCCTCCCTGAAGATTGAG DPTaso2 gtggagttggcttca 51
R-LMPX1 GACCTGCGCGAGCAGATACT Raso1 aggacacagacgatg 50
R-RMPX1 GTCGCACTTGTTGCCCACGA Raso2 catcgtccgtgtcct 54
DMTPH-F CAGTGGAGAAACCCGAGAATC TPHaso1 gcgcatatattggaa RT
DMTPH-R CCTCGACTATGTAAGCCGAATC TPHaso2 gcatataaaatgtact RT
DMFZ-F GTGCTCACCTTCTTGATTGAC FZaso1 atattctcagcatga 43
DMFZ-R GGATTTCCACAGAACTTACCTTC FZaso2 attcgttcacagcat 45
Ras1-AF GCTAAGAAACGGTGATGCCAG RASaso1 ccgtctgcctgtgtg 56
Ras1-AR GACTGTGCGTGTATGGGCTGC RASaso2 cacacagccacacgg RT
DMDOP-F CCGTATCACGTATCCGACCAC DOPaso1 aggagtttcgcgacg 51
DMDOP-R GCAAGTGACATGTGTCACTCC DOPaso2 cgtcgcggaactcct 57
DMS-LMPX1 CAAGGAGCGCAACATGTGGT DMSaso3 gcgaatcctgcgtgt 52
DMS-RMPX1 CCTCTGATTGGCTGACGGCA DMSaso4 tttgtgcgtgtatat 47
DMTLL-F CCTCACAGCAGACAACACAAC TLLaso2 aagacacaccagtgc 55
DMTLL-R GGCATTCTCGGACTCGTAGAC TLLaso1 cgcaataccgccgtc 50
aTemp., wash temperature.
then flattened with a cover slip held in place with a piece of We also performed QTL analyses directly on principal com-ponents of the correlation matrix of the Procrustes landmark tape. Low magnification images were captured as TIFF files
in Adobe Photoshop using a SPOT camera mounted on a coordinates (DrydenandMadia1998) using JMP Version 3 (SAS Institute1995) and on ratio measures specific to each Nikon Eclipse E-800 microscope attached to a Dell Dimension
350 computer and stored digitally on compact discs for later compartment. Principal component analysis yielded almost identical results for the first and second relative warps but measurement. Area and length ratios were calculated as
de-scribed inBirdsall et al. (2000) directly with Scion Image slightly divergent results for the third ones. The correlation between the values of the first two measures for each individual software [a PC version of NIH Image (Rasband1995),
down-loaded from http://www.scioncorp.com]. Landmark coordi- in each experiment was⬎0.95 and⬎0.6 for the third measure. Note that several of the QTL identified for the third warp nates at the junctions of longitudinal veins with the wing
margin or crossveins were also captured with this program were not seen with the corresponding principal component measure.
and then transferred to a Microsoft Excel worksheet.
Relative warps were calculated with the TPSRelw program of For the results presented in the figures and tables, relative warps were calculated on three separate data sets: the 25⬚and Rohlf(1993) downloaded from http://www.stonybrook.edu/
morphometrics. This program first transforms shapes defined 18⬚ replicates of the RI lines and the combined W6⫻ W29 backcrosses. Line means for each sex (for the RI sets) were by the landmark coordinates into generalized least squares
Procrustes shapes by reducing them to unit area and rotating calculated as least squares means using PROC GLM in SAS (SAS Institute1990) and individual means (for the BC set) them to an optimal alignment. It then computes the principal
warps for the tangential configuration of the total data set (1 were calculated directly in Microsoft Excel, from the relative warp scores for each individual wing. All analyses were re-for IVR-B and IVR-D; 2 re-for IVR-C), the partial warps that
describe the vectors that transform each individual shape from peated using relative warp scores calculated from the reduced data sets for each sex or backcross separately (data not shown). the consensus shape, and finally the relative warps. Relative
warps can be thought of as principal components of the local This had no marked effect on the shape of the QTL profiles, providing added confidence in the robustness of the statistical shape transformations, namely of the positions of the
QTL analysis:QTL were identified using model 6 in QTL Cartographer Windows Version 1.01 (Basten et al. 1999)
downloaded from http://statgen.ncsu.edu/qtlcart/, with ei-ther 5 or 10 background parameters (chosen by forward step-wise regression) and a 10-cM window size. As shown in Table 3, the number of background parameters affects the likelihood ratios, as well as the estimates of additive effects. In general, the lower number of background parameters leaves more significant peaks, while the higher number increases the likeli-hood ratios of the most significant peaks. We present both in the interest of a balance between conservatism and reducing the false negative detection rate. Significance thresholds were determined by 100 random permutations of each relative warp data set, with 1% and 5% values set by the highest, and highest
Figure1.—Range of variation in wing morphology. Images five, peak likelihood ratios. A likelihood ratio ⬎3.86
corre-of male right wings with anterior up and distal to the right. sponds to a 0.05 alpha value for each marker considered alone,
(A and B) Two RI lines that show greater than average breadth but the permutation thresholds are needed to confront the
(A, R15) or narrowness (B, R03) in both intervein regions in problem that multiple comparisons are performed (seeZeng
the anterior compartment. (C and D) Similar differences in 1994 for a discussion of statistical thresholds in composite
overall wing shape can arise from variation restricted to IVR-D multiple regression-interval mapping).
in the posterior compartment, as typified by lines W6 (C) and Since several of the QTL exceed the threshold for only one
W29 (D). Female wings are 15% larger, but show essentially of the background parameters, these should be regarded as
the same shape differences. b, IVR-B; c, IVR-C; d, IVR-D. marginally significant, but it should also be noted that many
of them are associated with peaks in both sexes and tempera-tures, which increases confidence that they correspond to true
QTL. To test whether individual QTL were sex or environment By contrast, the outline shapes of W6 (a line from
specific, two-way ANOVA was performed with the genotype Capetown, South Africa) and W29 (a Kenyan line) are (G) of the nearest marker, the sex (S) or temperature (E),
significantly different, in large part due to the difference
and the G⫻S or G⫻E interactions as dependent variables.
in breadth of IVR-D, which is distal to the posterior
For the RI line experiment, the genotypes of markers nearest
crossvein and defined by the fourth and fifth
longitudi-each significant QTL for the particular trait were included as
covariates. For the BC experiment, a similar procedure was nal veins, as shown in Figure 1, C and D. IVR-B and
used to test for dominance, by assigning BC6 homozygotes IVR-C do not have significantly different shapes in these and BC29 heterozygotes as class A, BC6 heterozygotes and
two lines. To identify QTL affecting the shape of IVR-D,
BC29 homozygotes as class B, and testing the G⫻Class
inter-we have scored wing shape in slightly more than 200
action.
flies of each sex, grown at both 25⬚ and 18⬚, in both backcross directions, that is, between F1females and W6
RESULTS or W29 males. We also present an analysis of wing size,
which is not correlated with wing shape in this cross. Wing shape variation in two sets of crosses:The
out-Shape can be measured in a number of ways, includ-line shapes of the wings of Oregon-R and Russian 2b
ing the geometric morphometric technique of relative flies are very similar, but differences in vein location
warp analysis (Bookstein1991). Relative warps capture lead to differences in shape of the IVRs defined by the
the principal components of local shape transforma-second and third (IVR-B) and third and fourth (IVR-C)
tions, and are a strictly relative measure since they are wing veins. In Oregon-R flies, IVR-C is relatively narrow
calculated by reference to the consensus shape (or “tan-and IVR-B is relatively broad, whereas the opposite
situa-gent configuration”) for the entire data set under con-tion pertains to Russian 2b flies. This difference is not
sideration. Despite the high degree of algebraic manipu-simply due to a shift in placement of the third vein, or
lation, the resultant measures capture much more of the accommodation of increased breadth of one IVR by loss
between-line variation than do more intuitive measures, of breadth of the other (Guerraet al. 1997), because
such as length-to-breadth ratios, and have the advan-recombinant inbred lines derived from a cross between
tages of distinguishing different aspects of shape and the two lines can be narrow or broad in both IVRs, as
not being biased by preconceptions. shown in Figure 1, A and B. The shape of each of
The effects of each relative warp can be seen visually these IVRs must then be regulated independently of
by plotting consensus coordinates of the flies with the one another. The number of rows of cells across each
highest and lowest values for each relative warp (Figure IVR is significantly, but only weakly, correlated with the
2). For IVR-C in the recombinant inbred lines, relative length-to-breadth ratio (R2⬍0.2; P⬍0.001, ANOVA),
warp 1 (hereafter C1) captures some of the breadth of indicating that IVR shape is a function of more than
the intervein region, but is most strongly affected by just the number of cells between veins. To begin to
the position of the posterior crossvein. C2 is highly cor-characterize the genetic architecture of these shape
dif-related with the length-to-breadth ratio (data not shown) ferences, we have conducted a QTL analysis of the shape
and is a good measure of compartment width, while of both wings in five flies of two replicates of each sex,
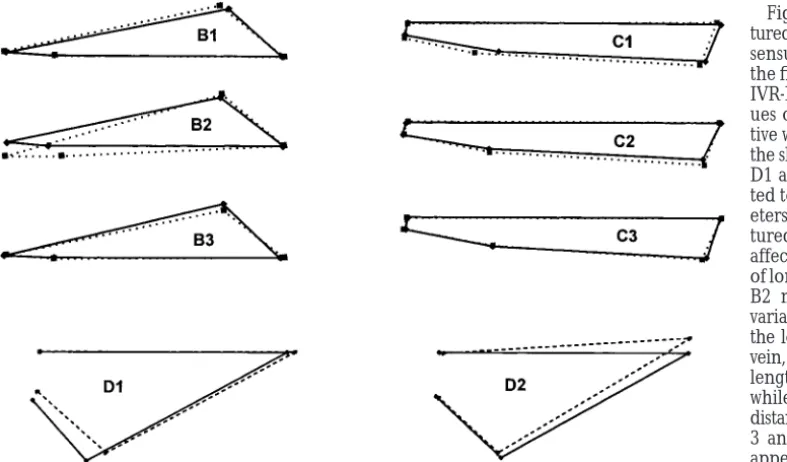
Figure2.—Shape variation cap-tured by relative warps. The con-sensus Procrustes coordinates of the five RI lines (or individuals for IVR-D) with the most extreme val-ues of each of the indicated rela-tive warps that account for 90% of the shape variation (B1–B3; C1–C3; D1 and D2) are aligned and plot-ted to show the most likely param-eters of the transformations cap-tured by each warp. B1 and B3 affect the location of the junction of longitudinal veins 1 and 2, while B2 may capture more proximal variation. C1 is heavily affected by the location of the posterior cross-vein, C2 most closely captures the length-to-breadth ratio of IVR-C, while C3 has a subtle effect on the distance between longitudinal veins 3 and 4 at the wing margin. D1 appears to affect the length and placement of the posterior cross-vein and distal portion of longitudinal cross-vein 5, while D2 is related to the length of the distal longitudinal cross-vein 4 and its placement at the wing margin. Despite the marked differences in shape of IVR-D, the number of cells along the wing margin in this region was not significantly different in this cross (data not shown).
IVR-B, B1 and B3 are related to breadth while B2 ap- of the wing:QTL affecting wing shape were identified using the CIM algorithm implemented by model 6 in pears to be strongly influenced by the location of the
anterior crossvein. For IVR-D in the W6 by W29 back- QTL Cartographer (Zeng 1994; Basten et al. 1999).
Throughout, effect estimates were obtained at 1-cM in-crosses, only two relative warps are considered, and
while there are a variety of ways to align the consensus tervals, with background markers chosen at a minimum spacing of 10 cM. Since peak locations and heights de-shapes, it appears that D1 captures the relative length
and location of the distal portion of longitudinal vein termined by CIM are sensitive to the number of back-ground markers used to condition estimates within each 5, while D2 captures shape variation closer to the wing
margin. interval, results are presented in Table 3 for both 5 and 10 background markers. Experiment-wide 5% and 1% Summary statistics for each cross are presented in
Table 2. Sex does have a significant effect on each of likelihood ratio thresholds were determined by permu-tation analysis and had values of 9–11 and 13–17, depend-the relative warps, which causes depend-the means to deviate
from zero, but these effects are small relative to between- ing on which warp and sex was considered. Consequently, QTL peaks are listed only if they exceed a likelihood line differences, as seen by the range of scores. When
relative warps are determined independently by sex or ratio of 15 in either conditioning background (5 or 10 background markers), or 10 with both conditions. temperature, the absolute values differ markedly, but
the correlation between values is extremely high, and as For the anterior compartment of the wing, recombi-nant inbred line means for each sex and temperature a result QTL profiles are almost identical. This indicates
that the relative warp measures are remarkably robust were calculated from 20 wings, namely the left and right sides of five individuals of each of two replicate vials. within a cross. In all cases the relative warp scores were
normally distributed, although there were three lines QTL profiles with 10 conditioning markers are shown in Figure 3 for two representative relative warps, B1 and with higher than expected values of C1 and B2.
Within-line variance was typically just twice the between-side C2, with 18⬚ females shown by bold lines, 25⬚females by regular lines, 18⬚males by hairlines, and 25⬚males by variance within an individual, and these two sources of
error accounted for between 20 and 30% of the total dotted lines. The three chromosomes are represented from left to right, corresponding to cytological map phenotypic variance. The two parents in each cross were
separated by between four and six standard deviation positions from 1 to 100, and marker locations are indi-cated by a short vertical line beneath each plot. Peaks units for each relative warp score. In the following
analy-sis, QTL effects were estimated in standard deviation are numbered according to their listing in Table 3. A total of 35 QTL were identified, corresponding to units on the basis of the least-squares line means (or
relative warps studied. Just over one-half of the QTL (20/35) were present in both sexes, and just under one-half of them (15/35) were present at both temperatures. These fractions should be considered as underestimates since several QTL were associated with peaks that ex-ceeded the marker-wise, but not experimentwise, sig-nificance threshold in sex and temperature combina-tions other than those listed in Table 3 and so are likely to be false negatives. A total of 13 QTL were found in just one sex and temperature combination, while 4 were common to all four combinations.
These results establish that a common suite of genes is responsible for much of the variation in wing shape, independent of variables that affect wing size, such as sex and growth temperature. Examples of apparently male-specific (B1.4), female-specific (B1.2, B1.3, and C1.3), and 18⬚-specific (B1.4, B2.7, and C2.4) QTL sug-gest that sex- and temperature-specific genetic factors may exist, underlining the genetic complexity of the trait. However, two-way ANOVA failed to confirm the statistical significance of these specificities, so that a more critical interpretation is that QTL analysis in crosses derived from parents that are separated by just a few environmental standard deviation units has low power to repeatedly detect specific QTL. This view is consistent with the presence of a further eight loci that were present in three of the four analyses.
Each intervein region, and each relative warp within a region, appears in the main to be regulated by different genes, as expected from the low genetic correlation between shapes of intervein regions and the fact that each warp captures a slightly different aspect of shape (see also Birdsall et al. 2000). However, six loci at
similar genetic locations were identified in both IVRs, which may reflect the fact that IVR-B and IVR-C are both bounded by the third longitudinal vein. Effects with opposite signs, indicating that the increasing allele derived from different parents, were found for five of the relative warps, the exception being the third warp of IVR-B. Only three QTL were found for C1 (compared with between five and seven for the other warps) even though it accounted for more than half of the shape variance for IVR-C. This may be attributed to the high variance in the placement of the anterior crossvein rela-tive to the other landmarks and suggests that this aspect of shape is affected by a few alleles with stronger effects than those that account for variation elsewhere in the wing. Average QTL effects ranged from 0.2 to 0.8 stan-dard deviation units of the particular relative warp. The proportion of the variance explained for each relative warp ranged from 10 to 70%, but there is no obvious way to express the proportion of the overall shape variation explained by individual QTL.
QTL analysis of shape in the posterior compartment of the wing: For IVR-D in the posterior compartment of the wing, we measured the relative warps of just over
TA BL E 2 Summary statistics for relative warp scores 25 ⬚ 18 ⬚ 25 ⬚ B1 B2 B3 C1 C2 C3 B1 B2 B3 C1 C2 C3 D1/6 D1/29 D2/6 D2/29 乆 Mean 6.06 1.87 3.51 1.15 4.19 2 .11 5.21 4.05 2.29 0.88 3.74 0.82 13.6 0.9 6 .3 1.2 乆 SD 0.89 0.93 0.47 1.20 0.47 0 .35 12.13 7.92 5.60 17.88 5.60 3.50 14.7 12.7 9 .7 7.7 乆 Range 40.5 52.9 23.9 71.8 21.3 16.6 69.5 42.8 25.7 108.2 2 9.6 18.2 7 0.7 74.9 5 6.0 49.6 么 Mean ⫺ 6.47 ⫺ 1.71 ⫺ 3.32 ⫺ 1.80 ⫺ 4.19 ⫺ 2.03 ⫺ 5.50 ⫺ 3.99 ⫺ 2.29 ⫺ 1.39 ⫺ 3.63 ⫺ 0.69 1 5.1 ⫺ 11.4 ⫺ 1.3 ⫺ 6.3 么 SD 0.86 0.84 0.58 1.16 0.48 0 .35 11.39 7.61 6.38 17.48 5.53 3.47 14.9 13.7 9 .0 7.0 么 Range 40.3 47.6 25.7 79.0 19.7 16.7 69.7 38.9 30.1 106.2 3 1.8 18.5 7 5.8 76.8 4 4.9 36.9 % V ariance 50.8 29.9 16.1 60.5 19.6 10.3 52.1 28.5 16.2 70.9 14.7 6.8 68.6 1 6.0 D1/6 and D1/29 are values associated with D1 for BC6 and BC29, respectively. The sign of each warp is arbitrary, so these have been adjusted for IVR-B a nd IVR-C to make the m ean values positive for females and n egative for m ales. Ranges and standard deviations (SD) are among line m eans for IVR-B and IVR-C, and a mon g individuals for IVR-D. All values are 1000 times the actual values reported by TPSRelw.
Figure3.—QTL profiles for relative warps in the anterior wing. Likelihood ratios (LR) are plotted against chromo-somal location for relative warps B1 (top) and C2 (bottom), us-ing results from the analysis with 10 background parameters. The value of the LR at each position in the genome reflects the probability of an associa-tion between the genotype at that position and the pheno-type. Peaks in the profile repre-sent locations of putative QTL. The experimentwise LR signifi-cance threshold for B1 at 25⬚ was 11.2, and for C2 was 10.5. B1.5 and C2.5 may actually rep-resent two QTL, but by conven-tion are regarded as single peaks since the troughs in the likelihood distribution do not drop below the significance threshold.
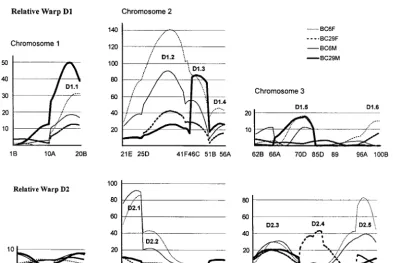
against the locations of 16 molecular markers. Relative rized in Table 4. Particularly for D1, this is likely to be an underestimate of the number of QTL, as the effect of warps D1 and D2 explained, respectively, 68 and 16%
of the total shape variance and were associated with six the QTL centered near the centromere on chromosome arm 2L (D1.2) was so large that it may be due to several and five QTL peaks as plotted in Figure 4 and
TABLE 4
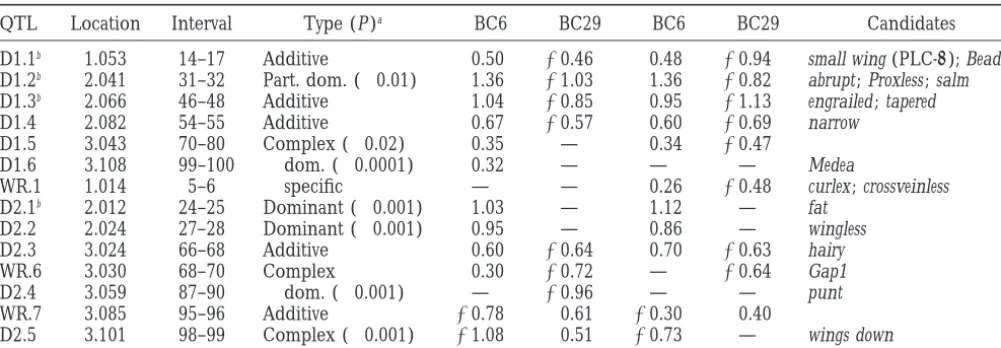
Wing shape QTL identified in W6⫻W29 backcrosses
QTL Location Interval Type (P )a 乆BC6 乆BC29 么BC6 么BC29 Candidates
D1.1b 1.053 14–17 Additive 0.50 ⫺0.46 0.48 ⫺0.94 small wing (PLC-␥); Beadex
D1.2b 2.041 31–32 Part. dom. (⬍0.01) 1.36 ⫺1.03 1.36 ⫺0.82 abrupt ; Proxless ; salm
D1.3b 2.066 46–48 Additive 1.04 ⫺0.85 0.95 ⫺1.13 engrailed ; tapered
D1.4 2.082 54–55 Additive 0.67 ⫺0.57 0.60 ⫺0.69 narrow
D1.5 3.043 70–80 Complex (⬍0.02) 0.35 — 0.34 ⫺0.47
D1.6 3.108 99–100 乆dom. (⬍0.0001) 0.32 — — — Medea
WR.1 1.014 5–6 么specific — — 0.26 ⫺0.48 curlex ; crossveinless
D2.1b 2.012 24–25 Dominant (⬍0.001) 1.03 — 1.12 — fat
D2.2 2.024 27–28 Dominant (⬍0.001) 0.95 — 0.86 — wingless
D2.3 3.024 66–68 Additive 0.60 ⫺0.64 0.70 ⫺0.63 hairy
WR.6 3.030 68–70 Complex 0.30 ⫺0.72 — ⫺0.64 Gap1
D2.4 3.059 87–90 乆dom. (⬍0.001) — ⫺0.96 — — punt
WR.7 3.085 95–96 Additive ⫺0.78 0.61 ⫺0.30 0.40
D2.5 3.101 98–99 Complex (⬍0.001) ⫺1.08 0.51 ⫺0.73 — wings down
Estimates of additive effects in standard deviation units for the cross and sex.
aNumbers in parentheses refer to level of significance of inference regarding dominance (see text). bAlso detected as WR QTL.
linked loci. The large span of these QTL compared to tivity in QTL Cartographer (data not shown), as well as by testing interaction terms of nearest markers by two-those identified for the anterior compartment is due
to the much larger separation between ASO markers way ANOVA as indicated in Table 4. In all but two cases the IVR-D QTL had effects in the direction predicted (average 20 cM) compared with retrotransposon
inser-tion sites (average 3 cM). The extremely high likelihood from the differences between the parental lines. The additivity of wing shape effects is in marked con-ratios associated with the majority of the peaks can be
attributed to the increased number of individuals com- trast to the dominance of each of eight QTL for overall wing size detected in the same W6 by W29 backcross pared with the recombinant inbred line experiment. It
also attests to the low environmental noise associated experiment. Two of these size QTL had large effects exceeding one standard deviation unit. Positive and neg-with relative warp measures.
QTL were also detected for a more direct measure ative effects were found in both parents, which is not surprising since the two lines were not preselected for of shape, the length-to-breadth ratio of the entire wing.
Four of the seven peaks identified with this measure size differences. Only one size QTL was specific for a single sex (WS5 in females, P⫽0.03), which is consistent corresponded to relative warp QTL. This confirms that
much of the shape difference between W6 and W29 with the fact that the magnitude of the difference in size between the sexes is fairly constant across lines. This wings is confined to IVR-D. The remaining three wing
ratio (WR) QTL may indicate factors that regulate aspects result also contrasts with the sex specificity of more of the shape effects and reinforces the conclusion that size of posterior wing shape not captured by relative warps,
or they may be due to variation elsewhere in the wing. and shape are regulated by different suites of genes. Candidate genes within the QTL intervals are indicated Performance of a double backcross experiment
al-lowed us to estimate the dominance of QTL effects, in Table 5, and notably include the genes wingless, fat,
small wing, messy, and Hairless, all of which have been
simply by contrasting the estimates of the effects in
each cross. Only 2 of the 13 different QTL for shapes found by mutational analysis to affect aspects of cell growth and division.
appeared to be completely dominant, while the remain-der were essentially additive, or showed some partial dominance. The correspondence between the sexes was
DISCUSSION
remarkably high for this analysis. Only D1.1, D2.4, and
D2.5 were confirmed to be sex specific by significance Meaning of QTL peaks:Two different strategies have been used to map QTL affecting components of wing of the genotype-by-sex interaction term in ANOVA of
the nearest-marker genotype (P⫽0.02, 0.005, and 0.03, shape in the anterior and posterior compartments of the wing. These have resulted in profiles with different respectively), although 3 other QTL showed some trend
toward sex specificity in the degree of dominance. Domi- resolution and significance levels, but nevertheless iden-tify several highly significant QTL for each intervein nance effects were confirmed by combining the two
nonaddi-TABLE 5
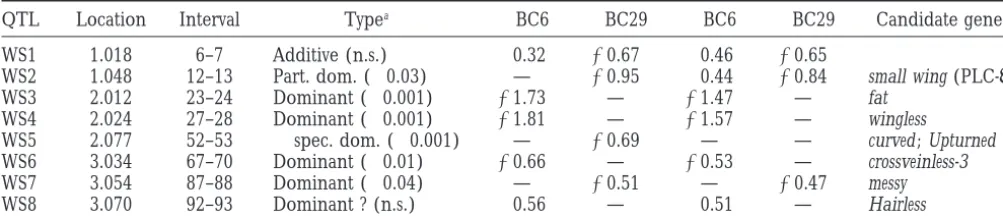
Wing size QTL identified in W6⫻W29 backcrosses
QTL Location Interval Typea 乆BC6 乆BC29 么BC6 么BC29 Candidate genes
WS1 1.018 6–7 Additive (n.s.) 0.32 ⫺0.67 0.46 ⫺0.65
WS2 1.048 12–13 Part. dom. (⬍0.03) — ⫺0.95 0.44 ⫺0.84 small wing (PLC-␥)
WS3 2.012 23–24 Dominant (⬍0.001) ⫺1.73 — ⫺1.47 — fat
WS4 2.024 27–28 Dominant (⬍0.001) ⫺1.81 — ⫺1.57 — wingless
WS5 2.077 52–53 乆spec. dom. (⬍0.001) — ⫺0.69 — — curved ; Upturned
WS6 3.034 67–70 Dominant (⬍0.01) ⫺0.66 — ⫺0.53 — crossveinless-3
WS7 3.054 87–88 Dominant (⬍0.04) — ⫺0.51 — ⫺0.47 messy
WS8 3.070 92–93 Dominant ? (n.s.) 0.56 — 0.51 — Hairless
Estimates of additive effects in standard deviations units for the cross and sex.
aNumbers in parentheses refer to level of significance of inference regarding dominance (see text).
multiple individuals, which leads to reduction in the other trait measures such as length-to-breadth ratios, the geometric morphometric measures increase the environmental component of variance, and that it has
allowed the generation of a high density genetic map number and significance of QTL peaks identified. They also break shape variation down into components that (Nuzhdinet al. 1997), with the result that most QTL
peaks are localized to⬍2 cM, and usually a single cyto- appear to capture biologically reasonable shape vectors, such as the location of a crossvein, or breadth near the logical band. The Oregon-R and Russian 2b lines were
not preselected for any differences in wing shape, and wing margin. However, there is no strong reason to expect that they actually capture vectors of underlying in fact the wing shape differences between them by no
means cover the range of variation seen in even the gene effects, which operate over unknown distances within the developing imaginal discs. Consequently, the anterior intervein regions in Drosophila melanogaster, yet
the RI lines allowed efficient detection of QTL. relative warps are likely only to be correlated with as-pects of shape variation that could be detected if we The W6 and W29 lines by contrast were chosen on
the basis of divergent wing shapes following inbreeding, could precisely know the cell biological mechanisms underlying variation in wing morphology. This in turn and this divergence turned out to be restricted to IVR-D.
Our analysis demonstrates the feasibility of mapping implies that the observed QTL probably underestimate the number and magnitude of QTL effects for the wing QTL between any two wild-type lines of interest. The
advantages of the backcross design are that it allows traits. Several peaks at or close to the significance thresh-old appear in the analysis, but there is no way of knowing estimation of dominance effects and takes less than a
month to perform the crosses once the near-isogenic whether these would attain significance with a perfect way to characterize wing shape.
parental lines have been constructed. In principle,
be-tween 20 and 40 PCR products can be obtained from The major drawback of relative warps is that the mea-sures cannot be contrasted directly between two differ-the genomic DNA of a single fly, allowing a low to
moderate resolution QTL map to be generated with ent crosses. This is true of any measure that captures the difference between individuals and a standard shape just a few months of marker genotyping. Microsatellite
(Schuget al. 1998) and single nucleotide polymorphism that is specific to each cross. In principle, different crosses could be contrasted if the standard shape was (Teeteret al. 1999; http://www4.ncsu.edu/ⵑggibson)
marker collections have been described that will allow set in advance, perhaps as the grand mean for the spe-cies (note that this is not true of direct principal compo-rapid QTL mapping with F2, backcross, or recombinant
inbred line designs. Although the peaks identified with nent analysis of landmark coordinates). However, it is likely that any QTL that also have a significant effect in this method may only be mapped to within two or three
cytological intervals, and linked QTL may often go unre- a second cross will also be identified in that cross, even though they may be associated with different relative solved, the availability of the complete genome
se-quence will allow higher resolution mapping. SNPs are warps. If the goal of the QTL analysis is to identify the loci that have a significant effect on the trait, the logical sufficiently frequent that they can be identified with
efficiency by sequencing 500-bp PCR products from the strategy is to use the statistically most powerful proce-dure to locate the QTL and then follow up with func-parental lines (Teeter et al. 2000), allowing a second
phase of mapping, if necessary, with a fresh set of indi- tional studies of the mechanism by which they affect the trait (Liuet al. 1996), once candidate genes in the
viduals.
Relative warp and principal component analysis of region have been identified. Several of the QTL de-scribed here lie in the vicinity of peaks identified by landmark coordinates are highly efficient methods for
chro-mosome contribution to wing shape using a very differ- with those derived from a sample of permutations of four random markers in the same experiment. We modi-ent trait measure, but no statistical comparison of our
results has been attempted. fied this test for multiple traits by summing the number of times the marker closest to each candidate gene ex-Candidate genes for QTL affecting wing shape: In
this study we have identified over a dozen strong QTL ceeded the experiment-wide 5% significance threshold for each warp of IVR-B and IVR-C in both sexes of the affecting various aspects of wing shape and have
evi-dence for up to a dozen other loci with less strong 25⬚recombinant inbred experiment. One trouble with this test is that a priori clustering of candidate genes is effects. In general, different loci affect the shapes of
each intervein region, and these loci can act for the somewhat arbitrary. Nevertheless, each of the groups (EG FR, vn, argos, and ve : 4 loci, 7 peaks), (EG FR, vn, most part in both sexes and independent of the effect
of temperature. Within a species, crosses between just argos, ve, dpp, tkv, put, sax, and shn: 9 loci, 12 peaks),
and (EG FR, vn, argos, ve, bs, dpp, tkv, put, sax, shn, en, two lines will not generally segregate all of the
quantita-tive trait loci affecting any given trait (Mackay1996). wg, apt, and vg : 14 loci, 16 peaks) fall within the top
3% of 50,000 random permutations of sets of an equal Some QTL may be due to rare alleles that by chance
are present in the parental lines, but there is no way to number of markers spaced at 10-cM intervals on the RI map. These tests provide some support for associations address this question without considerably more
popula-tion sampling. The results suggest, in agreement with between wing shape and, respectively, the EGF receptor-ligand complex, the EGF and transforming growth fac-those ofWeberet al. (1999), that up to 50 loci
through-out the genome may have a significant and generally tor- receptor-ligand combinations, and a general set of wing patterning genes.
additive effect on wing shape in D. melanogaster. This
would place one candidate gene every two or three Overall wing shape is correlated with the breadth of the distal proximal region of the wing (Birdsallet al.
cytological intervals, which is about one-half of the
den-sity of genes known from Mendelian phenotypes to af- 2000), so it is interesting that several of the QTL for IVR-D are located in the vicinity of candidate genes fect wing shape.
Nevertheless, the locations of QTL peaks listed in whose names indicate a general role in wing shape: fat,
narrow, tapered, Proxless, abrupt, and small wing. The roles
Tables 3 and 4 provide some hints as to the nature of
the developmental pathways that contribute to variation of most of these genes in wing development have yet to be characterized in any detail, and several of them in shapes of the intervein regions. Most notably, 6 of the
21 putative candidate genes for IVR-B and IVR-C are have yet to be cloned, so it is not possible to say whether they may operate in a common pathway. Engrailed, spalt, located in the same cytological band as components of
the epidermal growth factor (EGF)-Ras signaling path- and wingless are particularly interesting candidates given their fundamental roles in wing patterning, but their way that regulates vein vs. intervein cell determination
(reviewed inFreeman1998;Nagarajet al. 1999). These involvement would be more strongly supported if other genes with which they interact were also implicated as are the EG FR, the ligands encoded by spitz and argos
(Simcox 1997), the cofactor rhomboid/veinlet (Gui- QTL.
Only a few QTL in the W6 by W29 cross appear to be chardet al. 1999), and two components of the
intracel-lular signal transduction cascade, Ras1 and drk (Simon associated with wing size as well as wing shape, consistent with the low phenotypic correlation between these traits.
et al. 1993). Four other genes, spalt, emc, messy, and ventral
veinless, interact genetically with this pathway and may Given the low resolution of the molecular map, it is impossible to say at this point whether the common represent target genes. Two genes, schnurri and punt,
are components of the Decapentaplegic morphogen QTL peaks are due to the same candidate genes, such as small wing and wingless. One argument against them signaling pathway that initially defines where the
longi-tudinal veins will form. Furthermore, the region of 62A being the same is the observation that most of the factors affecting wing shape only show partial dominance, or to 65F that includes emc, veinlet, vvl, and divergent showed
a complex set of peaks that were unresolved in some additivity, while those affecting wing size are essentially dominant. This remarkable feature of the genetic archi-analyses (see peak C2.5 in Figure 3) and may also
in-clude the EGF receptor (EGFR) ligand vein and the tecture may relate to the roles of directional and balanc-ing selection in shapbalanc-ing the genetic variation of differ-intracellular regulator of signal transduction, sprouty, as
candidate genes. A priori, the Wingless, Hedgehog, and ent aspects of wing morphology, or to a difference in the frequency of rare recessives affecting size vs. shape. Notch signaling pathways might have been expected to
be implicated in the regulation of wing shape, but there A more interesting possibility is that the degree of domi-nance is a function of the underlying physiology of gene is no strong evidence implicating these pattern
forma-tion mechanisms (see Flybase for extensive references). activity affecting the two processes (KacserandBurns 1981; Mayo and Burger 1997). Identification of the A test for the significance of association with a set of
candidate genes has been proposed byKeightleyet al. genes that are actually responsible for the QTL effects will be the necessary next step in the quantitative genetic (1998), who summed the LOD scores of four genes
Utility of QTL mapping in Drosophila: Despite the 1996a,b), and the final distribution of cells is in large part a function of cell migration and differentiation obvious advantages of flies for quantitative genetic
map-ping, only two morphological traits have been analyzed (Gonzalez-Gaitan et al. 1994). It is thus not obvious
that genes involved in pattern formation should be the previously by interval mapping methods: bristle number
(Mackay1996) and male genital morphology (Liu et major contributors to quantitative variation for wing shape. Despite their proximity to known genes, many
al. 1996). Progress with the respect to the latter has been
limited by the paucity of information on the genetics of the QTL that we have identified could actually be as yet uncharacterized genes, with roles in processes such of development of the genital disc, but the wealth of
information on neurogenesis in Drosophila has led to as local cell growth, cytoplasmic reorganization, cuticle profound advances in our understanding of quantitative secretion, and metabolic processes. For statistical rea-aspects of bristle development. Building on QTL associ- sons, the resolution of QTL analysis is not great enough ations, Mackay, Langley, and co-workers have begun to to support positional cloning of candidate genes (Dar-identify quantitative trait nucleotides within several of vasiet al. 1993;Boehnke1994). Consequently, the con-the candidate genes (Laiet al. 1994;Longet al. 1998). firmation that a particular gene is in fact a candidate The results reported here establish wing shape as an- gene requires corroboration using independent genetic other trait with great potential for understanding the strategies such as quantitative complementation testing molecular basis of morphological variation, given the (Longet al. 1996;LymanandMackay1998;A. Palsson advanced state of knowledge concerning wing pat- andG. Gibson,unpublished results) and allelic associa-terning mechanisms. tion studies (LongandLangley1999). Application of Even without knowledge of the genes that correspond these methods will provide a test of the proposition to QTL, our results provide several insights into the cell that molecular variation in candidate genes identified biology of variation in wing shape. First, they confirm through mutational screens is truly responsible for phe-that genetic effects on overall wing shape are likely to be notypic variation in Drosophila wings.
mediated through local effects on wing shape, including We thank Kelly Ratcliff and Kelli Birdsall for help with dissections the placement of wing veins. The genetic dissociation and landmark capture; Kate Teeter and Sylvie van Helden for per-between wing size and wing shape supports the con- forming the preliminary analyses of wing shape; Rob Gasperini and Lynn Stam for help in establishing the ASO method; Trudy Mackay, tention that regulation of cell size and number
Sergei Nuzhdin, and Elena Pasyukova for genotyping and providing (McCabeet al. 1997) is only one mechanism by which
the RI lines; and Jeff Leips for the RI line genetic map. This work wing shape may be controlled. AlthoughWeber(1992)
was supported by a fellowship from the David and Lucille Packard has clearly demonstrated that genetic variation for cell Foundation to G.G.
density in small patches of the wing blade exists, the independence of wing shape from the effects of sex and growth temperature, both of which greatly affect wing
LITERATURE CITED
size, suggests that shape may be more directly regulated
than size. Basten, C. J., B. S. Weirand Z-B. Zeng,1999 QTL Cartographer Windows, Version 1.01.
The possibility that the EGF pathway is a major source
Birdsall, K., E. Zimmerman, K. TeeterandG. Gibson,2000 Ge-of variation for the shapes Ge-of intervein regions is consis- netic variation for the positioning of wing veins in Drosophila tent with our recent proposal that the wing veins are melanogaster. Evol. Dev. 2: 16–24.
Boehnke, M.,1994 Limits of resolution of genetic linkage studies: important determinants of wing shape (Birdsallet al.
implications for the positional cloning of human disease genes. 2000). By regulating the amount of vein material that Am. J. Hum. Genet. 55: 379–390.
differentiates, this pathway may directly affect the length Bookstein, F. L.,1991 Morphometric Tools for Landmark Data: Geometry and Biology. Cambridge University Press, New York.
of each longitudinal vein. During and after
metamor-Bookstein, F. L.,1994 Combining the tools of geometric morpho-phosis, the tensile properties of veins would allow them metrics in Advances in Morphometrics (NATO AIS Series A, Life to perform the role of a scaffold, or of drawstrings, that Sciences, Vol. 284), edited byL. Marcus, M. Corti, A. Loy, G.
NaylorandD. Slice.Plenum, New York. pulls the intervein regions into shape (Waddington
Darvasi, A., A. Weinreb, V. Minke, J. I. WellerandM. Soller, 1940). On this view, cell density, at a quantitative level, 1993 Detecting marker-QTL linkage and estimating QTL gene is established as a secondary response to vein length. effect and map location using a saturated genetic map. Genetics
134:943–951. This does not preclude the regulation of cell growth
de Celis, J. F.,1998 Positioning and differentiation of veins in the and cell division, through genes such as spalt and
wing-Drosophila wing. Int. J. Dev. Biol. 42: 335–343.
less, from having an effect on wing shape, but it high- de Moed, G. H., G. de JongandW. Scharloo,1997 The phenotypic plasticity of wing size in Drosophila melanogaster : the cellular basis lights the reality that mechanisms that act during cell
of its genetic variation. Heredity 79: 260–267. division and pattern formation (including
“entelechy”-Dryden, I. L.,andK. V. Madia,1998 Statistical Shape Analysis. Wiley-like mechanisms; Garcia-Bellido and Garcia-Bel- Interscience, New York.
Freeman, M.,1998 Complexity of EGF receptor signalling revealed lido1998) are only one aspect of the regulation of wing
in Drosophila. Curr. Opin. Genet. Dev. 8: 407–411. shape.
Garcia-Bellido, A. C.,andA. Garcia-Bellido,1998 Cell prolifera-Wing imaginal discs undergo waves of expansion dur- tion in the attainment of constant sizes and shapes: the Entelechia
Gibson, G.,andS. van Helden,1997 Is function of the Drosophila Milan, M., S. CampuzanoandA. Garcia-Bellido,1996a Cell cy-cling and patterned cell proliferation in the wing primordium homeotic gene Ultrabithorax canalized? Genetics 147: 1155–1168.
of Drosophila. Proc. Natl Acad. Sci. USA 93: 640–645. Gonzalez-Gaitan, M., M. P. Capdevilaand A. Garcia-Bellido,
Milan, M., S. CampuzanoandA. Garcia-Bellido,1996b Cell cy-1994 Cell proliferation patterns in the wing imaginal disc of
cling and patterned cell proliferation in the Drosophila wing dur-Drosophila. Mech. Dev. 46: 183–200.
ing metamorphosis. Proc. Natl. Acad. Sci. USA 93: 11687–11692. Gotzes, F., S. BalfanzandA. Baumann,1994 Primary structure
Morata, G., andE. Sanchez-Herrero, 1999 Patterning mecha-and functional characterization of a Drosophila dopamine
recep-nisms in the body trunk and the appendages of Drosophila. Devel-tor with high homology to human D1/5 recepDevel-tors. RecepDevel-tors
opment 126: 2823–2828. Channels 2: 131–141.
Nagaraj, R., A. T. Pickup, R. Howes, K. Moses, M. Freemanet al., Guerra, D., M. C. Pezzoli, G. Giorgi, F. GaroiaandS. Cavicchi,
1999 Role of the EGF receptor pathway in growth and pat-1997 Developmental constraints in the Drosophila wing.
Hered-terning of the Drosophila wing through the regulation of vestigial. ity 79: 564–571.
Development 126: 975–985. Guichard, A., B. Biehs, M. A. Sturtevant, L. Wickline, J. Chacko
Nuzhdin, S. V., E. G. Pasyukova, C. L. Dilda, Z-B. ZengandT. F. C. et al., 1999 rhomboid and star interact synergistically to promote
Mackay,1997 Sex-specific quantitative trait loci affecting lon-EGFR/MAPK signaling during Drosophila wing vein
develop-gevity in Drosophila melanogaster. Proc. Natl. Acad. Sci. USA 94: ment. Development 126: 2663–2676.
9734–9739. James, A. C., R. B. AzevedoandL. Partridge,1997 Genetic and
Rasband, W.,1995 NIH Image. Springfield, VA. environmental responses to temperature of Drosophila
melanogas-Rohlf, F. J.,1993 Relative warp analysis and an example of its appli-ter from a latitudinal cline. Genetics 146: 881–890.
cation to mosquito wings, pp. 131–159 in Contributions to Morpho-Kacser, H.,andJ. A. Burns, 1981 The molecular basis of
domi-metrics, edited byL. F. Marcus, E. BelloandA. Garcia-Valedca-nance. Genetics 97: 639–666.
sas.Museo Nacional de Ciencias Naturales, Valsain, Spain. Keightley, P. D., K. Morris, A. Ishikawa, V. Falconerand F.
Saiki, R. K., T. L. Bugawan, G. T. Horn, K. B. MullisandH. A. Oliver, 1998 Test of candidate gene-quantitative trait locus
Erlich,1986 Analysis of enzymatically amplified beta-globin association applied to fatness in mice. Heredity 81: 630–637. and HLA-DQ alpha DNA with allele-specific oligonucleotide Lai, C., R. F. Lyman, A. D. Long, C. H. LangleyandT. F. C. Mackay, probes. Nature 324: 163–166.
1994 Naturally occurring variation in bristle number and DNA SAS Institute, 1990 SAS/STAT User’s Guide. SAS Institute, Inc., polymorphisms at the scabrous locus of Drosophila melanogaster. Cary, NC.
Science 266: 1697–1702. SAS Institute,1995 JMP Introductory Guide. SAS Institute, Inc., Cary, Lander, E. S.,andD. Botstein,1989 Mapping Mendelian factors NC.
underlying quantitative traits using RFLP linkage maps. Genetics Sax, K.,1923 The association of size differences with seed-coat
pat-121:185–199. tern and pigmentation in Phaseolus vulgaris. Genetics 8: 522–560. Liu, J., J. M. Mercer, L. Stam, G. Gibson, Z-B. Zenget al., 1996 Schug, M. D., K. Wetterstrand, M. Gaudette, R. Lim, C. Hutter Genetic analysis of a morphological shape difference in the male et al., 1998 The distribution and frequency of microsatellite loci genitalia of Drosophila simulans and D. mauritiana. Genetics 142: in Drosophila melanogaster. Mol. Ecol. 7: 57–70.
1129–1145. Simcox, A.,1997 Differential requirement for EGF-like ligands in Long, A. D.,andC. H. Langley,1999 The power of association Drosophila wing development. Mech. Dev. 62: 41–50.
studies to detect the contribution of candidate genetic loci to Simon, M. A., G. S. DodsonandG. M. Rubin,1993 An SH3-SH2-SH3 protein is required for p21Ras1 activation and binds to variation in complex traits. Genome Res. 9: 720–731.
Sevenless and Sos proteins in vitro. Cell 73: 169–177. Long, A. D., S. L. Mullaney, T. F. C. MackayandC. H. Langley,
Strigini, M., andS. M. Cohen, 1999 Formation of morphogen 1996 Genetic interactions between naturally occurring alleles at
gradients in the Drosophila wing. Semin. Cell. Dev. Biol. 10: 335– quantitative trait loci and mutant alleles at candidate loci affecting
344. bristle number in Drosophila melanogaster. Genetics 144: 1497–
Teeter, K., M. Naeemuddin, R. Gasperni, E. Zimmerman, K. White 1510.
et al., 2000 Haplotype di-morphism in a SNP collection from Long, A. D., R. F. Lyman, C. H. LangleyandT. F. C. Mackay,
Drosophila melanogaster. J. Exp. Zool. 288: 63–75. 1998 Two sites in the Delta gene region contribute to naturally
Waddington, C. H.,1940 The genetic control of wing development occurring variation in bristle number in Drosophila melanogaster.
in Drosophila. Genetics 25: 75–139. Genetics 149: 999–1017.
Weber, K.,1992 How small are the smallest selectable domains of Lyman, R. F.,andT. F. C. Mackay,1998 Candidate quantitative
form? Genetics 130: 345–353. trait loci and naturally occurring phenotypic variation for bristle
Weber, K., R. Eisman, L. Morey, A. Patty, J. Sparkset al., 1999 An number in Drosophila melanogaster : the Delta-Hairless gene region.
analysis of polygenes affecting wing shape on chromosome 3 in Genetics 149: 983–998.
Drosophila melanogaster. Genetics 153: 773–786. Mackay, T. F. C.,1996 The nature of quantitative genetic variation
Zeng, Z-B.,1993 Theoretical basis for separation of multiple linked revisited: lessons from Drosophila bristles. Bioessays 18: 113–121. gene effects in mapping quantitative trait loci. Proc. Natl. Acad. Mayo, O.,and R. Burger,1997 The evolution of dominance: a Sci. USA 90: 10972–10976.
theory whose time has passed? Biol. Rev. 72: 97–110. Zeng, Z-B.,1994 Precision mapping of quantitative trait loci. Genet-McCabe, J., V. FrenchandL. Partridge,1997 Joint regulation of ics 136: 1457–1468.
cell size and cell number in the wing blade of Drosophila