ISSN: 2319-8753
International Journal of Innovative Research in Science,
Engineering and Technology
(An ISO 3297: 2007 Certified Organization) Vol. 3, Issue 11, November 2014
Energy Efficient Error Detection in Data
Aggregation in WSN
Lithiya Sara Babu
1, N.Uma Maheswari
2P.G. Scholar, Department of Computer Science & Engineering, PSNA college of Engineering and Technology,
Dindigul, India1.
Professor, Department of Computer Science & Engineering, PSNA college of Engineering and Technology,
Dindigul, India2.
ABSTRACT: Wireless sensor networks are vulnerable to many types of security attacks, including data forgery, false data injection and eavesdropping. Sensor nodes can be compromised by intruders and the compromise nodes can distort data integrity by injecting false data. The transmission of error data depletes the constrained battery power and degrades the bandwidth utilization. False data can be injected by compromised sensor nodes in various ways, including data aggregation and relay. In WSNs, data aggregation is performed by sensor nodes, called data aggregators. This project is to detect false data injected by a data aggregator while performing data aggregation. Data aggregation is implemented in WSNs to eliminate data redundancy, reduce the energy consumption and improve data accuracy. To support data aggregation along with false data detection, every node will be monitored along with Naïve Bayes Detector and Fuzzy logic model. By using two detectors we can find the fault data easily and increase the accuracy of the network.
KEYWORDS:Data aggregation, Naive Bayes detector, Fuzzy logic.
I. INTRODUCTION
As the technology are improving, the demands of end users and their applications increasing. Event detection is one of the main components in numerous wireless sensor networks (WSNs) [2]. Sensor nodes can be compromised by intruders, and the nodes can affect the data integrity by injecting false data. False data can be injected by faulty sensor nodes in various ways by relaying and data aggregation. Data aggregation is essential to reduce data redundancy and/or to improve data accuracy, false data detection is critical to the provision of data integrity and efficient utilization of battery power.
To identify the possible faulty sensor node using Naïve Bayes framework. A new attribute end to end transmission time of each packet arrived at the sink is analysed for determining the network status. The fault detection technology can be generally classified as centralized approaches and distributed approaches. Briefly, the sink in the centralized approach usually has uninterrupted power supply and makes the diagnostic decisions by periodically injecting requests or quires for other nodes and waits for replies. In distributed approaches, the updated network status and individual node performance was assessed according to the status reporting messages from nodes or data comparison with the neighbours. We propose a method to effectively detect the fault data in aggregate node based on a fuzzy rule based system. We incorporate event semantics into the fuzzy logic rule-base to further improve the accuracy of event detection. Their results show that fuzzy logic improves the accuracy of event detection.
ISSN: 2319-8753
International Journal of Innovative Research in Science,
Engineering and Technology
(An ISO 3297: 2007 Certified Organization) Vol. 3, Issue 11, November 2014
battery failure and other environmental changes by battery power model and interference model. When a node is in low battery power, all services of the node will transfer to neighbouring nodes with the highest battery power. So that interchange of battery capacity information between nodes consumes extra energy from the usual node operations. To obtain more accurate data we propose fuzzy rule based model have proved to be very effective as classifiers. Fuzzy systems based on fuzzy if-rules have been successfully used in many applications areas [3].Fuzzy if-then rules were traditionally gained from human experts. [10] Recently, various methods have been suggested for automatically generating and adjusting fuzzy if-then rules without using the aid of human experts [5]. An adversary could physically compromise some sensor nodes and use them to launch false data injection attacks (FDIAs) in which the adversary inject false reports containing nonexistent events into the network [9]. There are several en-route filtering solutions, such as the statistical en-route filtering scheme (SEF), the interleaved hop-by-hop authentication scheme (IHA) [11],and key inheritance-based filtering scheme(KIF) [12]. All of these solutions can prevent reporting of non-existent events and save a large amount of energy resources and filter the false reports during the forwarding process. All of this scheme consist more complex report generation and en-route verification processes which may poses additional computation and communication overhead. So we go for Rule based system to determine an event is correct or forged.
II. RELATEDWORKS
This section briefly describes some of the works related to fault data detection in wireless sensor network. 2.1 Statistical En-route Filtering:
The first paper that address false data injection attacks in the presence of compromised nodes is Statistical En-route Filtering (SEF).It can probabilistically detect forged reports. If an event occurs, one detecting node will collect MACs from other nodes. Then the sensing report will be forwarded to the sink. The drawback of SEF is that, we cannot guarantee that a forged report can always be detected during forwarding. So for massive false data injection of attacks it is not suitable.
2.2 Interleaved hop-by-hop Authentication Scheme:
IHA will be verifies the report in a hop-by-hop fashion[11] and deterministic manner. It may consist of many drawbacks, one of that is when the protection may breaks down when more than a certain number of nodes (threshold value) along the path are compromised. Another one is it may rely on a deterministic key sharing. So that IHA can’t be used in a dynamic environment, which may restricts its usage for WSN as sensors could sleep or die. It will give an idea of associating nodes along a routing path together and leads us to using probabilistic key sharing in the design.
2.3 Key inheritance-based Filtering Scheme:
It prevents forwarding of false reports, the keys of each node used in the message authentication consist of its own key and the keys inherited from its upstream nodes[12]. Every authenticated report contains the combination of the message authentication codes generated by using the keys of the consecutive nodes in a path from the base station to a terminal node.
2.4 Fuzzy C-Means clustering:
In Fuzzy C-Means clustering (FCM) [7] a hierarchical network architecture was introduce, and that may detect routing attacks caused by abnormal flows of data in the network. Basic idea of Fuzzy C-Means clustering is that same types of data should be nearer, and the different types of data should be very far. So that the cluster heads are responsible for collection of all regions detection information and be convey the data to the base station at last for detection.
2.5 Using Agglomerative Clustering:
ISSN: 2319-8753
International Journal of Innovative Research in Science,
Engineering and Technology
(An ISO 3297: 2007 Certified Organization) Vol. 3, Issue 11, November 2014
III. SYSTEMARCHITECTURE
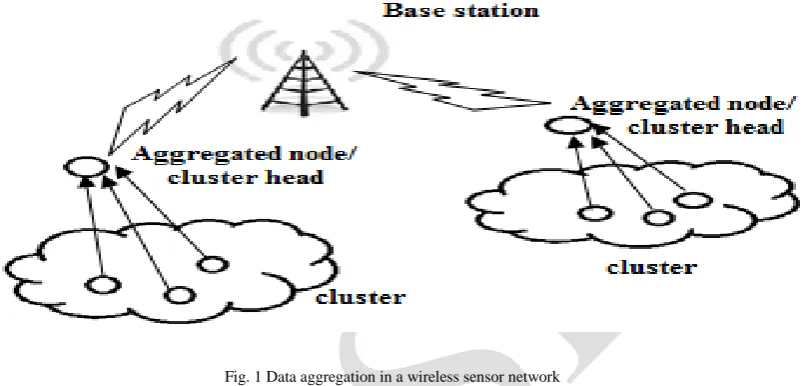
Cluster-based network developments and proposals have been designed to build a network for just one type of node, where all nodes in a network can communicate with any other nodes in their coverage area. The sensor nodes are divided into clusters, and each cluster has a cluster head which acts as an aggregator. Data’s in the network will be periodically collected and aggregated by the aggregator. The aggregator node can forwarded the aggregated data to the central base station through other aggregator node.
Fig. 1 Data aggregation in a wireless sensor network
Due to the low deployment cost requirement of wireless sensor networks, sensor nodes consist of simple hardware and several resource constraints. Hence, it is a challenging task to provide efficient solutions to data aggregation. Among these constraints, “to save battery power” is the most limiting factor in designing wireless sensor network protocols. Therefore, in order to reduce the power consumption of wireless sensor networks, Different mechanisms are proposed such as reduce radio forecast, control packet removal, topology control, and most importantly data aggregation. Data aggregation protocols aim to combine and summarize data packets of several sensor nodes so that amount of data transmission is reduced. An example for data aggregation scheme is presented in Fig 1, where a group of sensor nodes collect information from a target region. The clustering architectures provide many benefits. Reference shows the most important features of cluster-based architectures over ad hoc and sensor networks.
Clustered wireless sensor networks may have two important advantages, one is that it consist of reducing the volume of inter-node communication by localizing data transmission within the formed clusters and decreasing the number of transmissions to the sink node. The next one is that the clustered wireless sensor networks are capable of extending the nodes’ sleep times by allowing cluster heads to coordinate and optimize the activities.
IV. PROPOSEDWORK
In the proposed work a combination of Naive Bayes and Fuzzy rule based system to detect the fault node. So that we can obtain a network with less data redundancy, energy efficient and accurate data across the network.
4.1 Naive Bayes Classifier
A naive Bayesian classifier is a simple probabilistic classifier. That based on apply Bayesian theorem with well-built (naive) independence assumption. A naive Bayesian classifier assumes that the absence or presence of the given feature is unrelated to the absence or presence of any other feature, given the particular class variable [1].
Bayesian classifiers use Bayes theorem that may expressed as,
ISSN: 2319-8753
International Journal of Innovative Research in Science,
Engineering and Technology
(An ISO 3297: 2007 Certified Organization) Vol. 3, Issue 11, November 2014
p(Cj|d) = probability of instance d being in class Cj, p(d| Cj) = probability of generating instance d given class Cj, p(Cj) = probability of occurrence of class Cj,
p(d) = probability of instance d occurring.
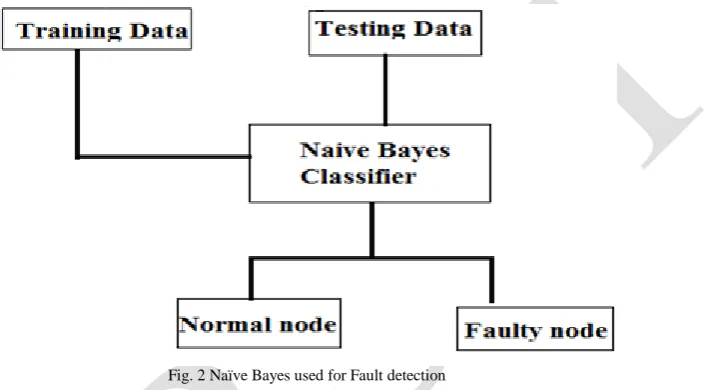
For example, we can say that apple is a fruit by considering its features such as about 3” in diameter, round and red .A naive Bayesian classifier considers each of the features independently to the probability that this fruit is an apple. Naive Bayes classifier is a supervised classification algorithm. That may uses to compute the well fit between a new observations of data with some previously observed data. The observations are separate feature vectors, with the Bayes assumption that the features are independent. In Fig 2 Naïve Bayes detection process will be shown
Fig. 2 Naïve Bayes used for Fault detection
From Fig 2 training phase of the naïve bayes algorithm calculates the probabilities of a theft given a particular attribute and then stores this probability. This is repeated for each attribute, and the amount of time taken to calculate the relevant probabilities for each attribute. In the testing phase, the amount of time taken to calculate the probability of the given class for each example in the worst case is proportional to n, the number of attributes. However, in worst case, the time taken for testing phase is same as that for the training phase.
4.1.1 Data set collection:
Data collected from 54 sensors deployed in the Intel Berkeley Research lab. Data was collected using the Tiny in-network query processing system, built on the TinyOS platform.
Input: Load packet and extract feature
1. Information of the packet such as transmission time and source Ids received by the sink were analyzed. 2. Network status could be normal or faulty.
2.1. If the class label is normal ,the network consists of no faulty node 2.2. If the class label is faulty, the network consists of at least one faulty node.
4.1.2. Training phase:
The training process was started from the data obtained from the normal class first and a minimum time value of each node was extracted as an anomaly detection threshold. In other words, the effect of faulty nodes to the transmission is depending on the position of faulty node within the topology.
ISSN: 2319-8753
International Journal of Innovative Research in Science,
Engineering and Technology
(An ISO 3297: 2007 Certified Organization) Vol. 3, Issue 11, November 2014
4.1.3 Testing phase:
Transmission time of each packet was grouped according to the source node and check whether the transmission path consists of any faulty node. To ease the confusion between congestion and real faulty node, every packet group was compared with its corresponding anomaly threshold. If group of transmission time is lower than the threshold value then, path having at least one faulty node. If one transmission time is value is lower, then it is assume that is caused by congestion instead of faulty node. Normal and conditional probability of values are compared, if conditional probability value is higher than normal value then this transmission time will be suspected from the faulty node.
To confirm the network status; last five transmission times are analysed by a Naive Bayes classifier, and determine network is consist of fault or normal. The entire packet group are analysed and the network status and suspicious fault node list are reported.
4.1.4 Algorithm: Fault Node Detection
Input : Test dataset, Packet Transmission time(Ts), Training dataset threshold value (TH ) Output: Class Label= Normal/Faulty Node. Step1: Compare each batch with Ts
1.1 If (B1,B2...Bn) < Ts Suspect abnormal node go to step 2
1.2 else
Conclude normal node
Step 2: Compare each batch of sensor node packet BP1....BPn with TH
1.1 If THmin <= BP1....BPn >= THmax. Label: normal node
1.2 else
Label: faulty node End
4.2 Fuzzy Rule Based Logic:
Fuzzy logic is defined as the logic of human thought. In Fig 3 shows Fuzzy based Anomaly Detection method [3] fault data will be detected and also classified the data that falls into the one category that is normal data or the fault data. We can get more accurate values than other methods while using fuzzy logic. From the output, data is classified as is normal data or the fault data.
Steps involved in the process
Input will be fuzzified.
Fuzzification will be done by membership functions.
ISSN: 2319-8753
International Journal of Innovative Research in Science,
Engineering and Technology
(An ISO 3297: 2007 Certified Organization) Vol. 3, Issue 11, November 2014
Fig. 3 Fuzzy based detection system
From the fig 3 we can see the overall functionality of the fuzzy logic, proposed a fuzzy logic based intrusion detection system to detect the fault node in WSN. This paper used combination of specification and anomaly based detection methods. This paper used fuzzy inference system for making the fuzzy rules to take the decision. There are some parameters for checking the behaviour of node is malicious or not.
4.2.1 Fuzzification process:
The normalized entropy values will be given as input for this method which decides the type of data. The normalized entropy values are
Source IP - IP address of the source
Destination IP -IP address of the destination Source port - Port number of the source
Destination port - Port number of the destination Packet byte size - Size of the packet
Packet type - Type of the packet (TCP, UDP, ICMP)
Time To Live – This is the field controls number of times a data packet can travel through the network. Payload - It is the part of the transmitted data
Packet count up - Total number of packets
No of different source & destination pair - Total number of source and destination pair. These are the testing data that may be taken from the Error Detection System.
4.2.2 Membership Functions:
Membership function defines the fuzziness in a fuzzy set irrespective of the elements in the set, which are discrete or continuous [18]. Membership function can be thought of as a technique to solve a problems on the basis of experience rather than a knowledge .Available membership functions are trapezoidal, Gaussian , triangular methods.
4.2.3 Inference rules:
Fuzzified output will be compared using inference rules then from the output data will be classified. So that we can said that the data is not normal otherwise the traffic is normal.
4.2.4 Defuzzification:
This is about output of the Fuzzification process. Output of data classification process:
ISSN: 2319-8753
International Journal of Innovative Research in Science,
Engineering and Technology
(An ISO 3297: 2007 Certified Organization) Vol. 3, Issue 11, November 2014
4.2.5 Algorithm: Detect Faulty Reading:
Input: sensed value by sensor ( Sj), Membership function(MF), Decision making (DM). Output: Class Label= Normal/Faulty Node
Step 1: Detect Faulty reading(Node) Step 2: for (i=0; i<n; i++)
2.1 send Sj to neighbours and request MF Step 3: if (DM = faulty node)
Suspect faulty node 3.1 else
Conclude normal node. end.
4.3 Error Detection Model:
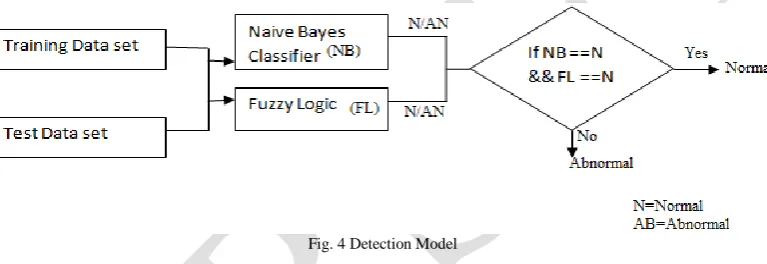
Detection model detects error in the network, so that we can improve the data accuracy and save the energy in the network. By using two detection models such as naive bayes and fuzzy logic overall accuracy and efficiency will be improved. According to this model faulty node and normal node will be identified easily. A secure and efficient network will be obtained.
Fig. 4 Detection Model
Figure 4 shows the overall detection model for fault node detection in WSN. Both the detectors will be accurately detecting the fault node in the network and it may give an efficient network. To support data aggregation along with false data detection, every node will be monitored along with Naïve Bayes Detector and Fuzzy logic model. By using two detectors we can find the fault data easily and increase the accuracy of the network.
V. EXPERIMENTALRESULT
This section deals with the experimental performance evaluation of our algorithm through simulations. In order to test our technique, the NS2 simulator [2.29] is used. We compare our proposed combined intrusion detection system (CIDS) technique with the single intrusion detection system (SIDS) technique.
5.1. Simulation Setup
In the simulation, the number of nodes is kept as 50. The nodes are arranged in a 500 meter x 500 meter square region for 60 seconds of simulation time. All nodes in the network have the same transmission range of 200 meters. The simulated traffic is TCP and Constant Bit Rate (CBR).
5.2 Performance Metrics
In our experiments, we measure the following metrics
ISSN: 2319-8753
International Journal of Innovative Research in Science,
Engineering and Technology
(An ISO 3297: 2007 Certified Organization) Vol. 3, Issue 11, November 2014
5.3 Results
Effect of Varying Rates: We vary the attack traffic rate as 50,100,150,200 and 250kb.
Fig. 5 Rate Vs Delivery ratio
Figure 5 shows the delivery ratio of our CIDS technique and SIDS. From the figure, we can see that packet delivery ratio is more in CIDS scheme when compared with SIDS scheme. So that we can tell that CIDS is more efficient.
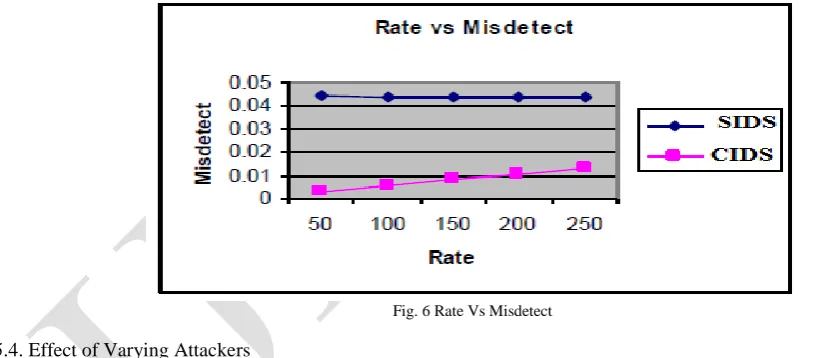
Figure 6 shows the misdetection ratio of CIDS technique and SIDS. From the figure, we can see that the misdetection ratio is significantly less in our CIDS scheme when compared with SIDS scheme, since it accurately detects the intrusion.
Fig. 6 Rate Vs Misdetect
5.4. Effect of Varying Attackers
ISSN: 2319-8753
International Journal of Innovative Research in Science,
Engineering and Technology
(An ISO 3297: 2007 Certified Organization) Vol. 3, Issue 11, November 2014
Fig. 7 Rate Vs False positive
Figure 7 shows the false positive rate of our CIDS technique and SIDS. From the figure, we can observe that our CIDS scheme attains low false positive rate, when compared with SIDS scheme, since it accurately detects the intrusion.
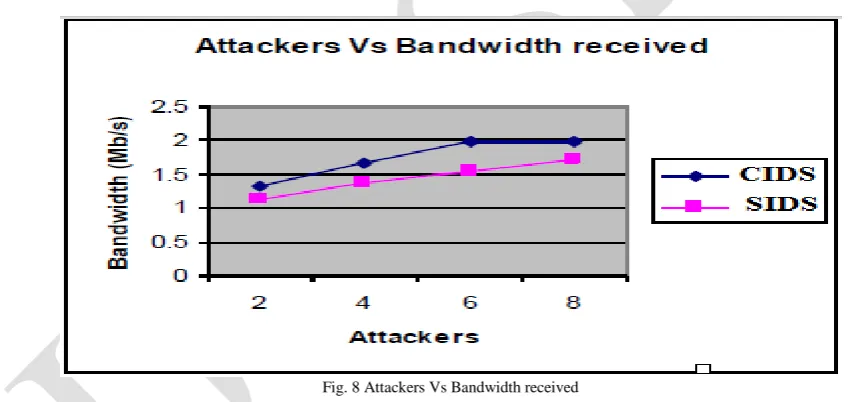
Fig. 8 Attackers Vs Bandwidth received
ISSN: 2319-8753
International Journal of Innovative Research in Science,
Engineering and Technology
(An ISO 3297: 2007 Certified Organization) Vol. 3, Issue 11, November 2014
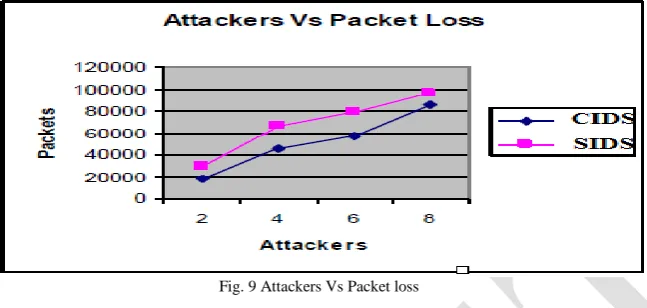
Fig. 9 Attackers Vs Packet loss
Fig: 9 shows that the packet loss due to attack is more in SIDS when compared with CIDS, when varying the number of attackers. So that we can conclude that CIDS is more efficient than SIDS and CIDS may efficiently detect the fault node in WSN.
VI. CONCLUSION
In this study we have developed an error detection model which consists of the combination of Naïve Bayes detector and fuzzy logic. By this error detection model we can find the worst node and normal node. Since the values of malicious and faulty sensors are not aggregated, so that secure data aggregation is ensured in the wireless sensor network. Our technique is improved the data accuracy of data during transmission and network lifetime is improved by avoiding unwanted data transmission.
REFERENCES
[1] De Paola, A., Lo Re, G., Milazzo, F., & Ortolani, “MQoS-aware fault detection in wireless sensor networks”, International Journal of Distributed Sensor Networks, 1–12, 2013
[2] Volosencu, C ”Applying the technology of wireless sensor network in environment monitoring”, Cutting Edge Research in New Technologies , pp. 97–116, 2012
[3] Abadeh, M. S., Mohamadi, H., Habibi, J., “Design and analysis of genetic fuzzy systems for intrusion detection in computer networks”, Expert Systems with Applications, Vol. 38, pp. 7067–7075, 2011
[4] Geeta, D. D., Nalini, N., & Biradar, R. C. “Fault tolerance in wireless sensor network using hand-off and dynamic power adjustment approach.”, Journal of Network and Computer Applications, 2013
[5] Gupta, D. Riordan, S. Sampalli, “Cluster-head election using fuzzy logic for wireless sensor networks, in”, Proceedings of the 3rd Annual Communication Networks and Services Research Conference, IEEE Computer Society, Washington, DC, USA, pp. 255–260, 2005.
[6] Chitradevi N, Palanisamy V, Baskaran K, Prabeela S, “Efficient distributed clustering-based anomaly detection algorithm for sensor stream in clustered wireless sensor networks” ,Eur J Sci Res 54(4):484–98, 2011
[7] Wang T, Liang Z, Zhao C, “A detection method forrouting attacks of wireless sensor network based on fuzzy C-means clustering”, In: The proceeding of 6th international conference on fuzzy systems and knowledge, discovery, p. 445–9, 2009
[8] S.J.Russel, and Norvig, "Artificial Intelligence: Amodern approach (International edition)”, Pearson US imports & PHIPES, Nov 2002.
[9] Lee, C. C,Man,Cybernetics, “Fuzzy logic in control systems: Fuzzy logic controller”, Part I and Part II. IEEE Transactions on Systems, 20(2), 404–435,1990 [10] Wangm, L. X., & Mendel, J. M. (1992),” Generating fuzzy rules by learning from examples”, IEEE Transactions on Systems, Man, and Cybernetics, 22(6),
1414–1427,1992
[11] Zhu,S.Setia,S.Jajodia,S.Ning, “Interleaved Hop-by-Hop Authentication against False Data Injection Attacks in Sensor Networks”,ACM Transactions on Sensor Networks ,2007
[12] Lee,H.Y,Cho T H, ”Key Inheritance-Based False Data Filtering Scheme in Wireless Sensor Networks”, Springer,Heidelberg, 2006
[13] S. Li, S.H. Son, J.A, ”Stankovic, Event detection services using data service middleware in distributed sensor networks”, in: Proceedings of the 2nd International Conference on Information Processing in Sensor Networks (IPSN), Springer-Verlag, Berlin, Heidelberg, pp. 502–517,2003
[14] R. Govindan, J. Hellerstein, W. Hong, S. Madden, M. Franklin, S. Shenker, “The sensor network as a database,”,Technical Report 02-771, Computer Science Department, University of Southern California, 2002
[15] J. Kim, S. Park, Y. Han, T. Chung, “CHEF: cluster head election mechanism using fuzzy logic in wireless sensor networks”, ICACT 654–659,2008 [16] B. Kim, H. Lee, T. Cho, “Fuzzy key dissemination limiting method for the dynamic filtering-based sensor networks”, ICIC 263–272,2007 [17] S.-Y. Chiang, J.-L. Wang, “Routing analysis using fuzzy logic systems in wireless sensor networks”, KES 966–973,2008