1421
Science Process Skills: Basic and Integrated in
Equilibrium Practicum
Haryanto, Maison, Ai Suryani, Artha Lumbantoruan, Utari Prisma Dewi, Sofia Christine Samosir, Nirmala Sari, Dodi Setiawan Putra, Orin Hidayusa Wiza
Abstract: Science process skills (SPS) are a summary of all skills that consist of basic SPS and integrated SPS. Good SPS is demonstrated through the attitude of students in conducting experiments in the laboratory. This study was to determine the differences in science process skills in Physics Education students with Chemistry education students at Universitas Jambi both using conventional practicum guidebook, as well as students using SPS-based guidebooks. The skills reviewed in this study consisted of basic SPS and integrated SPS. The basic skills indicator consists of 1) classification, 2) making conclusions, and 3) measuring, while the integrated skills indicator consists of 1) processing and processing data, 2) explaining the relationships between variables, 3) making graphs, 4) making hypotheses, and 5) identifying variables. This research is a quantitative study with quasy experimental type using a static group comparison design. The research sample was all students of Physics Education and Chemistry Education students with a total sample of 201 students, consisting of 108 Physics Education students, and 93 Chemistry Education students. The assessment instrument used was the SPS’ observation sheet with the skill score used in the form of a Likert scale. The results of this study indicate that the use of SPS-based practicum guidebooks can develop students' skills in science processing as indicated by the significant difference in SPS mastery scores of students in the experimental class and students in the control class in each study program.
Index Terms: Higher Education, Science Process Skills, Practical Guidebook, Basic Physics I —————————— ——————————
1.
INTRODUCTION
Education is a conscious and planned effort to create an good learning process so that students develop their potential [1][2]. Education in Indonesia has been well-integrated and needs further development. Continuing education should be closely related to the curriculum used [3][4] Currently, the curriculum used requires students to have a scientific attitude in learning. Scientific attitude helps students to understand the concepts of natural science so that they can carry out experiments to trigger their understanding and insight in understanding natural science itself, for example in learning physics [5][6][7]. Beliefs, feelings, and actions are the three main components of scientific attitudes that can be applied through the use of scientific methods to form active, independent, critical, logical and structured thought patterns. The scientific attitude is attitude which can be used in scientific work such as honesty, responsibility and discipline [8][9][10]. Scientific attitude helps students to carry out scientific activities or scientific procedures. One of the processes of scientific inquiry can be carried out by practicum activities [11][12]. Experimental activities allow students to obtain their knowledge independently, for example, the Basic Physics experiment.
The laws and principles of Physics are obtained through the success of scientists' experiments. This success is supported by the skills of scientists in conducting experiments which can be summarized in the science process skills (SPS). SPS is a skill that provides a means in science learning, research, and active learning, building a sense of responsibility when learning and increasing knowledge [13][14]. SPS is very important for every student as a provision to use scientific methods in developing science. Also, students are expected to gain new knowledge or even develop their existing knowledge through science processing activities. Students who have SPS can practice understanding the concepts they have acquired in learning activities which have two categories, basic SPS, and integration SPS [15][16]. Students in the faculty of education are prospective professional educators who have the task of guiding, training and building one's knowledge [17][18]. As pre-service teacher, SPS needed by the students of education faculty to construct not only pedagogic competence but also built the professional competence [19][20]. Therefore, students are not only required to be professional educators who have good competence in the cognitive field, but students also need competence in the psychomotor field. Psychomotor students are trained through the implementation of practical activities in the laboratory. Because SPS emphasize the learning process, accreditation, creativity, values and also the attitude of a student who will later be applied in daily life, so SPS have a relationship with the motivation of a student [21][22]. In doing a practicum, students need practicum guidebooks that can support them to do practicum well. Practical guidebooks used by students today, especially in the Equilibrium experiment, are still using practicum guidebooks that do not pay attention to aspects of SPS. This practicum guidebook or conventional practicum guidebook has been used since 2013. Therefore, to practice student SPS, practicum guides should be arranged based on aspects of SPS. SPS-based experiment guide books help improve skills mastery scores on several indicators of basic SPS and integrated SPS [23][24][25]. The purpose of this study was to determine the differences in SPS between Physics Education students and Chemistry Education students at the Universitas Jambi both using conventional practicum guidebook, and students using a SPS-based guidebook. The ————————————————
Haryanto, Maison, Ai Suryani, Artha Lumbantoruan, Utari Prisma Dewi,
Sofia Christine Samosir, Nirmala Sari, Dodi Setiawan Putra, Orin Hidayusa Wiza
Faculty of Teaching and Education, Universitas Jambi (UNJA),
Indonesia, (E-mail: [email protected])
Faculty of Teaching and Education, Universitas Jambi (UNJA),
Indonesia, (E-mail: [email protected])
Faculty of Teaching and Education, Universitas Jambi (UNJA),
Indonesia, (E-mail: [email protected])
Faculty of Teaching and Education, Universitas Jambi (UNJA),
Indonesia, (E-mail: [email protected])
Faculty of Teaching and Education, Universitas Jambi (UNJA),
Indonesia, (E-mail: [email protected])
Faculty of Teaching and Education, Universitas Jambi (UNJA),
Indonesia, (E-mail: [email protected])
Faculty of Teaching and Education, Universitas Jambi (UNJA),
Indonesia, (E-mail: [email protected])
Faculty of Teaching and Education, Universitas Jambi (UNJA),
Indonesia, (E-mail: [email protected])
Faculty of Teaching and Education, Universitas Jambi (UNJA),
1422 skills reviewed in this study consisted of basic SPS and
integrated SPS. The basic skills indicator consists of 1) classification, 2) makes conclusions, 3) measures, while the integrated skills indicator consists of 1) processing and processing data, 2) explaining the relationships between variables, 3) making graphs, 4) making hypotheses, 5) identify the variable. Research questions in this study are:
1. How is the SPS of Physics Education students at Universitas Jambi using both the conventional Equilibrium practicum guidebook and the Equilibrium practicum based on the SPS?
2. How is the Chemistry Education student's SPS at Universitas Jambi using both the conventional Equilibrium practicum guidebook and the Equilibrium practicum based on the SPS?
3. Are there significant differences between students who use conventional Equilibrium practicum guidebook and students who use Equilibrium practicum guidebook based on SPS?
The results of this study are expected to be considered for using the Equilibrium practicum-based science process skill guidebook at Universitas Jambi so that it can train students' SPS at Universitas Jambi.
2
METHODOLOGY
2.1 Research Samples
This research was conducted on students of the Physics Education Study Program and students of the Chemistry Education Study Program at Universitas Jambi. The sampling technique uses a total sampling technique. The total sampling technique is a technique that allows researchers to take samples from the entire population. The total sampling technique is used to minimize generalization errors from the results of the study. The research sample was all students of Physics Education and Chemistry Education students with a total sample of 201 students, consisting of 108 Physics Education students, and 93 Chemistry Education students.
2.2 Research Type
This research is a quantitative study with quasy experimental type using a static group comparison design. In the comparison group, study participants were not randomly assigned to the two treatment groups, with posttest and without pre-test [27].
X O1
O 2 \
Figure 1. Design for comparison statistics’ group
The design of this study consisted of two groups consisting of experimental and control groups. The step of determining the experimental group and the control group begins by giving a pre-test in the form of multiple-choice questions for all study samples. The pretest problem used has been tested to determine its validity and reliability. Of the 50 multiple choice questions, 36 valid and reliable questions were obtained with alpha Cronbach .924. The pre-test data were then analyzed using the normality test and homogeneity test. The analysis shows that the data are normally distributed (sig. = .200 at the 5% significance level) and homogeneous (sig. = .948 at the 5% significance level). These results indicate that the cognitive abilities of students in each class are the same, so there is no significant difference between students in the experimental group and the control group before being treated. The experimental group was given treatment using a science process skill-based practical guidebook. The results of the group measurements treated are called O1. Whereas in the
control group no treatment was given, the control group used a conventional guidebook on the Equilibrium material that produced measurements called O2.
2.3 Data Collection
Data collection techniques used observation sheets that were filled in through the participant observation process. Observations are made when students do Equilibrium practicum. Observations were made by 20 observers using observation sheets.
2.4 Data Analysis
Data from observations were analyzed using descriptive statistics and inferential statistics. Descriptive statistics are used to describe students' SPS mastery in the experimental class and the control class. Statistical parameters used include Mean, Mode, Standard deviation, range, Maximum, and Minimum. Also, mastery of each SPS indicator will be presented in the frequency distribution table and graph. SPS mastery in each indicator is divided into four categories, namely; poor, low, high, and excellent. The SPS mastery category for each indicator is presented in Table 1. Inferential statistics are used to answer the research hypothesis. Data generated by the statistical group comparison design can be analyzed by conducting tests. But if the score deviates far from the normal distribution, it can be analyzed by the nonparametric test which is most likely the Mann-Whitney U-test [26]. Data analysis was performed using the SPSS v.24 application.
Table 1. Category of SPS Indicator Mastery
No Interval Category
1 1,00 - 1,75 Poor
2 1,76 -2,50 Low
3 2,51 -3,25 High
4 3,26 - 4,00 Excellent
3
RESULT
AND
DISCUSSION
Science process skills are a combination of all abilities needed to acquire, develop, and apply scientific concepts, principles, laws, and theories in the form of mental, Physics, and social abilities [28]. Physics Education students and Chemistry Education students come from different school backgrounds.
1423 study, the science process skills observed through the
Equilibrium material experiment are basic and integrated skills with a total of 8 indicators namely 1) classifying, 2) inferring, 3) measuring, 4) obtaining and processing data, 5) explaining the relationship between variables, 6) arranging graphs, 7) making hypotheses, 8) identifying variables.
Students' skills in investigating and processing science are
seen from the way students obtain experimental data [20] [29]. Both of them are students from the department of natural science who should have good skills in processing science. SPS mastery data of students in the experimental class and the control class of each study program were tested for normality, homogeneity test, and t-test.
Table 2. Results of normality tests in Physics Education study programs
Kolmogorov-Smirnov
Statistik df Sig. Experiment 0,096 41 ,200 *
Control 0,078 41 ,200 *
Based on Table 2, the normality test carried out at a significance level of 5%, obtained significance values from the experimental class and the control class in Physics Education students namely .200. Based on the significant value it can be concluded that the mastery of SPS data in the experimental
class and the control class is normally distributed. This is following the criteria if Sig> 0.05, then the data are normally distributed [26].
Table 3. Homogeneity test results of Physics Education study programs
Statistik
Levene df1 df2 Sig.
0,024 1 106 0,878
Based on Table 3, the homogeneity test at the 5% significance level obtained a significance value of 0.878. Based on the significance of the results it can be concluded that the mastery of SPS data from the experimental group and the control
group students have the same variant. This is following the criteria if the value is sig. > 0.05, then the two data tested are homogeneous.
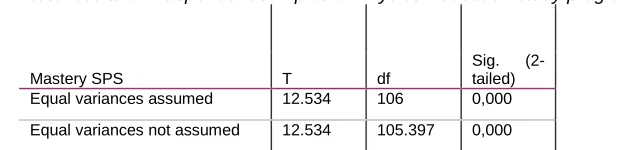
Table 4. T-test results of independent samples of Physics Education study programs
Mastery SPS T df
Sig. (2-tailed) Equal variances assumed 12.534 106 0,000 Equal variances not assumed 12.534 105.397 0,000
Based on Table 4, the results of the independent sample t-test at a significance level of 5%, obtained a significance value (Equal variances assumed) of 0,000. Because of the value of
Sig. <0.05, it was concluded that there were significant differences in SPS mastery in the experimental class and the control class in Physics Education students.
Table 5. Results of normality tests in Chemistry Education study programs
Kolmogorov-Smirnov a Statistic df Sig. Experiment 0,083 41 , 200 * Control 0,113 41 , 200 *
Based on Table 5, the normality test is carried out at a significance level of 5%, obtained significance values from the experimental class and the control class .200. Based on the significant value it can be concluded that the mastery of SPS
data in the experimental class and the control class is normally distributed. This is under the criteria if Sig. > 0.05, then the data are normally distributed [26].
Table 6. Test results for the homogeneity of the Chemistry Education study program
Statistic’s
Levene df1 df2 Sig.
1424 Based on Table 6, the homogeneity test at a significance level
of 5% obtained a significance value of 0.308. Based on the significance of the results it can be concluded that the mastery of SPS data from the experimental group and the control
group students have the same variant. This is under the criteria if the value is Sig. > 0.05, then the two data tested are homogeneous.
Table 7. Test results for independent samples of t-test Chemistry Education study programs
Mastery SPS T df
Sig. (2-tailed) Equal variances assumed 10.637 91 0,000 Equal variances not assumed 10.657 88.794 0,000
Based on Table 7, the independent sample t-test at a significance level of 5%, obtained a significance value (Equal variances assumed) of 0,000. Because of the significance
value> 0.05, it was concluded that there were differences in SPS mastery in the experimental class and the control class.
Table 8. Results of analysis of statistical parameters from the Physics Education study program
Class Mean Mode Std.
Deviation Min Max
Quartile
Q1 Q2 Q3
Experiment 3,01 3 0,292443 2,16 3,56 2,87 3,01 3,22 Control 2,33 2,42 0,271102 1,79 2,84 2,13 2,35 2,55
In general, the value of statistical parameters in the experimental group was higher than in the control group. The mean value of the experimental group (3.01) is greater than the mean value in the control group (2.33). This is supported by the quartile value of the experimental group greater than
the quartile value in the control group. Based on these parameters, it can be concluded that the SPS mastery of the experimental class is better than the control class SPS mastery described in Table 8.
Table 9. Results of analysis of statistical parameters of the chemistry education study program
Class Mean Mode Std.
Deviation Min Max
Quartile
Q1 Q2 Q3
Experiment 2,87 2,82 0,341931 2,1 3,45 2,69 2,9 3,13 Control 2,18 1,94 0,285331 1,58 3,06 1,94 2,21 2,38 In general, the value of statistical parameters in the
experimental group was higher than in the control group. The mean value of the experimental group (2.87) is greater than the mean value in the control group (2.18). This is supported by the quartile value of the experimental group greater than the quartile value in the control group. Based on these parameters, it can be concluded that the mastery of the experimental class SPS is better than the control class SPS mastery described in Table 9.
Information from Table 8 and Table 9 shows that there are significant differences in SPS mastery between students in the experimental class and students in the control class, even the difference between Physics Education students and Chemistry Education students. The information in Table 8 and Table 9 shows that Physics Education students have better SPS mastery scores compared to Chemistry Education students. This can be seen more clearly in Table 10, Table 11, Table 12, and Table 13.
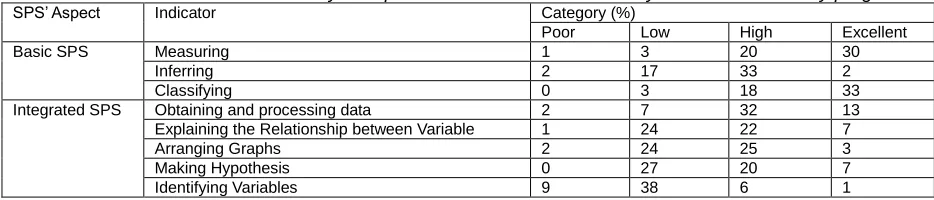
Table 10. Distribution of SPS mastery of experimental class students in Physics Education study programs
SPS’ Aspect Indicator Category (%)
Poor Low High Excellent
Basic SPS Measuring 1 3 20 30
Inferring 2 17 33 2
Classifying 0 3 18 33
Integrated SPS Obtaining and processing data 2 7 32 13
Explaining the Relationship between Variable 1 24 22 7
Arranging Graphs 2 24 25 3
Making Hypothesis 0 27 20 7
Identifying Variables 9 38 6 1
From table 10, it can be seen that students who use SPS-based practicum guidebook have good SPS in terms of basic
1425 Excellent category and 20% of students in the High category.
However, the dominant skill that is not well mastered is
Identifying Variables ie 38% of students are in a Low category.
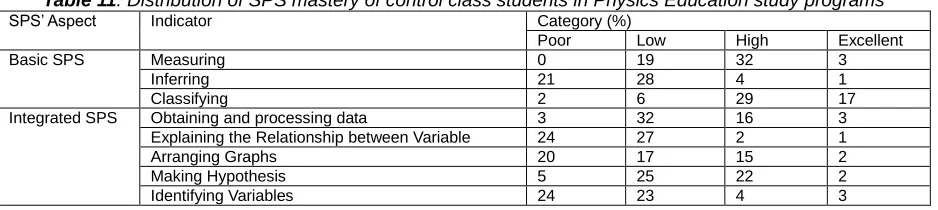
Table 11. Distribution of SPS mastery of control class students in Physics Education study programs
SPS’ Aspect Indicator Category (%)
Poor Low High Excellent
Basic SPS Measuring 0 19 32 3
Inferring 21 28 4 1
Classifying 2 6 29 17
Integrated SPS Obtaining and processing data 3 32 16 3
Explaining the Relationship between Variable 24 27 2 1
Arranging Graphs 20 17 15 2
Making Hypothesis 5 25 22 2
Identifying Variables 24 23 4 3
Table 11 shows that the average mastery of SPS indicators in the control class is categorized as not good. The indicator most mastered by students is the Classifying indicator with 29% of students in the High category and 17% in the Excellent
category. The weakest indicator is Identifying Variables with 24% of students in the Poor category and 23% of students in the Low category.
Table 12. Distribution of SPS mastery of Chemistry Education study program students in the experimental class
SPS’ Aspect Indicator Category (%)
Poor Low High Excellent
Basic SPS Measuring 4 10 17 16
Inferring 2 13 27 5
Classifying 1 2 27 17
Integrated SPS Obtaining and processing data 1 9 17 20
Explaining the Relationship between Variable 5 21 15 6
Arranging Graphs 0 9 18 20
Making Hypothesis 1 25 20 1
Identifying Variables 5 26 15 1
Table 12 shows that the average experimental class student in the Chemistry Education study program has mastered SPS well. Classifying is the dominant indicator that is most mastered by experimental class students in the Chemistry Education study program. While the Identifying Variables
indicator is the dominant indicator that is at least controlled by the experimental class students in the Chemistry Education study program. This was also shown by Physics Education students both in the experimental class and the control class.
Table 13. Distribution of SPS mastery of Chemistry Education
study program students in the control class
SPS’ Aspect Indicator Category (%)
Poor Low High Excellent
Basic SPS Measuring 2 19 23 2
Inferring 25 20 1 0
Classifying 4 9 27 6
Integrated SPS Obtaining and processing data 9 31 4 2
Explaining the Relationship between Variable 29 16 1 0
Arranging Graphs 4 19 23 0
Making Hypothesis 7 35 4 0
Identifying Variables 17 25 4 0
Table 14 shows that the average mastery of SPS indicators in the control class of the Chemistry Education study program is categorized as not good. The indicator most mastered by students is the Classifying indicator. The indicator that is not controlled by students is Explaining the Relationship between Variable skill. Education is a processing effort by someone to get knowledge, skills, and habits in life [30][31]. Based on information obtained from the SPS mastery score distribution, it can be concluded that Physics Education students and Chemistry Education students have poor mastery of SPS. However, students in the experimental class using the SPS-based Equilibrium practicum guidebook showed the opposite. Students can learn well about the purpose of the experiment, the procedure of the experiment, and even be able to analyze the results of the experiment using this practical guidebook. This provides information that the use of SPS-based practical
1426 and determining measurement results. For physics education
students, the use of dynamometers and arcs is common, while for Chemistry students, the use of dynamometers is new. This can be seen when practicum, Chemistry Education students tend to ask questions about the use of dynamometers. In the experimental class, students of Physics Education and Chemistry Education students conduct experiments effectively. Significant differences were also seen in the control class, students tend to ask what should be measured in the experiments they do. Besides, students in control classes also tend not to be able to use time effectively due to difficulties faced by students during practicum. In contrast to students in the experimental class, they can distribute assignments so that the measuring activities carried out can be completed to the maximum. The results of the Measuring activity will help students to conclude following the objectives of the Equilibrium experiment. Inferring skills can be observed in making reports that are made after students obtain and collect data. Inferring skills are basic skills that students should have. In the experimental class, students can make conclusions from the results of the experiments they do. Even students can also relate their experimental activities to relevant theories. It's just that students in the experimental class from each study program show different ways of obtaining theories. Physics Education students express their opinions following the theories in the SPS-based practicum guidebook, the internet, and their notebooks which are summaries of material obtained while studying outside the laboratory. Whereas Chemistry Education students only collect information from SPS-based practical guidebook. Classifying is a basic skill that supports other basic skills namely Measuring skills and Inferring skills. Classifying skills is a skill often carried out by students so it is not difficult for them to master this skill well. Classification activities can be observed when students classify findings (measurement data) of students during the experiment [14] [34]. Classifying is the ability to identify similarities and differences in various observed objects. Classification activities carried out by students included grouping the same or opposite quantities. Classification is the ability to be able to sort objects or phenomena into groups or orders, based on observation or measurement or even both or grouping objects or events is a way of imposing an order based on similarities, differences, and interrelationships [33]. Students from both the experimental class and the control class have good SPS mastery in Classifying skills. The difference that is seen from each class is that students in the control class are hesitant in classifying the results of the experiments they get. Besides, students in the control class also only use conventional practical guidebook without looking for additional information. Furthermore, indicators of obtaining and processing data, viewed from the ability of students to display experimental data in the form of data tables and graphs. Ref [29] also explains that the process skills of collecting and processing data are a skill to obtain information or data from the literature or observation. In the experimental class, students are interested in adding to the repetition of the experiment to obtain valid data following the advice described in the e-module. Students should have previous experience of observing, classifying, and measuring before interpreting data [33]. The ability of students to show their findings is closely related to the basic SPS possessed by students. Based on Ref [34] the skills of obtaining and processing data are influenced by the low skills of students in classifying practical tools and materials. In
1427 variables for the experimental class, and the investigative
analysis aspect for the control class. Advances in technology have influenced students in their learning process [36]. Each class has its way (attitude) to do the practicum. The attitude in learning is very important, even so with the attitude that exists in learning towards courses in college [37]. Students in the experimental class use the internet to obtain information that supports the results of their experiments. Mastery of the SPS of students classified as good in the experimental class shows that the use of SPS-based Equilibrium practicum guidebook allows students to develop their skills in processing their science.
4
CONCLUSION
Based on the results of the research conducted it can be concluded that Physics Education students have mastery of SPS compared to Chemistry Education students. This is indicated by the Mean value in the Physics Education study program of 3.01 for the experimental class and 2.33 for the control class. While the Mean value in the Chemistry Education study program for the experimental class was 2.87 and the control class was 2.18. Besides, it can be concluded that the use of SPS-based practicum guidebooks can develop student skills in science processing as indicated by the significant difference in SPS mastery scores of students in the experimental class and students in the control class in each study program.
ACKNOWLEDGMENT
We would thank the chairman of the physics education which has allowed us to work together. Also, we want to thank the chairman of the physics education laboratory in Universitas Jambi, who has Provided the opportunity to be able to research the physics laboratory education in Universitas Jambi. Besides that, thank you to all of the Physics Education students who have participated in this research.
REFERENCES
[1] A. Astalini, D. A. Kurniawan, N. Kurniawan, and L. Anggraini. ―Evaluation of Student’s Attitude Toward Science in Indonesia,‖ Open Journal for Educational Research, vol. 3 no. 1, pp. 1-12, 2019.
[2] S. Syahrial, A. Asrial, D. A. Kurniawan, F. Chan, A. Hariandi, R. A. Pratama, P. Nugrogo, and R. Septiasari, ―The impact of etnocontructivism in social affairs on pedagogic competencies.‖ International Journal of Evaluation and Research in Education (IJERE), vol. 8 no. 3, pp. 409-416, 2019.
[3] Astalini, Darmaji, D. A. Kurniawan, and R. Melsayanti, ―E-Assessment of Student Perception of Natural Sciences Based on SESKA in Middle School Students in Indonesia,‖ International Journal of Scientific & Technology Research (IJSTR), vol. 8 no. 9, pp. 858-863, 2019.
[4] E. Ediansyah, D. A. Kurniawan, R. Perdana, and S. Salamah. ―Using Problem-Based Learning in College: Mastery Concepts Subject Statistical Research and Motivation,‖ International Journal of Evaluation and Research in Education (IJERE), vol. 8 no. 3, pp. 446-454, 2019.
[5] Astalini, D. A. Kurniawan, Darmaji, L. R. Sholihah, and R. Perdana. ―Characteristics of Students’ Attitude to Physics
in Muaro Jambi High School,‖ Humanities & Social Sciences Reviews, vol. 7 no. 2, pp. 91-99, 2019.
[6] S. Susbiyanto, D. A. Kurniawan, R. Perdana, and C. Riantoni. ―Identifying the Mastery of Research Statistical Concept by Using Problem-Based Learning,‖ International Journal of Evaluation and Research in Education (IJERE), vol. 8 no. 3, pp. 461-469, 2019. [7] J. Jufrida, W. Kurniawan, A. Astalini, D. Darmaji, D. A.
Kurniawan, and W. A. Maya. ―Students’ Attitude and Motivation In Mathematical Physics,‖ International Journal of Evaluation and Research in Education (IJERE), vol. 8 no. 3, pp. 401-408, 2019.
[8] Astalini, Darmaji, D. A. Kurniawan, and A. Destianti. ―Description of the Dimensions Attitudes towards Science in Junior High School at Muaro Jambi,‖ International Journal of Sciences: Basic and Applied Research (IJSBAR), vol. 47, no. 1, pp. 1–11, 2019
[9] D. A. Kurniawan, A. Astalini, D. Darmaji, and R. Melsayanti. ―Students’ Attitude Towards Natural Sciences,‖ International Journal of Evaluation and Research in Education (IJERE), vol. 8 no. 3, pp. 455-460, 2019.
[10]Astalini, D. A. Kurniawan, U. Sulistiyo, R. Perdana, and Susbiyanto. ―E-Assessment Motivation in Physics Subjects for Senior High School,‖ International Journal of Online and Biomedical Engineering (iJOE). vol. 15 no. 11, pp. 4-15, 2019
[11]S. S. Liew, H. L. Lim, S. Saleh, and S. L. Ong. ―Development of Scoring Rubrics to Assess Physics Practical Skills,‖ EURASIA Journal of Mathematics, Science and Technology Education, ISSN: 1305-8223, vol. 15 no. 4, em 1691, 2018.
[12]Darmaji., Astalini, Maison., D. A. Kurniawan, and A. Rahayu. ―Development Physics Practical Guided Based On Science Process Skill Using Problem Solving,‖ Edusains. vol. 10 no. 1, pp. 83-96, 2018.
[13]S. Kapucu. ―Predicting physics achievement: attitude towards physics, self-efficacy of learning physics, and mathematics achievement,‖ Asia-Pacific Forum on Science Learning and Teaching, vol. 18 no. 1, pp. 1-22, 2017.
[14]Darmaji, D. A. Kurniawan, A. Suryani, and A. Lestari. ―An Identification of Physics Pre-Service Teachers' Science Process Skills Through Science Process Skills-Based Practicum Guidebook,‖ Jurnal Ilmiah Pendidikan Fisika Al-Biruni. vol. 7 no. 2, pp. 239-245, 2018.
[15]Darmaji, D. A. Kurniawan, Astalini, W. Kurniawan, K. Anwar, and A. Lumbantoruan. ―Students’ Perceptions of Electronic’s Module in Physics Practicum,‖ Journal of Education and Learning (EduLearn), vol. 13 no. 2, pp. 288-294, 2019.
[16]Astalini, Darmaji, W. Kurniawan, K. Anwar, and D. A. Kurniawan, ―Effectiveness of Using Module and E-Assessment,‖ Int. J. Interact. Mob. Technol., vol. 13, no. 9, pp. 21-39, 2019
[17]Darmaji, D. A. Kurniawan, Astalini, A. Lumbantoruan, and S. C. Samosir. ―Mobile Learning in Higher Education for The Industrial Revolution 4.0: Perception and Response of Physics Practicum,‖ Int. J. Interact. Mob. Technol., vol. 13, no. 9, pp. 4-20, 2019.
1428 International Journal of Evaluation and Research in
Education (IJERE), vol. 8 no. 2, pp. 249-254, 2019. [19]R. O. Ongowo, and F. C. Indoshi. ―Science Process Skills
in the Kenya Certificate of Secondary Education Biology Practical Examinations,‖ Creative Education, vol. 4 no. 11, pp. 713–717, 2013.
[20]Darmaji, D. A. Kurniawan, Astalini, and N. R. Nasih. ―Persepsi Mahasiswa ada Penuntun Praktikum Fisika Dasar II Berbasis Mobile Learning,‖ Jurnal Pendidikan: Teori, Penelitian, dan Pengembangan, vol. 4 no. 4, pp. 516-523, 2019.
[21]Darmaji, D. A. Kurniawan, H. Parasdila, and Irdianti. ―Description of Science Process Skills’ Physics Education Students at Jambi University in Temperature and Heat Materials,‖ The Educational Review, USA, vol. 2 no. 9, pp. 485-498, 2018.
[22]Maison, Darmaji, Astalini, D. A. Kurniawan, and P. S. Indrawati. ―Science Process Skills And Motivation,‖ Humanities & Social Sciences Reviews, vol. 7 no. 5, pp. 48-56, 2019.
[23]M. Karadan, and D. A. Hameed. ―Curricular Representation of Science Process Skills in Chemistry,‖ IOSR Journal of Humanities and Social Science, vol. 21 no. 8, pp. 1–5, 2016.
[24]Darmaji, D. A. Kurniawan, and A. Lestari, ―Deskripsi Keterampilan Proses Sains Mahasiswa Pendidikan Fisika Pada Praktikum Suhu Dan Kalor,‖ J. Ris. dan Kaji. Pendidik. Fis., vol. 5, no. 2, pp. 68–72, 2018.
[25]Darmaji, D., Kurniawan, D. A., & Suryani, A. ―Effectiveness of Basic Physics II Practicum Guidelines Based On Science Process Skills,‖ JIPF (Jurnal Ilmu Pendidikan Fisika), vol. 4 no. 1, pp. 1-6, 2019.
[26]J. W. Creswell. ―Educational Research: Planning, Conducting and Evaluating Quantitativ and Qualitativ Research,‖ Lincoln, pp. 1-650, 2012.
[27]L. Cohen, L. Manion, and K. Morrison. ―Research Methods in Education,‖ Routlege, 2007; 1-639.
[28]D. Darmaji, D. A. Kurniawan, and I. Irdianti. ―Physics education students’ science process skills,‖ International Journal of Evaluation and Research in Education (IJERE). Vol. 8 No 2, pp. 293-298, 2019.
[29]D.A. Kurniawan, Darmaji, Astalini, and P. Sefiah. ―Description of Science Process Skills for Physics Teacher’s Candidate,‖ Azerbaijan Journal of Educational Studies, vol. 689 no. 3, pp. 71-85, 2018.
[30]Asrial et . al., ―Identification: The effect of mathematical competence on pedagogic competency of prospective teacher,‖ Humanit. Soc. Sci. Rev., vol. 7, no. 4, pp. 85– 92, 2019.
[31]S. Asrial, D. A. Kurniawan, F. Chan, R. Septianingsih, and R. Perdana, ―Multimedia innovation 4.0 in education: E-modul ethnoconstructivism,‖ Univers. J. Educ. Res., vol. 7, no. 10, pp. 2098–2107, 2019.
[32]Darmaji, Astalini, D. A. Kurniawan, H. Parasdila, Irdianti, S. Hadijah, and R. Perdana. ―Practicum Guide: Basic Physics Based Of Science Process Skill,‖ Humanities & Social Sciences Reviews, Vol. 7 No. 4, pp 151-160, 2019.
[33]S. Ozgelen. ―Students’ Science Process Skills within a Cognitive Domain Framework,‖ Eurasia Journal of Mathematics, Science & Technology Education, vol. 8 no. 4, 283-292, 2012.
[34]Darmaji, D. A. Kurniawan, H. Parasdila, and Irdianti,
―Deskripsi Keterampilan Proses Sains Mahasiswa pada Materi Termodinamika,‖ Berk. Ilm. Pendidik. Fis., vol. 6, no. 3, pp. 345–353, 2018.
[35]Astalini, D. A. Kurniawan, R. Perdana, and D. Kurniasari. ―Identification of Student Attitudes toward Physics Learning at Batanghari District High School,‖ The Educational Review, USA, vol. 2 no. 9, pp. 475-484, 2018.
[36]Asrial, Syahrial, D. A. Kurniawan, R. Perdana, and P. Nugroho. ―Supporting Technology 4.0: Ethoconstructivist Multimedia for Elementary Schools‖, International Journal of Online and Biomedical Engineering (iJOE).Vol. 15 No. 14, pp. 54-66, 2019.