Article
Analysis of China’s Carbon Emissions Base on
Carbon Flow in Four Main Sectors: 2000–2013
Xin Li, Xiandan Cui and Minxi Wang *
College of Management Science, Chengdu University of Technology, Chengdu 610051, China; [email protected] (X.L.)
* Correspondence: [email protected]; Tel.: +86-136-280-18066
Abstract: Reducing carbon emissions is a major ways to achieving green development and sustainability for China’s future. This paper elaborates the detailed feature of China's carbon flow for 2013 with the carbon flow chart and gives changing characteristics of China's CO2 flow from the viewpoint of sector and energy during 2000 and 2013. The results show that (1) during 2000 to 2013, China's CO2 emissions with the approximately growth portion of 9% annually, while the CO2 intensity of China diminishes at different rates. (2) The CO2 emissions from secondary industry are prominent from the perspective of four main sectors accounting for 83.5%. The manufacturing play an important part in the secondary industry with 45%. In which the "smelting and pressing of metal" takes up a large percentage as about 50% in manufacturing. (3) The CO2 emissions produced by coal consumption is keep dominant in energy-related emissions with a contribution of 65%, while it will decrease in the future. (4) From the aspect of sector, the CO2 emissions mainly come from the "electricity and heating" sector and the "smelting and pressing of metals" sub-sector. While it is essential and urgent to propose concrete recommendations for CO2 emissions mitigation. Firstly, the progression of creative technology is inevitable and undeniable. Secondly, the government should make different CO2 emissions reduction policies among different sectors. For example, the process emission plays an important role in "non-metallic mineral" while in "smelting and manufacturing of metals" it is energy. Thirdly, the country can change the energy structure and promote renewable energy for powering by wind or other low-carbon energy. Besides it, the coke oven gas can be a feasible substitution. Finally, policy maker should be aware of the emissions from residents have been growing in a fast rate. It is effective to involve the public in the activity of energy conservation and carbon emissions reduction such as reducing the times of personal transportation.
Keywords: China; sustainability development; carbon emissions; carbon flow; sectoral analysis
1. Introduction
annual growth rate of 4.81% [8]. It is increasing numbers and upward variation tendency that make it urgent and essential for policy-makers to make efforts. Thus, a study about the characteristic and variation trend of current carbon emission in China is extremely necessary. Besides it, to identify the emission source is of great importance to inform the policy designers for future mitigation and to realize a friendly environmental and sustainable development society in China [9].
China is now the world's largest consumer of primary energy and emitter of greenhouse gas emissions [10] .There has still much challenge for China's CO2 mitigation. China produces 25% of global CO2 emission [11] and consumes 20.3% of global primary energy [3]. Among CO2 emission sources, 85% of China’s emissions are contributed by energy usage in cities, which is higher than that of the USA (80%) or Europe (69%) [12,13]. Therefore, energy-related CO2 emissions or emissions at city-level, province-level and national-level have been widely studied [4,14-16]. This paper is also at national-level, but analyze the feature of emission from four main sectors and four major energy types.
In order to provide detailed and straight insights for current situation of CO2 emission, carbon flow chart is used. It is an intuitive and quantitative tool to show a whole picture of substances [16]. The approach of flow chart method has been increasing applied to study energy path and emission source of different countries at the regional or national scale [17-21]. Adopting this methodXie had conducted carbon flow chart for Shanghai in 2007 and found that 15.6% of coal was directly consumed in end sectors, which was not beneficial to energy saving and emission reduction [21]. Some scholars apply flow chart method to analyze the changing characteristics of China's carbon flow between 2008 to 2012, and make a conclusion that CO2 flow carried by primary energy has significantly increased in 2012 [8]. However, these all most efforts about energy or energy-related CO2 emissions were received to only adopt the IPCC approach in classification for CO2 emissions, nor the changes that could realize the distinguish of CO2 emissions.
In this paper, a carbon flow is adopted which combines the method of IPCC carbon emission inventory with classification of national economy industry published by National Bureau of Statistics of the People's Republic of China. It can provide a quantitative and intuitive study about the carbon emission path. What’s more, the changes between 2000 and 2013 in China are also present. These will greatly contribute to clear understanding on emission status and policy-making for emission mitigation.
The paper is organized as follows: the classification and calculation methods of CO2 emission are introduced in Section 2; Section 3 analyzes the characteristics in 2013 through carbon flow chart and measures the emissions in different sectors or energy types based above before results and conclusion are drawn in Section 4.
2. Materials and Methods
2.1. The Method for Classification of CO2 Emissions
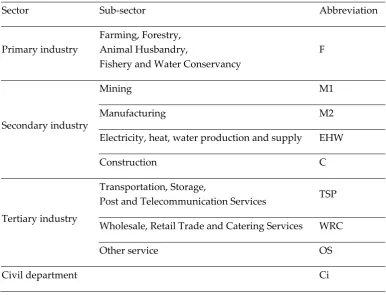
Table 1. The classification of CO2 emission source
Sector Sub-sector Abbreviation
Primary industry
Farming, Forestry, Animal Husbandry,
Fishery and Water Conservancy
F
Secondary industry
Mining M1
Manufacturing M2
Electricity, heat, water production and supply EHW
Construction C
Tertiary industry
Transportation, Storage,
Post and Telecommunication Services TSP
Wholesale, Retail Trade and Catering Services WRC
Other service OS
Civil department Ci
Table 2. The sub-sector of Manufacture sector
Sector Sub-sector Abbreviation
Manufacturing
food, beverage, tobacco
processing and production FM
Textiles and leather TLM
Chemical industry CM
Paper and printing PPM
Petroleum processing and coking PCM
Non-metallic mineral NMM
Smelting, pressing and manufacturing of metals SM
Wood processing WM
Transport equipment manufacturing TM
Figure 1. Framework of the paper 2.2. Formulas for Calculating CO2 Emission
In this paper, CO2 emissions of the energy-related [14] and the process are calculated. The growth and its rate are also considered.
The CO2 emissions from fossil fuel combustion and industrial process [23] are calculation according to IPCC sectoral approach [22]. This way is also applied by other scholars[24-30].
2.2.1. Energy-related CO2 Emission
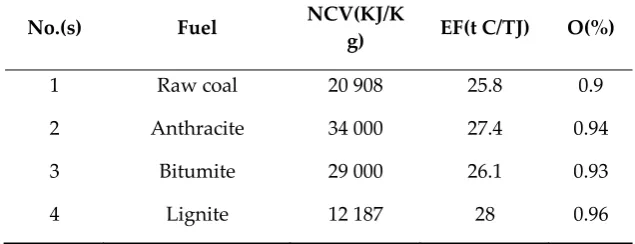
Eq.(1) is used to calculate the fossil fuel-related CO2 emissions. Where the subscripts i and j denote the i th sector and the j th fuel respectively;theCEijdesignates the CO2 emission of different sectors and energy types;ADijrepresents the adjusted energy consumption;NCVjrefers to the net
calorific value of different energy types;EFjis the carbon emission factor of the fuel;
O
jmeans the fraction of carbon oxidized of fuel.] 17 , 1 [ ], 4 , 1 [ , ∈ ∈ × × ×
=AD NCV EF O i j
CEij ij j j j (1)
Therefore, the total energy-related CO2 emission in the year t is accumulated by all economy sectors from 1 to 4 as following:
= i t i t CE CE (2)The parameters instruction in Eq.(1) and Eq.(2) is shown in Table 3.
Table 3. Carbon emission factor (EF) and fraction oxidized (O) of fuel
No.(s) Fuel NCV(KJ/K
g) EF(t C/TJ) O(%)
1 Raw coal 20 908 25.8 0.9
2 Anthracite 34 000 27.4 0.94
3 Bitumite 29 000 26.1 0.93
4 Lignite 12 187 28 0.96
2000:
P
revious st
udy
Primary energy
CO2 flow carried by primary energy
CO2 flow carried by four main sector
Terminal sub-sector Process emissions
Terminal emission flow comparision
2.2.2. Process CO2 emission
For the non-mental product, the process emissions is present as Eq. (3):
CEm=ADm×EFm,m∈[1,3] (3)
The instructions of formula (3) is in Table 4.
Table 4. The instruction in formula (3) (Unit: tCO2/t)
2.2.3. The change in CO2 emission
The change in CO2 emissions from period t to T can be formulate as follows:
CΔ =CT−Ct (4)
% 100 ) 1 /
( − ×
=
Δ CT Ct r
(5)
5 Washed coal 26 344 25.41 0.93
6 Coke 28 435 29.5 0.93
7 Coke oven gas 17 084 13.58 0.98
8 Other coking
products 38 052 29.5 0.93
9 Crude oil 41 816 20 0.98
10 Fuel oil 41 816 21.1 0.98
11 Gasoline 43 070 18.9 0.98
12 Diesel oil 42 652 20.2 0.98
13 Kerosene 43 070 19.6 0.98
14 LPG 50 719 17.2 0.98
15 Refinery gas 46 055 18.2 0.98
16 Other petroleum
products 35 125 20 0.98
17 Natural gas 38 979 15.3 0.99
m Sub-sector AD EF
1 Cement production Net production of cement clinker
expect production from carbide slag 0.538
2 Lime production Production of lime 0.683
3 Calcium carbide
Where CΔstands for the change in carbon emissions from period t to period T, rΔrefers to the
changes in percentage form.
2.3. Data sources
The data in this paper are prior to the adoption of official statistics, such as "China Statistical Yearbook", "Chinese Energy Statistical Yearbook", "IPCC report (2014) ", and "Industry Statistics Yearbooks". Some data used in this paper are from National Bureau of Statistics of the People's Republic of China.
3. Results and Discussion
3.1. CO2 flow chart of 2013
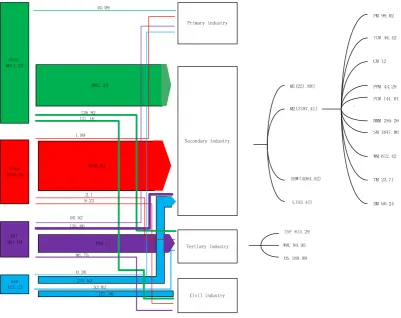
Based on data calculated above, it is easy to draw the CO2 flow in 2013. It is clear to suppose fossil fuels as CO2 source and denote these with different colors. At the same time, the scale of the rectangle represents the magnitude of CO2 flow in Fig 2.
Figure 2. China's CO2 flow chart in 2013
sub-sectors. The amount of CO2 flowing into “electricity and heating sector” and the “manufacturing” sector in secondary industry is huge, reaching up to 4 064.52 million tons and 3187.41 million tons respectively. In addition, the “smelting and pressing of metals” sub-sector and the “non-metallic mineral” sub-sector among these sub-sectors involve a big share of CO2 flowing in manufacturing which is 1 847.86 million tons and 295.26 million tons. Noteworthy, there has a considerable percentage of the “transportation, storage and post” sector in tertiary industry with a proportion of 71%, which has decreased 6% than that in 2000. There will be more efficient on carbon reduction if the government make more effect on these specific sectors.
3.2. Trend analysis from 2000 to 2013
Based on the method mentioned in section 2, China's total CO2 emissions and CO2 intensity from 2000 to 2013 is show in Fig 3.
Figure 3. China’s total CO2 emission and CO2 intensity during 2000 to 2013
There is a substantial growth of CO2 emission from 3 003.43 million tonsto9 534.22 million tons, with an annual growth rate of 9.46% from 2000 to 2013. When in 2003, 2004, 2005, 2007 and 2011, it has a greatly increase due to the developing secondary industry. Apparently, the CO2 intensity in China declines continuously during 2000 to 2013, whereas the slightly increase in 2003 probably be caused by the rapid expansion of infrastructures requiring the operation of energy-consuming industries [15]. It is obvious to find that the intensity of CO2 has a stable drop rate since 2009 with about 6% yearly. China’s government has been promoting technical innovation and other efficient measures presently to reduce CO2 emission, which contributes to making CO2 intensity downward steadily. It is worth mentioning that the total emission will continue to increase in a long time because of the developmental industrialization and urbanization in China.
3.2.1. Emissions of Different Sectors
Figure 4. China's CO2 emissions in four main sectors from 2000 to 2013
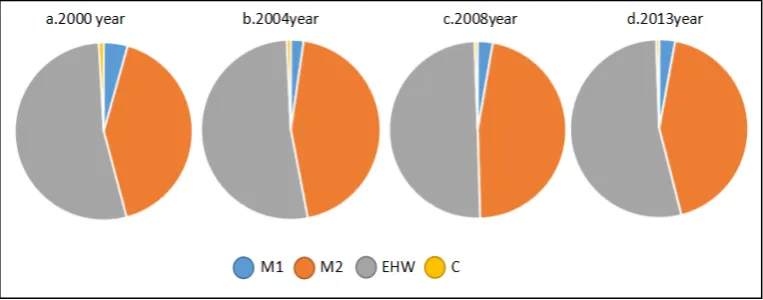
The CO2 emission of secondary industry ranks first, ranging from 2 299 million tons to 7 517 million tonsandaccounting for 83.5% of the total CO2 emissions on average, followed by tertiary industry and civil department. Primary industry have the smallest CO2 emissions. Noteworthy, the secondary industry has the highest growth rate of 9.62% on average, followed by tertiary industry and civil department with increase percentage of 8.30% and 8.15% respectively annually. The primary industry similarly has the lowest growth percentage of 6.23%. It is clear that taking some actions on secondary industry would contribute effectively to CO2 emissions mitigation. The civil department also should be consider seriously such as making some changes on human lifestyle [31]. It is necessary to subdivide the secondary industry due to its huge amount and varied sectors. Fig 5 (a. b. c. d) present the proportion of different sectors as mining, manufacturing, electricity and heating, and construction mentioned in Table 1 in 2000, 2004, 2008 and 2013.
Figure 5. The sectors of secondary industry in 2000, 2004, 2008, 2013
China's government has been paying more attention to the “manufacturing” sector recently and it is devoting to making it a powerful country on manufacture industry. Among the 10 sub-sectors of manufacturing defined in Section 2, the "smelting and pressing of metals" sub-sector produces the most CO2 that it generates average 51.2% of the manufacture emissions during 2000, 2008 and 2013 chosen in Fig 6. Obviously, the "smelting and pressing of metals" sub-sector definitely decides whether the carbon emission trend of the “manufacturing” sector is upward or not at some extent, but it will not decline greatly in a short time owing to China's booming economical construction. The flourishing housing industry causes the "non-metallic mineral" and the "wood processing" sectors increased continuously. When the construction and real estate reaches a satisfactory situation, it will cut down or remain a stable stage. The emissions of other eight sub-sectors have almost no change.
Figure 6. The CO2 emissions of sub-sectors in manufacturing during 2000, 2008 and 2013
3.2.2. Emissions of different energy types
Fig 7 (a, b, c, d) shows the proportion of energy for the energy-related CO2 emissions inventory in 2000, 2005, 2010 and 2013 respectively. There are four energy type as coal, coke, oil and gas. Clearly, the CO2 emissions carried by coal is maximum, accounting for 65% on average, followed by coke, accounting for 18.5%. The others take up 16.5% approximately in total. Coal is the largest primary energy source in China. More than 65% of the total energy used in China comes from coal [11].
Figure 7. CO2 emissions from four energies in 2000, 2005, 2010, 2013
emissions reduction because of its huge base number. While the CO2 emissions produced by coke and natural gas both increasing a little. It will have some efficient to promote coal mineral harness movement and encourage industries to adopt renewable alternative energy.
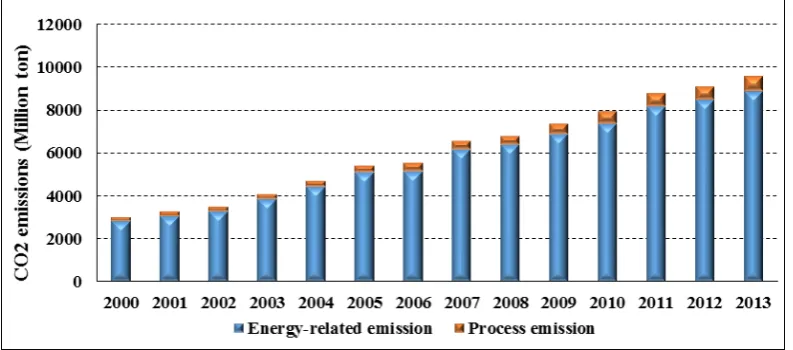
Figure 8. Energy-related and process CO2 emissions from 2000 to 2013
In addition to energy-related emissions, industrial processes also contribute to total CO2 emissions shown in Fig 8 with a percentage of 6.36% on average. It increased slightly due to the large quantities of manufacturing industries in China such as the "non-metal mineral sector" and the great production of cement, iron and steel. The emissions of industrial process should be giving preference by Chinese government.
4. Results and conclusion
This paper elaborates the detailed feature of China's carbon flow for 2013 with the carbon flow chart and gives changing characteristics of China's CO2 flow from the viewpoint of sector and energy during 2000 and 2013. Based on the findings presented above, the specific results are follows:
(1) There remains a upward trend in China's CO2 emissions with an approximately growth proportion of 7% annually, while the CO2 intensity of China diminishes lastly at different rates during 2000 to 2013 and it still decreases in the future.
(2) The CO2 emissions from secondary industry are prominent from the perspective of four main sectors that accounts for 83.5%. The “manufacturing” plays an important part in the secondary industry with 45%, in which the "smelting and pressing of metal" takes up a large percentage as about 50% in manufacturing.
(3) Although its total amount is small at present, the growth rate of civil department reaches up about 8% that should be pay more attention to.
(4) The CO2 emission produced by coal consumption keeps dominant in energy-related emissions with a contribution of 65%, while it will decrease in the future. Apart from this, the process emissions has a considerable growth speed of 11%.
(5) From the aspect of sectors, the CO2 emissions mainly come from the "electricity and heating" sector and the "smelting and pressing of metals" sub-sector, meanwhile the "non-metallic mineral" and the "wood processing" sectors occupy a string proportion.
government should take a series of actions to encourage innovation on techniques and management level then apply it immediately to the industrial sectors with a huge CO2 emissions flow. Secondly, the government should make different CO2 emissions reduction policies among different sectors. For example, the process emission plays an important role in "non-metallic mineral" while in "smelting and manufacturing of metals" it is energy. Thirdly, because the secondary industry has a great share of the total emission and is the pillar of China's economy, it is necessary to adjust its structure such as focusing on manufacturing and adopting the clean energy. In addition, coal is still a main source of CO2 emission. It is not reliable to shut down all coal mineral and alter it at once but the country can change the energy structure and promote renewable energy for powering by wind or other low-carbon energy. There has a finding that the combustion of coke oven gas has little emission with the same amount, which is twice or even more three times lower than the others. It will feasible to make full use of coke oven gas than coal. Finally, policy maker should be aware of the emissions from residents have been growing in a fast rate. It is effective to involve the public in the activity of energy conservation and carbon emissions reduction such as reducing the times of personal transportation.
Acknowledgments
This research are supported by funding from Cultivating program of excellent innovation team of Chengdu University of Technology (KYTD201406); Resources and the Environment Strategy Research Team of Sichuan’s High Level Social Science Research Team (2015-2017); Accounting and evaluation of carbon dioxide emission inventory in Sichuan: Sichuan Social Science Association planned project (SC16TJ006).
Author Contributions
All authors have made a significant contribution to this research. Minxi Wang and Xin Li conceived and designed the experiments; Xiandan Cui collected data and information; Minxi Wang provided methods and processed data; Xin Li analyzed the data Xiandan Cui wrote the paper.
Conflicts of Interest
The authors declare no conflict of Internet.
References
1. Yu Liu; Can Wang; Minpeng Chen. Carbon flow analysis of China’s agro-ecosystem from 1980 to 2013: A
perspective from substance flow analysis. J. Environ. Sci. 2016, 13-25. doi:10.1016/j.jes.2016.05.029 2. IPCC, 2014. Climate change: impacts, adaption, and vulnerability. Available online:
http://www.ipcc.ch/report/ar5/wg2/ (accessed on 7 September 2015)
3. BP (British Petroleum). BP statistical Review of world energy. BP. 2013.
4. Zhu L.J.; Yue C.; Wang S.P.; Fang J.G. Carbon emissions in China and major countries from 1850 to 2008.
Acta Scientiarum Naturalium Universitatis Pekinensis. 2010, 46(4), 479-504. (in Chinese)
5. Hu.J.L.; Lee,Y.C. Efficient three industrial waste abatement for regions in China. Int. J. Sustain. Dev. World
Ecol.2008, 15(1), 132-144.doi:10.1080/13504500809469778
6. Li; Z.D. Quantitative analysis of sustainable energy strategies in China. Energy Policy. 2010, 38(5), 2149-2160.
doi:10.1016/j.enpol.2009.06.031
7. Wang.T.; Waston.J. Scenario analysis of China’s emissions pathways in the 21st century for low-carbon
8. Huanan Li; Yi-Ming Wei; Zhifu Mi. China’s carbon flow: 2008-2012. Energy Policy. 2015, 80, 45-53. doi:10.1016/j.enpol.2015.01.025
9. Tianyu Qi; Yuyan Weng; Xiliang Zhang; Jiankun He. An analysis of the driving factors of energy-related
CO2 emission reduction in China from 2005 to 2013. Energy Economics.2016, 60, 15-22.
doi:10.1016/j.eneco.2016.09.014
10. Guan D.; Hubacek K.; Weber C.L.; Peters G.P. Journey to world top emitter: an analysis of the driving
forces of China’s recent CO2 emissions surge. Geophysical Research Letters. 2009, 36. dio: 10.1029/2008GL036540
11. U.S. Energy Information Administration(EIA). International energy outlook. 2010. Accessed online:
http://unfccc.int/2860.php
12. Dhakal, s. Urban energy use and carbon emissions from cities in China and policy implications. Energy
Policy.2009, 37, 4208-4219. doi:10.1016/j.enpol.2009.05.020
13. Dhakal, s. GHG emissions from urbanization and opportunities for urban carbon mitigation. Current
Opinion in Environmental Sustainability. 2010, 2, 227-283. doi:10.1016/j.cosust.2010.05.007
14. Yuli Shan; Dabo Guan; Jianghua Liu; Zhu Liu; Jingru Liu; Heike Schroeder; Yang Chen; Shuai Shao; Zhifu
Mi; Qiang Zhang. CO2 emissions inventary of Chinese cities. Atmos.Chem.Phys.Discuss.2016.
15. Mu H.L.; Li, H.N.; Zhang M.; Li M. Analysis of China’s carbon dioxide flow for 2008.Energy Policy. 2013, 54, 320-326. doi: 10.1016/j.enpol.2012.11.043
16. Zhang Ming; Mu Hailin; Ning Yadong. Accounting for energy-related CO2 emission in China during 1991
to 2006. Energy Policy. 2009, 37, 767-773. doi:10.1016/j.enpol.2008.11.025
17. Garry P. UK energy flow chart 2007. 2008. Accessed online:
http:/rs.resalliance.org/2008/09/05/uk-energy-flow-chart-2007/
18. Lawrence Livermore National Laboratory. US energy and carbon flow chart. 2011. Accessed online:
http://flowcharts.llnl.gov/index.html.
19. Li. Z. ; Fu F; Ma L.W. China’s energy flow chart based on energy balance sheet. Energy ofChina. 2006, 28(9),
5-10. (in Chinese)
20. Osaka University: TsujiLabs. Energy Sankey Diagram for Japan. 2007. Accessed online:
http://www.sankey-diagrams.com/tag/japan/.
21. Xie Shichen; Chen Changhong; Li lihuang; Cheng Cheng; Zhen Pudai; Lu Jun. The energy related carbon
dioxide emission inventory and carbon flow chart in Shanghai City. China Environmental Science. 2009, 29(11), 1215-1220. (in Chinese)
22. IPCC, 2006. Greenhouse gas inventory: IPCC guidelines for national greenhouse gas inventories. United
23. Peters G.; Weber C.; Liu J. Construction of Chinese energy and emissions inventory. Norwegian University of
Science and Technology.2006.
24. International Energy Agency(IEA). Cities, towns and renewable energy, Paris, France, 2009.
25. Feng K.; Davis S.J.; Sun L.; Li X.; Guan D.; Liu W.; Liu Z.; Hubacek K. Outsourcing CO2 within China.
Proceeding of the National Academy of Science. 2013, 110, 11654-11659. doi: 10.1073/pnas.1219918110
26. Wiedmann T.; Wood R.; Lenzen M.; Minx J.; Guan D.; Barrett J. Development of an embedded carbon
emissions indicator-producing a time series of input-output tables and embedded carbon dioxide
emissions for the UK by using a MRIO data optimisation system. Food and Rural Affairs,Defra,London.2008.
27. Liu Z.; Dong H.; Geng Y.; Lu C.; Ren W. Insights into the regional greenhouse gas (GHG) emission of
industrial processes: A case study of Shenyang, China. Sustainability. 2014, 6, 3669-3685. doi:10.3390/su6063669
28. Zhao X.; Ma Q.; Yang R. Factors influencing CO2 emissions in China’s power industry: Co-integration
analysis. Energy Policy.2013,57,89-98. doi:10.1016/j.enpol.2012.11.037
29. Zhou W.; Zhu B.; Li Q.; Ma T.; Hu S.; Griffy-Brown C. CO2 emissions and mitigation potential in China’s
ammonia industry. Energy Policy. 2010, 38, 3701-3709. doi:10.1016/j.enpol.2010.02.048
30. Lei Y.; Zhang Q.; Nielsen C.; He K. An inventory of primary air pollutants and CO2 emissions from cement
production in China during 1990 to 2020. Atmospheric Environment. 2011, 45, 147-154. doi:10.1016/j.atmosenv.2010.09.034
31. Shui Bin; Hadi Dowlatabadi. Consumer lifestyle approach to US energy use and the related CO2 emissions.
Energy Policy. 2005, 33, 197-208.