IJEDR1402200
International Journal of Engineering Development and Research (www.ijedr.org)2550
Permanent Deformation of Superpave and Marshall
Mix Using SPT Dynamic Modulus Test
1
J. Ahmad,
2M.Y. Abdul Rahman,
3M.R. Hainin
1Senior Lecturer, 3Professor
1Institute of Infrastructure Engineering and Sustainable Management, Faculty of Civil Engineering 1
Universiti Teknologi MARA, Shah Alam, Malaysia
1[email protected],2[email protected],3[email protected]
________________________________________________________________________________________________________ Abstract—Construction of pavements evolved and undergone many changes with regards to mix design methods and mix characterization over the years. The Marshall mix design method is currently used in Malaysia to construct hot mix asphalt (HMA) pavements. In this study, the Superpave mix design method was employed to design the HMA mix. Further investigations to evaluate the rutting performance of asphaltic mixtures using both mix design methods were conducted. Rutting is one of the most common pavement distresses in tropical climatic condition. This test was conducted on eight different types of HMA mixtures consisting of two different aggregate gradation of maximum nominal aggregate size of 12.5 and 9.5 mm. The binder used in the HMA mixture is of penetration grade 80-100 and 60-70. The Simple Performance Test (SPT) was used to evaluate rutting on both Superpave and Marshall mixes. Results showed that the Superpave mixtures are more rut resistant compared to Marshall mixtures. This is especially true for Superpave mixtures using binder penetration 60-70. The SPT provides a full characterization of the mix over a broad range of temperatures and loading frequencies, hence this test is highly recommended for evaluation of rutting performance in tropical climatic condition.
Index Terms—Permanent deformation, Simple Performance Test
________________________________________________________________________________________________________
I. INTRODUCTION
In Malaysia, asphaltic road dominates the overall surfacing types at 87,626 km of which only 343 km consists of concrete roads [1]. The asphaltic road has been designed using the Marshall mix design method for decades by the Malaysian Public Works Department (PWD) following the JKR/SPJ/2008 standard specification [2]. Until today, these pavements are still in service and have undergone maintenance work annually costing a large amount of money due to premature failure, increase in traffic loads and climatic conditions [3]. In tropical climatic conditions, rutting is prone to occur, hence with the successful implementation of Superpave method in the USA, it is timely to initiate a study or adopt a better mix design system for HMA pavements in Malaysia. Astudy also concluded that the Superpave designed hot-mix asphalt was found to use less binder than the conventional Marshall mixtures of the same design aggregate structure from the same quarry source [4] which agreed with studies conducted by other researchers in Jordan [5] and Taiwan [6]. A study in India also favored the use of Superpave gyratory compactor (SGC) which is capable of achieving a lower air void content than can be achieved by the mechanical Marshall compactor [7]. The Superpave mixtures also exhibit better creep resistance compared to Marshall mixtures in flexible pavement in Pakistan [8] and based on Iraq road specification, the results indicate that Superpave mixes have lower asphalt content [9]. Hence, from the economic point of view, Superpave mixes are better than Marshall mixes.
II. EXPERIMENTAL WORK
IJEDR1402200
International Journal of Engineering Development and Research (www.ijedr.org)2551
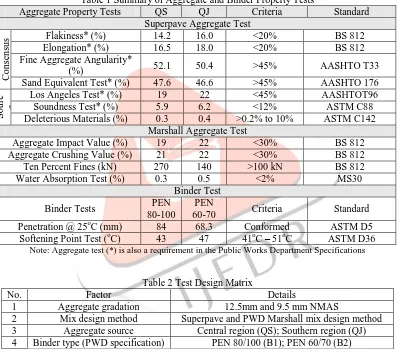
Fig.1 NMAS 12.5mm Aggregate GradationTable 1 Summary of Aggregate and Binder Property Tests
Aggregate Property Tests QS QJ Criteria Standard
Superpave Aggregate Test
C
o
n
sen
su
s Flakiness* (%) 14.2 16.0 <20% BS 812
Elongation* (%) 16.5 18.0 <20% BS 812
Fine Aggregate Angularity*
(%) 52.1 50.4 >45% AASHTO T33
Sand Equivalent Test* (%) 47.6 46.6 >45% AASHTO 176
So
u
rc
e
Los Angeles Test* (%) 19 22 <45% AASHTOT96
Soundness Test* (%) 5.9 6.2 <12% ASTM C88
Deleterious Materials (%) 0.3 0.4 >0.2% to 10% ASTM C142 Marshall Aggregate Test
Aggregate Impact Value (%) 19 22 <30% BS 812
Aggregate Crushing Value (%) 21 22 <30% BS 812
Ten Percent Fines (kN) 270 140 >100 kN BS 812
Water Absorption Test (%) 0.3 0.5 <2% MS30
Binder Test
Binder Tests PEN
80-100
PEN
60-70 Criteria Standard
Penetration @ 25oC (mm) 84 68.3 Conformed ASTM D5
Softening Point Test (oC) 43 47 41oC – 51oC ASTM D36 Note: Aggregate test (*) is also a requirement in the Public Works Department Specifications
Table 2 Test Design Matrix
No. Factor Details
1 Aggregate gradation 12.5mm and 9.5 mm NMAS
2 Mix design method Superpave and PWD Marshall mix design method 3 Aggregate source Central region (QS); Southern region (QJ) 4 Binder type (PWD specification) PEN 80/100 (B1); PEN 60/70 (B2)
III. RESULTS AND ANALYSIS
IJEDR1402200
International Journal of Engineering Development and Research (www.ijedr.org)2552
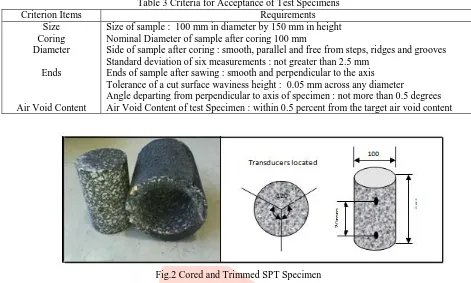
Table 3 Criteria for Acceptance of Test SpecimensCriterion Items Requirements
Size Coring Diameter
Ends
Air Void Content
Size of sample : 100 mm in diameter by 150 mm in height Nominal Diameter of sample after coring 100 mm
Side of sample after coring : smooth, parallel and free from steps, ridges and grooves Standard deviation of six measurements : not greater than 2.5 mm
Ends of sample after sawing : smooth and perpendicular to the axis Tolerance of a cut surface waviness height : 0.05 mm across any diameter
Angle departing from perpendicular to axis of specimen : not more than 0.5 degrees Air Void Content of test Specimen : within 0.5 percent from the target air void content
Fig.2 Cored and Trimmed SPT Specimen
The SPT dynamic modulus test procedures follow the test protocols described in NCHRP in Project 9-19, Superpave Support and Performance Models Management [11]. Three Linear Variable Displacement Transducers (LVDT), were placed at 120degrees on the specimen surface to capture full range accumulation of the compressive permanent deformation. A continuous uniaxial sinusoidal (haversine) compressive stress at a specified test frequency is applied to the unconfined cylindrical test specimen in a cyclic manner. The dynamic load was properly adjusted during the tests to keep the strain level between 75 to 125 microstrain. The strain level should be checked after completion of the test, otherwise the dynamic pulse load is increased or decreased to adjust the strain to be within the limits. In order to develop master curves for all the mixtures, each specimen was tested at six different temperatures and six frequencies for each test temperature. Prior to testing, the specimens must be placed in the testing chamber until the effective temperature, contact stress and confining pressure were achieved. It is also important to ensure the specimens were placed in the centre under the loading platens as shown in the schematic diagram in Figure 3.
Fig. 3 Schematic Diagram of SPT Dynamic Modulus Test Setup
To begin the test, the LVDTs were zeroed, and minimal contact load was applied to specimen. A sinusoidal compressive load was applied on the specimen in a cyclic manner. Calculations performed is divided into four steps to determine the loading stress (o), recoverable strain (o), dynamic modulus (E*) and finally the phase angle (). The associated equations are as listed
IJEDR1402200
International Journal of Engineering Development and Research (www.ijedr.org)2553
Loading stress applied to specimen :o =
A
P
(1)
The recoverable axial strain from individual strain gauges :
o =
GL
Δ
(2) Dynamic modulus for each LVDT :
E* = o o
ε
σ
(3)
Phase angle for each LVDT :
=
(360)
p i
t
t
(4)
Where o = stress
P = average load amplitude A = area of specimen
o = strain, = average deformation amplitude
GL = gauge length
= phase angle
ti = average time lag between a cycle of stress and strain
tp = average time for a stress cycle
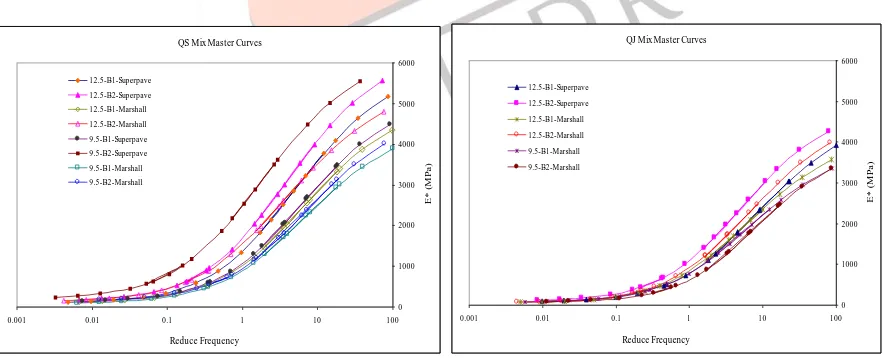
To determine susceptibility of these mixes to rutting deformation at high temperature, stiffer layer is desired to resist the permanent deformation. Figure 4 shows the dynamic modulus master curves constructed for QS and QJ mixtures using the principle of time-temperature superposition. The master curves were shifted to simulate environmental conditions and to compare the dynamic modulus of different mixtures across testing temperatures and frequencies. The dynamic modulus test results showed that the dynamic modulus of HMA was dependent on both the loading rate and test temperature. Mixtures were stiffer at a low temperature and high frequency and the dynamic modulus values were lowest at the combination of the highest temperature and lowest frequency.
Fig. 4 Dynamic Modulus Master Curve for QS and QJ HMA Mixtures
Results from the SPT dynamic modulus test can be used to rank different HMA mixes. A comparison to rank the different mixtures was established from modular ratio [12]. The modular ratio (R) can be calculated as follows:
ference mix
E
E
R
Re*
*
(5)QS Mix Master Curves
0 1000 2000 3000 4000 5000 6000
0.001 0.01 0.1 1 10 100
Reduce Frequency E* ( M P a ) 12.5-B1-Superpave 12.5-B2-Superpave 12.5-B1-Marshall 12.5-B2-Marshall 9.5-B1-Superpave 9.5-B2-Superpave 9.5-B1-Marshall 9.5-B2-Marshall
QJ Mix Master Curves
0 1000 2000 3000 4000 5000 6000
0.001 0.01 0.1 1 10 100
IJEDR1402200
International Journal of Engineering Development and Research (www.ijedr.org)2554
where, R = modular ratioE*mix = Dynamic Modulus value for given mixture
E*Reference = Dynamic Modulus value for reference mixture.
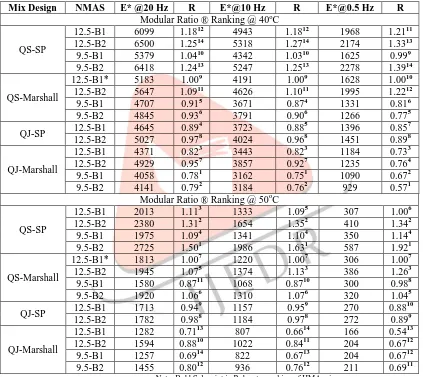
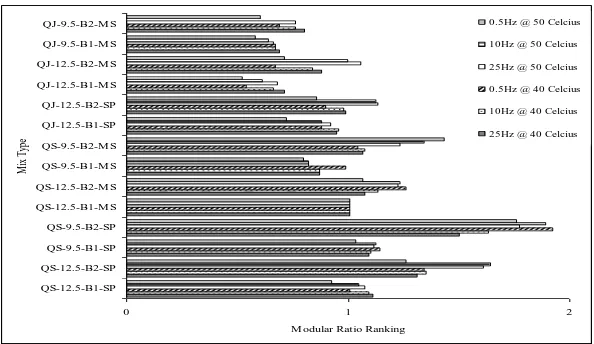
Results tabulated in Tables 4 and Table 5 show the HMA mixture modular ratio ranking at 40oC and 50oC at three different loading frequencies (20Hz, 10Hz and 0.5Hz). The 12.5-B1-QJ-Marshall mix was used as the reference mixture to calculate modular ratio. At higher temperatures, the most significant permanent deformation that occurred on pavement is rutting. The HMA mix must be stiff enough to withstand rutting and the best HMA mix is the one with the highest E* values. Again, results do not show many variations at different loading frequencies. As shown in Figure 5, it is noticeable that the least susceptible against permanent deformation are QS-Superpave mixes, specifically 9.5-B2-QS-SP followed by 12.5-B2-QS-SP. In addition, results also revealed that the mixture utilising B2 binder type is stiffer and is more resistant to rutting at high temperatures than the mix with B1 binder. It can be concluded that with regards to mix design methods, Superpave-designed mixtures are more resistant to permanent deformation than the Marshall-designed mixtures.
Table 4 Modular Ratio (R) Ranking @ 40oC and 50oC
Mix Design NMAS E* @20 Hz R E*@10 Hz R E*@0.5 Hz R
Modular Ratio ® Ranking @ 40oC
QS-SP
12.5-B1 6099 1.1812 4943 1.1812 1968 1.2111
12.5-B2 6500 1.2514 5318 1.2714 2174 1.3313
9.5-B1 5379 1.0410 4342 1.0310 1625 0.999
9.5-B2 6418 1.2413 5247 1.2513 2278 1.3914
QS-Marshall
12.5-B1* 5183 1.009 4191 1.009 1628 1.0010
12.5-B2 5647 1.0911 4626 1.1011 1995 1.2212
9.5-B1 4707 0.915 3671 0.874 1331 0.816
9.5-B2 4845 0.936 3791 0.906 1266 0.775
QJ-SP 12.5-B1 4645 0.89
4
3723 0.885 1396 0.857
12.5-B2 5027 0.978 4024 0.968 1451 0.898
QJ-Marshall
12.5-B1 4371 0.823 3443 0.823 1184 0.733
12.5-B2 4929 0.957 3857 0.927 1235 0.764
9.5-B1 4058 0.781 3162 0.751 1090 0.672
9.5-B2 4141 0.792 3184 0.762 929 0.571
Modular Ratio ® Ranking @ 50oC
QS-SP
12.5-B1 2013 1.113 1333 1.095 307 1.006
12.5-B2 2380 1.312 1654 1.352 410 1.342
9.5-B1 1975 1.094 1341 1.104 350 1.144
9.5-B2 2725 1.501 1986 1.631 587 1.921
QS-Marshall
12.5-B1* 1813 1.007 1220 1.007 306 1.007
12.5-B2 1945 1.075 1374 1.133 386 1.263
9.5-B1 1580 0.8711 1068 0.8710 300 0.988
9.5-B2 1920 1.066 1310 1.076 320 1.045
QJ-SP 12.5-B1 1713 0.94
9
1157 0.959 270 0.8810
12.5-B2 1782 0.988 1184 0.978 272 0.899
QJ-Marshall
12.5-B1 1282 0.7113 807 0.6614 166 0.5413
12.5-B2 1594 0.8810 1022 0.8411 204 0.6712
9.5-B1 1257 0.6914 822 0.6713 204 0.6712
9.5-B2 1455 0.8012 936 0.7612 211 0.6911
IJEDR1402200
International Journal of Engineering Development and Research (www.ijedr.org)2555
Fig. 5 HMA Mix Type Ranking at 40oC and 50oCIV. CONCLUSION
The findings in this study showed that the Superpave designed mixes showed better resistant to permanent deformation compared to Marshall designed mix. Results have provided significant findings on the rutting pavement performance of Marshall and Superpave mixtures based on the SPT dynamic modulus test at high temperature of 40oC and 50oC and ranked from modular ratio (R). This is also evident when the Superpave designed mixes using binder of PEN 60-70 (B2) gave better resistant to deformation compared to the conventional PEN 80-100 binder. The local material also satisfies the Superpave consensus and source aggregate properties criteria and is therefore suitable for use in the Superpave system. Hence, Superpave-designed mixes are more superior and least susceptible to permanent deformation compared to Marshall-designed mixes.
REFERENCES
[1] Report (2009) Office of Engineering and Highway Operations R&D, FHWA-RD-90-019 Road Engineering Association of Asia and Australasia, “Statistical Profile of REAAA Member Countries” REAAA News, pp.7, PP2372/12/2009(022739)
[2] Jabatan Kerja Raya (2008) “Standard Specifications for Road Works”, Kuala Lumpur, Malaysia, JKR/SP/2008
[3] Juraidah Ahmad, Nur Izzi Md. Yusoff, Mohd Rosli Hainin, Mohd Yusof Abd Rahman and Mustaque Hossain, “Investigation into hot-mix asphalt moisture-induced damage under tropical climatic conditions”, Construction and Building Materials Issue 50, pp.567-78, 2014
[4] Juraidah Ahmad, Mohd Yusof Abdul Rahman, Mohd Rosli Hainin and Mustaque Hossain. “Comparative evaluation of hot-mix asphalt design methods”, International Journal of Pavement Engineering, Vol.13:No.2, pp.89-97, 2012
[5] Asi I.M. “Performance evaluation of Superpave and Marshall asphalt mix designs to suite Jordan climatic and traffic conditions”, Construction and Building Materials Vol.21, pp. 1732-40, 2007
[6] Wang, J.N., Kennedy, T.W. and McGennis, R.B. “Volumetric and mechanical performance properties of Superpave mixtures”. Journal of Materials in Civil Engineering, pp. 238-245, 2001
[7] Swami B.L., Mehta Y.A., Bose S. “A Comparison of the Marshall and Superpave design procedure for materials sourced in India”, International Journal of Pavement Engineering, Vol.5, pp. 163-73, 2004
[8] Khan K.M. and Kamal M.A. “Impact of Superpave mix design method on rutting behavior of flexible pavement in Pakistan”, Arab Journal of Science Engineering. Vol. 33, pp. 379-90, 2008
[9] Ahmad N.G. and Ismail N.M. “Comparative evaluation for mix design of Marshall and Superpave methods”, Journal of Engineering Development.Vol. 13, pp. 1-20, 2009
[10]Witczak, M.W., Bonaquist, R., Van Quintus, H. and Kaloush, K. (1999) “Specific geometry and aggregate size laboratory test study” NCHRP 9-19, Task C, Team Report SLS-3, Arizona State University, Tempe, AZ.
[11]Witczak, M., Schwartz, C. and Von Quintus, H. “NCHRP Project 9-19, Superpave support and performance models management”, Interim report, Federal Highway Administration and the National Cooperative Highway Research Program 2001
[12]Kaloush, K., Witczak, M.W., Sotil, A. and Way, G. “Laboratory evaluation of asphalt rubber mixtures using dynamic modulus (E*) test”. Transportation Research Board, National Highway Research Council, Washington, D.C. 2013
0 1 2
QS-12.5-B1-SP QS-12.5-B2-SP QS-9.5-B1-SP QS-9.5-B2-SP QS-12.5-B1-M S QS-12.5-B2-M S QS-9.5-B1-M S QS-9.5-B2-M S QJ-12.5-B1-SP QJ-12.5-B2-SP QJ-12.5-B1-M S QJ-12.5-B2-M S QJ-9.5-B1-M S QJ-9.5-B2-M S
M
ix T
ype
M odular Ratio Ranking
0.5Hz @ 50 Celcius
10Hz @ 50 Celcius
25Hz @ 50 Celcius
0.5Hz @ 40 Celcius
10Hz @ 40 Celcius