ISSN (Print) : 2320 – 3765 ISSN (Online): 2278 – 8875
I
nternational
J
ournal of
A
dvanced
R
esearch in
E
lectrical,
E
lectronics and
I
nstrumentation
E
ngineering
(A High Impact Factor, Monthly, Peer Reviewed Journal)
Website: www.ijareeie.com
Vol. 7, Issue 5, May 2018
Voltage Sag and Swell improvement by
Unified Power Quality Conditioner (UPQC)
A.Ramya1, R.Durga2
Assistant Professor, Dept of EEE, Jeppiaar Institute of Technology, Chennai, TamilNadu, India1,2
ABSTRACT: Nowadays, the problem of voltage sags and Swells create a severe impact on sensitive loads in industries. Due to which load shedding and over voltages might occur. Several custom power devices can be used to overcome this problem.This paper describes UPQC principles for the effect of load VAR variation and voltage compensation methods during three-phase fault for balanced / unbalanced voltage sags and swells in a power system. UPQC consists of a nine switch power converter having two sets of output terminals in place of a twelve switch back to back converter with a combination of shunt active power filter and series active power filter. This converter features unity input power factor and more importantly, low manufacturing cost due to its reduced number of active switches. Simulation results carried out by MATLAB/Simulink to verify the performance of the proposedmethod.
KEYWORDS: Load Shedding, Over Voltage, Unified Power Quality Conditioner, Back to back converter, MATLAB
I.INTRODUCTION
In an industrial facility much of the electrical equipment requires high-quality electricity; it will not tolerate sags, swells, transients, or harmonics, and it certainly will not tolerate power outages, no matter how short-lived. Voltage support at a load can be achieved by reactive power injection at the load point of common coupling (PCC). Unified power quality conditioner can absorb active power or inject active power. A UPQC is a combination of shunt and series APFs, sharing a common dc link.
It is a versatile device that can compensate almost all power quality problems such as voltage harmonics, voltage unbalance, voltage flickers, voltage sags & swells, current harmonics, current unbalance, reactive current, etc. This paper is based on the steady state analysis of UPQC during voltage sag and swells on the system. The main objective of this article is to maintain the load bus voltage sinusoidal and at desired constant level in all operating conditions.
II.POWER QUALITY PARAMETERS
Voltage changes can range from small voltage fluctuations of short duration to a complete outage for an extended period of time.
The major types of power quality problems are, Voltage Sag
Voltage swell Interruption Distortion Harmonics
A. Interruption:
ISSN (Print) : 2320 – 3765 ISSN (Online): 2278 – 8875
I
nternational
J
ournal of
A
dvanced
R
esearch in
E
lectrical,
E
lectronics and
I
nstrumentation
E
ngineering
(A High Impact Factor, Monthly, Peer Reviewed Journal)
Website: www.ijareeie.com
Vol. 7, Issue 5, May 2018
Figure 1 – Interruption
B. Voltage Sags
A sag is decrease in voltage between 0.1 and 0.9 p.u. at the power frequency for duration from 0.5 cycle to 1min. Voltage sags are usually associated with system faults but can also cause by energisation of heavy loads at starting of large motors.
Figure 2 – Voltage Sags C. Swells
A swell is increase in voltage between 1.1 and 1.8pu at power frequency for duration from 0.5cycle to1min. The severity of voltage swell during a fault condition is a function of fault location, system impedance and grounding.
Figure 3 – Voltage Swells D. Waveform Distortion
ISSN (Print) : 2320 – 3765 ISSN (Online): 2278 – 8875
I
nternational
J
ournal of
A
dvanced
R
esearch in
E
lectrical,
E
lectronics and
I
nstrumentation
E
ngineering
(A High Impact Factor, Monthly, Peer Reviewed Journal)
Website: www.ijareeie.com
Vol. 7, Issue 5, May 2018
Figure 4 Waveform Distortion E. Harmonics
Harmonics are sinusoidal voltages or currenthaving frequency that are integer multiples of thefundamental frequency.
III.FACTS DEVICES
The practical operating capacity of a transmissionline is much less than the installed capacity this leads to optimal operation of the power system. Factsconcepts help in using the real capacity of a transmission system without adding any new lines.
Thenew generation FACTS devices are, STATCOM
SSSC UPFC UPQC
A. Static Synchronous Compensator(STATCOM):
Static synchronous compensator is applied in shunttransmission lines and can adjust the required reactivepower dynamically and within the limits of capabilityof converter.
B. Static Synchronous Series Compensator(SSSC)
Static synchronous series compensator is installedin series and injects the voltage with controlledmagnitude and angle.
C. Unified Power Flow Controller(UPFC):
UPFC is one of the unique equipment in factswhich is used in series and shunt on transmission line. UPFC consists of two VSC and a DC link. This DClink may be a capacitor or any kind of DC source. Oneconverter operates in shunt and other in series.
D. Unified Power Quality Controller (UPQC):
The UPQC, just as in a UPFC employs two voltage source inverters (VSIs) that connectedto a d.c. energy storage capacitor. One of these two VSIs isconnected in series with a.c. line while the other is connectedin shunt with the a.c. system.A UPQCthat combines the operations of a DistributionStatic Compensator (DSTATCOM)and DynamicVoltageRegulator (DVR)together.
The series and shunt-active filters are connected in a back-to-back configuration, in which the shunt converter is responsible for regulating the common DC-link voltage.
IV.DESIGN OF UPQC CONTROLLER
ISSN (Print) : 2320 – 3765 ISSN (Online): 2278 – 8875
I
nternational
J
ournal of
A
dvanced
R
esearch in
E
lectrical,
E
lectronics and
I
nstrumentation
E
ngineering
(A High Impact Factor, Monthly, Peer Reviewed Journal)
Website: www.ijareeie.com
Vol. 7, Issue 5, May 2018
Current flowing in the line. The small sinusoidal in-phase component in the injected voltage results in the right amount of active power flow into the Inverter to compensate for the losses within the Series APF and to maintain the D.C side capacitor voltage constant. Obviously the D.C voltage control loop will decide the amount of this in-phase component. Seriesactive power Filter compensate current system distortion caused by nonlinear load by imposing a high impedance path to the harmonic current
.
Figure 5 overall configuration and control of UPQC
V.SYSTEM CONFIGURATION
The nine switch converter is formed by tying three semiconductor switches per phase, giving a total of nine for all three phases. The nine switches are powered by a common dc link, which can either be a microsource or a capacitor depending on the system requirements. Like most reduced component topologies the nine-switch converter faces limitations imposed on its assumable switching states, unlike the fully decoupled back-to-back converter that uses 12 switches. Those allowable switching states can conveniently be found in Table I, from which,it is clear that the nine-switch converter can only connect its two output terminals per phase to either Vdc or 0V, or its upper terminal to the upper dc rail P and lower terminal to thelower dc rail N. the lastcombination of connecting its upper terminal to N and lower terminal to P is not realizable, hence constituting the first limitation faced by the nine switch converter.
That limitation is nonetheless not practically detrimental, and can be resolved by coordinating the two modulating references per phase, so that the reference for the upper terminal is always placed above that of the lower terminal.
ISSN (Print) : 2320 – 3765 ISSN (Online): 2278 – 8875
I
nternational
J
ournal of
A
dvanced
R
esearch in
E
lectrical,
E
lectronics and
I
nstrumentation
E
ngineering
(A High Impact Factor, Monthly, Peer Reviewed Journal)
Website: www.ijareeie.com
Vol. 7, Issue 5, May 2018
Figure 6(b) - Same amplitude different frequency
Imposing this basic rule of thumb on reference placement then results in those gating signals drawn in fig 5 for the three switches of S1, S2 and S3 per phase. Equations for producing them can also be stated as
Signal obtained from (1) when applied to nine switch converter, their output voltages are represented by VRN and VAN per phase. Together these voltage transitions show that the forbidden state of VAN =0v and VRN = Vdc is effectively blocked off. The blocking is, however, attained at the incurrence of additional constraints limiting the reference amplitudes and phase shift. These limitations are especially prominent for references having sizable amplitudes and different frequencies.
VI.SIMULATION RESULTS
The pulses for IGBT are given through the pulse width modulation which is generated by comparing sine waves of same amplitude and different frequency as shown in figure 7.
X axis: Time (sec) Y axis: Voltage(volts)
ISSN (Print) : 2320 – 3765 ISSN (Online): 2278 – 8875
I
nternational
J
ournal of
A
dvanced
R
esearch in
E
lectrical,
E
lectronics and
I
nstrumentation
E
ngineering
(A High Impact Factor, Monthly, Peer Reviewed Journal)
Website: www.ijareeie.com
Vol. 7, Issue 5, May 2018
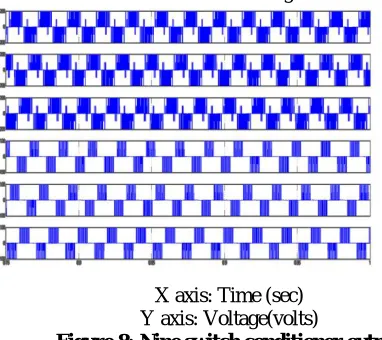
The simulation of the nine switch conditioner has been shown in figure 8.
X axis: Time (sec) Y axis: Voltage(volts)
Figure 8: Nine switch conditioner output
The simulation shows of three phase voltage sag . The simulation started with theSupply voltage 50% sagging as shown in Figure 9 .
X axis: Time (sec) Y axis: Voltage(volts)
Figure 9(a): Voltage sag simulated output
In Figure 9 also shows a 50% voltage saginitiated at 0.3 s and it is kept until 0.5s, with total voltage sag duration of 0.2s. Figures 10 show the voltage injected by the UPQC and the corresponding load voltage with compensation.
X axis: Time (sec) Y axis: Voltage(volts)
ISSN (Print) : 2320 – 3765 ISSN (Online): 2278 – 8875
I
nternational
J
ournal of
A
dvanced
R
esearch in
E
lectrical,
E
lectronics and
I
nstrumentation
E
ngineering
(A High Impact Factor, Monthly, Peer Reviewed Journal)
Website: www.ijareeie.com
Vol. 7, Issue 5, May 2018
As a result of UPQC, the load voltage is kept at 1 pu. Through simulation the supply voltage with one phase voltage dropped down to 50%.The effectiveness of the UPQC under unbalanced conditions is shown in figure ,
The second simulation shows the UPQC performance during a voltage swell condition. The simulation started with the supply voltage swell is generated as shown in Figure 11.
X axis: Time (sec) Y axis: Voltage(volts)
Figure 10(a): Voltage swell simulated output
As observed from this figure the amplitude of supply voltage is increased about 25% from its nominal voltage. As can be seen from the results, the load voltage is kept at the nominal value with the help of theUPQC. Similar to the case of voltage sag, the UPQC reactsquickly to inject the appropriate voltage component (negative voltage magnitude) to correct the supply voltage.
X axis: Time (sec) Y axis: Voltage(volts)
Figure 10(b): Swell compensated output
VII.CONCLUSION
ISSN (Print) : 2320 – 3765 ISSN (Online): 2278 – 8875
I
nternational
J
ournal of
A
dvanced
R
esearch in
E
lectrical,
E
lectronics and
I
nstrumentation
E
ngineering
(A High Impact Factor, Monthly, Peer Reviewed Journal)
Website: www.ijareeie.com
Vol. 7, Issue 5, May 2018
SIMULATED VALUES:
Sag Voltage 6500 V
Compensated Voltage 6520 V Swell Voltage 1.14*104 V Compensated Voltage 6500 V Output voltage of
conditioner
400 V
REFERENCES
[1] H. Akagi, “New trends in active filters for improvingpower quality”, Proceedings of the 1996 International Confe,Vol.1, Jan 1996, pp. 417 –425 [2] B. Singh, K. Al-Haddad, A. Chandra, “A Review of Active Power Filters for Power Quality Improvement”, IEEE Trans on Industrial Electronics, Vol. 45, No.5, Oct1999, pp. 960-071.
[3] Khadkikar V, Agarwal P, Chandra A, Barry A O and Nguyen T.D, “A simple new control technique for unified power quality conditioner (UPQC)”, Harmonics and Quality of Power, 2004. 11th International Conference on 12-15 Sept.2004, pp. 289 – 293.
[4] Muthu, S.; Kim, J.M.S, “Steady-state operating characteristics of unified active power filters.” Applied Power Electronics Conference and Exposition, 1997. APEC '97 Conference Proceedings 1997, Twelfth Annual, Volume: 1, 23-27 Feb 1997, pp. 199 -205.
[5] Li R.; Johns A T. and Elkateb M.M., “Control concept of Unified Power Line Conditioner.” Power Engineering Society Winter Meeting, 2000. IEEE, Volume:4 , 23-27 Jan 2000, pp. 2594 -2599.
[6] Elnady A and Salama M.M.A., “New functionalities of the unified power quality conditioner.” Transmission and Distribution Conference and Exposition, 2001 IEEE/PES,Volume: 1, 28 Oct.-2 Nov 2001, pp. 415 -420.
[7] Basu M, Das S.P. and Dubey G.K., “Performance study of UPQC-Q for load compensation and voltage sag mitigation.”IECON 02, IEEE, Volume: 1, 5-8 Nov 2002, pp. 698 -703.
[8] D.MahindaVilathgamuwa,H.M.Wijekoon,andS.S.Choi, ―A Novel Technique to Compensate Voltage Sags in Multiline Distribution system,‖
IEEE Trans on Industrial Electronics, vol.53,PP.160 oct 2006.
[9] R. Naidoo and P. Pillay, ―A new method of voltage sag and swell detection,‖IEEE Trans. Power Del., vol. 22, no. 2, pp. 1056–1063, Apr.2007. [10] Rosli Omar and NasrudinAbd Rahim , ― Mitigation of Voltage Sags/Swells using Dynamic Voltage Restorer (DVR),‖ARPN Journal of