Cancer Management and Research
Dove
press
O R I G I N A L R E S E A R C H
open access to scientific and medical research
Open Access Full Text Article
Association of fatigue and depression with
circulating levels of proinflammatory cytokines
and epidermal growth factor receptor ligands:
a correlative study of a placebo-controlled
fatigue trial
Tyvin Rich1,*
Fengmin Zhao2,*
Ricardo A Cruciani3
David Cella4
Judith Manola2
Michael J Fisch5
1Hampton University Proton Therapy
Institute, Hampton, VA, 2Dana-Farber
Cancer Institute, Boston, MA, 3Beth
Israel Medical Center, New York, NY,
4Northwestern University Feinberg
School of Medicine, Chicago, IL, 5The
University of Texas MD Anderson Cancer Center, Houston, TX, USA
*These authors contributed equally to this work
Context: The biology of fatigue and depression in cancer patients is poorly understood. Hypotheses regarding cytokines and growth factors related to sickness behavior and disruption of circadian signaling have been proposed.
Objectives: We prospectively examined proinflammatory cytokines (e.g., sickness behavior model) and epidermal growth factor receptor (EGFR) ligands (e.g., circadian disruption model) in the serum of cancer patients enrolled in a clinical trial testing levocarnitine for fatigue.
Methods: Serum samples were collected at baseline and week 4. Cytokine/growth factor analyses were performed with a Luminex analyzer. The Brief Fatigue Index and the Center for Epidemiologic Studies Depression Index were used to measure fatigue and depression severity. The association between cytokine and symptoms was examined using logistic models.
Results: Among 101 analyzable patients, all ten cytokines/growth factors examined were highly elevated at baseline and all significantly decreased at week 4 (p<0.001) regardless of treatment intervention. At baseline, the odds of severe fatigue significantly increased for patients with higher level of interleukin-1 receptor antagonist (IL-1Ra), whereas patients with higher levels of IL-1Ra, tumor necrosis factor-α, interleukin (IL)-6, IL-8, interferon-γ, transforming growth factor α, and vascular endothelial growth factor had higher odds of severe depression. At week 4, fatigue (p=0.023) and depression (p=0.007) responders had less decrease in IL-1 level than the corresponding non-responders.
Conclusion: In this correlative analysis of a fatigue clinical trial, levels of fatigue were signifi-cantly associated with levels of IL-1 and IL-1Ra. Circadian-signaling pathways related to EGFR signaling were correlated with depression as were other cytokines. A major placebo effect was associated with a global decrease in cytokine and growth factors. These data provide further basis for testing hypotheses regarding the mechanisms of fatigue and depression in cancer patients.
Keywords: fatigue, depression, proinflammatory cytokine, circadian-signaling pathways, cancer, placebo effect
Introduction
Fatigue is the most commonly reported symptom in cancer patients. Clinical factors that may impact the development of fatigue, such as disease progression, depression, poor nutritional status, and treatment, are often considered. The underlying molecular Correspondence: Tyvin Rich
Hampton University Proton Therapy Institute, 40 Enterprise Parkway, Hampton, VA 23666, USA Tel +1 757 251 6819 Email [email protected]
Journal name: Cancer Management and Research Article Designation: ORIGINAL RESEARCH Year: 2017
Volume: 9
Running head verso: Rich et al
Running head recto: Association of cytokines with fatigue and depression DOI: http://dx.doi.org/10.2147/CMAR.S115835
Cancer Management and Research downloaded from https://www.dovepress.com/ by 118.70.13.36 on 20-Aug-2020
For personal use only.
This article was published in the following Dove Press journal: Cancer Management and Research
31 January 2017
Dovepress Rich et al
mechanism of fatigue, however, is still poorly understood. Biological factors that have been examined in recent years include cytokine dysregulation, hypothalamic–pituitary– adrenal axis dysfunction, 5 hydroxy tryptophan neurotrans-mitter dysregulation, circadian rhythm disruption, alterations of muscle metabolism, vagal afferent activation, and genomic factors.1 Two “cytokine” hypotheses regarding the production of fatigue and related symptoms in cancer patients are the focus in this report.
The first is based on the “sickness behavior model”2 that is thought to be related mechanistically to elevation of serum and brain levels of proinflammatory cytokines of the interleukin (IL) family (e.g., IL-1, IL-1Ra, and IL-6).3–9 Activation of this cytokine signaling in the peripheral and central nervous system by cancer or cancer treatment has been shown to lead to malaise, poor appetite, and social withdrawal, which are believed to underlie fatigue, cognitive disturbances, and depression.10,11 The second hypothesis is that symptoms could be due to the inhibition of circadian-signaling pathways. This hypothesis is based on extensive laboratory data12 showing inhibition of downstream hypotha-lamic signaling from the master clock in the suprachiasmic nucleus and corroborated by clinical observations.13 The inhibition of these hypothalamic signaling pathways can pro-duce fatigue, suppress feeding activity, and cause malaise. Elevation of circulating levels of ligands of the epidermal growth factor receptor (EGFR), such as epidermal growth factor (EGF), transforming growth factor α (TGF-α), and neuregulin,14,15 can act to inhibit neural signaling that drives normal behaviors, in laboratory studies.
The patients reported here were enrolled on a treatment intervention study conducted by The Eastern Cooperative Oncology Group (ECOG) E4Z02: a phase III, randomized, double-blinded, placebo-controlled study to determine the effectiveness of levocarnitine supplementation in the man-agement of moderate-to-severe fatigue in cancer patients. The mechanism for this intervention and the preliminary laboratory and clinical data supporting this have been described previously.16 The final analysis of the primary endpoint showed no significant difference in fatigue between levocarnitine and placebo treatments.16 Shortly after the E4Z02 study opened, this correlative laboratory study of ten serum cytokines was initiated based on the hypotheses mentioned above. The specific objectives of the correlative study are: 1) to measure serum levels of proinflammatory cytokines and growth factors (hereafter referred to as cytokines), and 2) to correlate cytokines with fatigue and depression.
Patients and methods
Patients and treatment
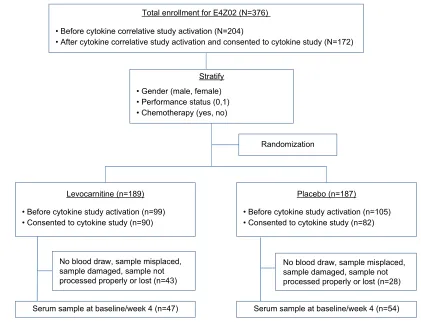
A subset of the E4Z02 patients was included in the current report (Figure 1). All patients were enrolled to E4Z02 through ECOG-affiliated institutions and were recruited when they checked in for their clinical appointment. Eligible patients were required to have a confirmed invasive malignant disorder (at any stage of any site and at any point in their cancer treat-ment) and have moderate-to-severe fatigue (defined as a score of ≥2 on a Likert-type 0–4 rating scale from the Functional Assessment of Chronic Illness Therapy (FACIT-F; http://www. facit.org/) question: “I feel fatigued”) recorded as an outpa-tient within 4 weeks prior to registration. More details about patient eligibility criteria could be found in Cruciani et al.17 The protocol was approved by the Eastern Cooperative Oncology Group (ECOG) national review board at each participating institution. After providing written informed consent, patients were randomized in a 1:1 ratio to receive 2000 mg/day (two 1000 mg doses) of either levocarnitine or placebo (both in liquid form) for 4 weeks. For weeks 5–8 (extension phase), all patients received 2000 mg/day of open-label levocarnitine.16
Assessment of symptoms
All symptom assessments were completed at baseline (prior to the initiation of levocarnitine or placebo) and week 4 (after starting protocol therapy). Severity of fatigue was assessed using the Brief Fatigue Inventory (BFI).17 The total fatigue score (range: 0–10) was the average score for all nine items in BFI, with a higher score indicating worse fatigue. Severe fatigue, however, is defined as scores ≥7 for the “worst” fatigue level during past 24 hours item due to “its conceptual simplicity and close relation to function interfer-ence”.17 Severity of depression was assessed with Center for Epidemiologic Studies Depression Scale (CES-D).18,19 The total depression score (range: 0–60) was the sum of the scores for all 20 items, with a higher score indicating worse depression. A total score of ≥16 was considered a potentially significant level of depression,18,19 which was called severe depression in the study.
Compared with baseline, a ≥50% improvement at 4 weeks of the BFI and CES-D total scores was considered a symptom response in the present analysis.20 As a sensitivity analysis, symptom response was also defined as ≥4-point decrease for BFI total score and ≥10-point decline for CES-D total score at week 4 assessment. In the sensitivity analysis, symptom response was only examined in patients with baseline score of no less than the above-specified cutoff points. The above
Cancer Management and Research downloaded from https://www.dovepress.com/ by 118.70.13.36 on 20-Aug-2020
Dovepress Association of cytokines with fatigue and depression
cutoff points were chosen because we believed those levels of improvement in fatigue and depression could be considered clinically meaningful.
Serum collection and cytokine ELISA
analysis
After activation of the amendment incorporating this cyto-kine correlative study into E4Z02 trial, serum samples were collected from consenting patients at baseline (prior to the initiation of protocol therapy) and week 4 (prior to first treat-ment of the extension phase). The baseline blood draw was done between 6 and 10 am (8 am optimal) before receiving cancer therapy if applicable. The week 4 blood draw was collected at the same time of day as the baseline blood. After the blood was drawn, the blood was centrifuged at ~3,500×
g at 4°C for 10 minutes to separate the serum. The serum was then drawn into a sterile syringe (or a transfer pipette) and then evenly dispensed (aliquot) into labeled cryotubes in 2-mL aliquots. The vials were capped securely and the serum was frozen at −70°C or colder at the local institutions and shipped to the central ECOG Pathology Coordinating
Office repository after collection of both baseline and week 4 evaluation samples.
After all the samples were collated upon completion of the clinical study, the ECOG Pathology Coordinating Office shipped these samples to investigators at the University of Virginia, where all cytokine analyses were conducted. The ten cytokines assayed were IL-1, IL-1β, IL-6, IL-8, IL-1Ra, interferon-γ (IFN-γ), tumor necrosis factor-α (TNF-α), EGF, TGF-α, and vascular endothelial growth factor (VEGF). Cytokines IL-1β, IL-6, and TNF-α were tested via the ELISA kits from DRG International, Inc (Springfield, NJ, USA). TGF-α and EGF were tested using ELISA kit QIA61 from Oncogene Research Products (Cambridge, MA, USA), and VEGF was tested using ELISA kit DVE00 from R&D Diagnostics (Minneapolis, MN, USA).
The cytokine analysis was performed with a Luminex analyzer on first thawed samples using up to 500 µL for duplicate assays. Detection was achieved through a bead-based antibody–antigen sandwich method. Briefly, samples were incubated with color-coded beads that were precoated with analyte-specific capture antibodies for the molecule of Stratify
• Gender (male, female) • Performance status (0,1) • Chemotherapy (yes, no)
Levocarnitine (n=189)
• Before cytokine study activation (n=99) • Consented to cytokine study (n=90)
Placebo (n=187)
• Before cytokine study activation (n=105) • Consented to cytokine study (n=82)
Serum sample at baseline/week 4 (n=47)
Randomization
Serum sample at baseline/week 4 (n=54) Total enrollment for E4Z02 (N=376)
• Before cytokine correlative study activation (N=204)
• After cytokine correlative study activation and consented to cytokine study (N=172)
No blood draw, sample misplaced, sample damaged, sample not processed properly or lost (n=43)
No blood draw, sample misplaced, sample damaged, sample not processed properly or lost (n=28)
Figure 1 CONSORT diagram.
Cancer Management and Research downloaded from https://www.dovepress.com/ by 118.70.13.36 on 20-Aug-2020
Dovepress Rich et al
interest. Expression levels were determined following incuba-tion with a biotinylated detecincuba-tion antibody and streptavidin-conjugated phycoerythrin (PE). Using a Luminex® analyzer, independent lasers determined the color of each bead and the magnitude of the PE-derived signal, which was directly pro-portional to the levels of bound analyte. Samples were given a missing value for cytokines if the levels of cytokines were below the detection level of the kits. Samples with missing values for cytokine levels were excluded from correspond-ing analysis. Hence, the sample size might vary for different cytokines. The average of the duplicates was used for each cytokine in all analyses.
Statistical analysis
The target accrual for the correlative serum study was 160 patients to give an 80% power to detect a 0.5 standard deviation (SD) difference in mean serum levels of any of the cytokines between patients with severe and non-severe symptoms, using Wilcoxon rank sum test with a 0.05 two-sided type I error. Wilcoxon signed-rank test and rank sum test were used to examine the difference between groups for continuous variables. Fisher’s exact test was used to test the association between categorical/binary variables. Multivari-able linear and logistic models and generalized estimating equation (GEE) models were used for regression analysis. No adjustment was made for multiple comparisons in this exploratory analysis. All p values were two-sided and a p value of 0.05 was considered statistically significant. STATA 11.2 (StataCorp., College Station, TX, USA) was used for all analyses.
Results
Patient characteristics
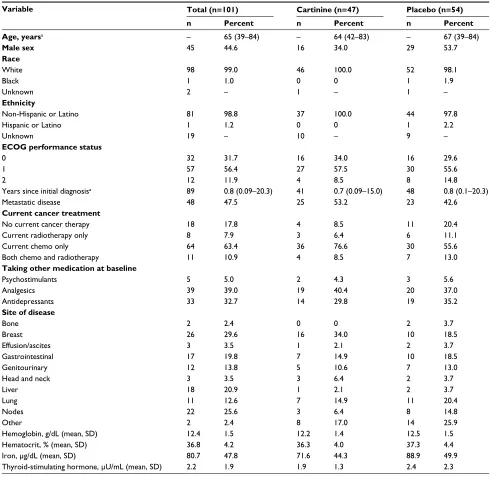
A total of 376 patients were enrolled to E4Z02 between November 2005 and January 2007, and 172 of them were enrolled after the activation of the correlative study in Sep-tember 2006. Serum samples were available for 101 patients at baseline and 4 weeks after initiation of protocol therapy; 47 on levocarnitine, and 54 on placebo. Figure 1 displays the study CONSORT diagram. No significant difference in baseline patient characteristics was found except for dis-proportionately lower overall metastatic disease rate among the 101 patients compared with the remaining 275 patients without cytokine assessment (data not shown). The baseline symptom levels were similar as well (Figure 2A, C). Of the 101 patients with cytokine data, the patient characteristics were well balanced between the levocarnitine and placebo arms except for a lower proportion of males in the
levocar-nitine arm (Table 1). Hence, we analyzed the data regarding the symptoms correlated with cytokines on the collapsed population of 101 patients.
Fatigue and depression at baseline and
week 4 assessments
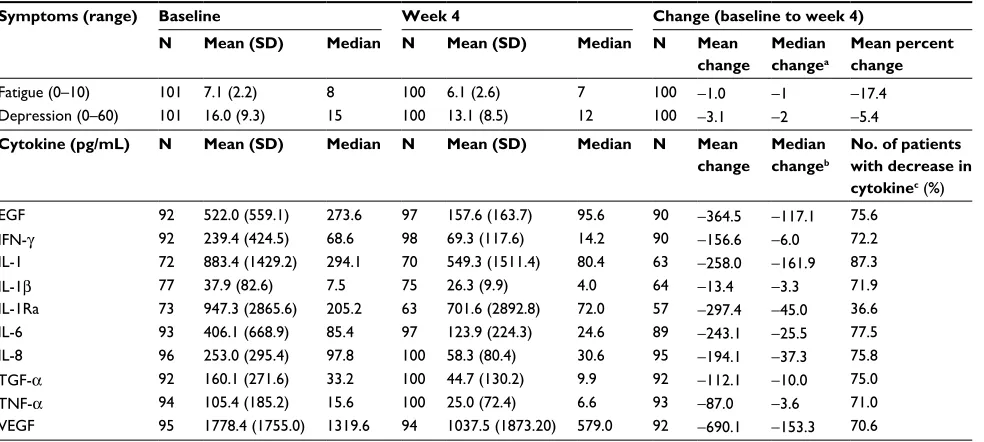
Table 2 shows a significant decrease in fatigue and depres-sion levels between baseline and week 4. Of the 101 patients, 64.4% had severe fatigue at baseline and 54.0% reported severe fatigue at 4-week assessment. The mean percent change of BFI total score was −17.4%, and 16.2% (n=16) of patients had a ≥50% improvement in BFI total scores (fatigue responders). For depression, 44.6% and 36.0% of patients reported severe depression at baseline and week-4 assessments, respectively. The mean percent change of the CES-D total scores was −5.4%, and 24.2% (n=24) of patients had a ≥50% improvement in CES-D total scores (i.e., they were depression responders). As illustrated in Figure 2B, D, symptoms improved significantly for all patients independent of treatment arm.
Cytokines at baseline and week 4
assessments
The mean serum levels for all cytokines are displayed in Table 2. All cytokines were elevated at baseline compared with the normal levels from the literature. Multivariable linear regression analyses show that patients with current radiotherapy had a higher level of IL-1β (p=0.002), IFN-γ
(p=0.026), and TGF-α (p=0.03) at baseline, after adjusting for other covariates. Patients with metastatic disease had a higher level of TNF-α (p=0.047) and IL-8 (p=0.044). Male patients had a higher level of IL-1β (p=0.028) and IL-1Ra (p=0.023; data not shown). Overall, the mean serum levels significantly decreased between baseline and week 4 for all cytokines (p<0.001 for all cytokines, Table 2). The GEE analyses showed that the most significant cytokine decreases over time were on the placebo arm and in patients currently receiving irradiation (data not shown).
Association between cytokines and
symptoms at baseline
There was no statistically significant difference in cytokine levels between symptom groups (severe vs. non-severe fatigue and severe vs. non-severe depression) at baseline based on the Wilcoxon rank sum test (p>0.05 for all cyto-kines, data not shown). However, patients with higher levels of IFN-γ (odds ratio [OR]=1.45, p=0.013), IL-1Ra (OR=1.62,
Cancer Management and Research downloaded from https://www.dovepress.com/ by 118.70.13.36 on 20-Aug-2020
Dovepress Association of cytokines with fatigue and depression
0 2 4 6 8
Mean BFI scores No cytokine data (N=275)
Included in cytokine study (N=101) lb/ub
Baseline Week 4
0 2 4 6 8
Mean BFI scores Carnitine (C)
Placebo (P) lb/ub
Baseline Week 4
0 5 10 15 20 25
Mean CES-D scores No cytokine data (N=275)Included in cytokine study (N=101)
lb/ub
Baseline Week 4
0 5 10 15 20 25
Mean CES-D scores
Carnitine (C) Placebo (P) lb/ub
Baseline Week 4
A B
C D
Figure 2 Mean fatigue and depression levels at baseline and week 4.
Notes: (A) Mean BFI scores for patients included in or excluded from the cytokine study. (B) Mean BFI scores by treatment arm in patients included in the cytokine study. (C) Mean CES-D scores for patients included in or excluded from the cytokine study. (D) Mean CES-D scores by treatment arm in patients included in the cytokine study. lb, Lower bound of 95% confidence interval; ub, upper bound of 95% confidence interval.
Abbreviations: BFI, Brief Fatigue Inventory; CES-D, Center for Epidemiologic Studies Depression Scale.
p=0.022), IL-6 (OR=1.45, p=0.015), IL-8 (OR=1.85, p=0.003), TNF-α (OR=1.79, p=0.004), TGF-α (OR=1.57, p=0.019), and VEGF (OR=1.75, p=0.027) had statistically significantly higher odds of having severe depression at baseline, after adjusting for available confounding variables in the multivariable logistic models (Table 3). Patients with a higher level of IL-1Ra also had increased odds of having severe fatigue at baseline (OR=1.57, p=0.033; Table 3).
Association between cytokine change and
symptom response
Table 4 displays the association between cytokine change and symptom response. Between the week 4 and base-line assessments, both fatigue (p=0.023) and depression (p=0.007) responders had significantly less decrease in IL-1 level compared with the corresponding non-responders. Furthermore, depression responders had significantly less decrease in IFN-γ (p=0.005) and VEGF (p=0.045) levels as well. When symptom response was evaluated by absolute score change, IL-1 was still significantly associated with
symptom response for both fatigue and depression, and IFN-γ and VEGF were no longer statistically significant for depression (data not shown).
Sensitivity analysis for association
between cytokines and symptoms
A sensitivity analysis was conducted where the lowest detec-tion level was imputed for samples with levels of cytokines below that. The results about association between cytokines and symptoms were similar in the subjects where samples were given missing values in the same situation (data not shown).
Discussion
This prospective study of a heterogeneous group of patients with invasive malignancy and moderate-to-severe fatigue shows that all cytokines are elevated at baseline compared with the normal levels reported in other studies.21,22 The very high levels found here may be related to factors known to elevate cytokine levels like stress, chronic illness, irradiation,
Cancer Management and Research downloaded from https://www.dovepress.com/ by 118.70.13.36 on 20-Aug-2020
Dovepress Rich et al
Table 1 Patient demographics and disease characteristics at baseline
Variable Total (n=101) Cartinine (n=47) Placebo (n=54)
n Percent n Percent n Percent
Age, yearsa – 65 (39–84) – 64 (42–83) – 67 (39–84)
Male sex 45 44.6 16 34.0 29 53.7
Race
White 98 99.0 46 100.0 52 98.1
Black 1 1.0 0 0 1 1.9
Unknown 2 – 1 – 1 –
Ethnicity
Non-Hispanic or Latino 81 98.8 37 100.0 44 97.8
Hispanic or Latino 1 1.2 0 0 1 2.2
Unknown 19 – 10 – 9 –
ECOG performance status
0 32 31.7 16 34.0 16 29.6
1 57 56.4 27 57.5 30 55.6
2 12 11.9 4 8.5 8 14.8
Years since initial diagnosisa 89 0.8 (0.09–20.3) 41 0.7 (0.09–15.0) 48 0.8 (0.1–20.3)
Metastatic disease 48 47.5 25 53.2 23 42.6
Current cancer treatment
No current cancer therapy 18 17.8 4 8.5 11 20.4
Current radiotherapy only 8 7.9 3 6.4 6 11.1
Current chemo only 64 63.4 36 76.6 30 55.6
Both chemo and radiotherapy 11 10.9 4 8.5 7 13.0
Taking other medication at baseline
Psychostimulants 5 5.0 2 4.3 3 5.6
Analgesics 39 39.0 19 40.4 20 37.0
Antidepressants 33 32.7 14 29.8 19 35.2
Site of disease
Bone 2 2.4 0 0 2 3.7
Breast 26 29.6 16 34.0 10 18.5
Effusion/ascites 3 3.5 1 2.1 2 3.7
Gastrointestinal 17 19.8 7 14.9 10 18.5
Genitourinary 12 13.8 5 10.6 7 13.0
Head and neck 3 3.5 3 6.4 2 3.7
Liver 18 20.9 1 2.1 2 3.7
Lung 11 12.6 7 14.9 11 20.4
Nodes 22 25.6 3 6.4 8 14.8
Other 2 2.4 8 17.0 14 25.9
Hemoglobin, g/dL (mean, SD) 12.4 1.5 12.2 1.4 12.5 1.5
Hematocrit, % (mean, SD) 36.8 4.2 36.3 4.0 37.3 4.4
Iron, µg/dL (mean, SD) 80.7 47.8 71.6 44.3 88.9 49.9
Thyroid-stimulating hormone, µU/mL (mean, SD) 2.2 1.9 1.9 1.3 2.4 2.3
Note:aData presented as median (range).
Abbreviations: ECOG, Eastern Cooperative Oncology Group, SD, standard deviation.
and infection. Certain patient demographic and disease characteristics were found to be associated with higher levels of cytokines in our study, such as metastatic disease, current radiotherapy, and male sex. Performance status per se is not associated with cytokine levels in our study.
Consistent with our study hypothesis, higher levels of cytokines appear to be associated with a greater symptom burden (Table 3). At the baseline assessment, a multivariable analysis shows that a high level of IL-1Ra is associated with severe fatigue. This observation is consistent with a study of fatigued breast cancer and prostate cancer survivors.23 A
meta-analysis of over 1000 cancer patients also found that the circulating levels of IL-1Ra and IL-6 are associated with fatigue.24 In our multivariable analysis for depression, seven (IL-1Ra, TNF-α, IL-6, IL-8, IFN-γ, TGF-α, and VEGF) of the ten cytokines are significantly associated with severe depression. This observation about IL-6 is consistent with previous studies.6,25
Cancer-related fatigue is extensively studied because it is prevalent and associated with significant morbidity, functional impairment, and loss of quality of life.26 Several studies have been conducted to examine whether targeted
Cancer Management and Research downloaded from https://www.dovepress.com/ by 118.70.13.36 on 20-Aug-2020
Dovepress Association of cytokines with fatigue and depression
Table 2 Symptoms and cytokine levels at baseline and 4-week assessments
Symptoms (range) Baseline Week 4 Change (baseline to week 4) N Mean (SD) Median N Mean (SD) Median N Mean
change
Median changea
Mean percent change
Fatigue (0–10) 101 7.1 (2.2) 8 100 6.1 (2.6) 7 100 −1.0 −1 −17.4
Depression (0–60) 101 16.0 (9.3) 15 100 13.1 (8.5) 12 100 −3.1 −2 −5.4
Cytokine (pg/mL) N Mean (SD) Median N Mean (SD) Median N Mean change
Median changeb
No. of patients with decrease in cytokinec (%)
EGF 92 522.0 (559.1) 273.6 97 157.6 (163.7) 95.6 90 −364.5 −117.1 75.6
IFN-γ 92 239.4 (424.5) 68.6 98 69.3 (117.6) 14.2 90 −156.6 −6.0 72.2
IL-1 72 883.4 (1429.2) 294.1 70 549.3 (1511.4) 80.4 63 −258.0 −161.9 87.3
IL-1β 77 37.9 (82.6) 7.5 75 26.3 (9.9) 4.0 64 −13.4 −3.3 71.9
IL-1Ra 73 947.3 (2865.6) 205.2 63 701.6 (2892.8) 72.0 57 −297.4 −45.0 36.6
IL-6 93 406.1 (668.9) 85.4 97 123.9 (224.3) 24.6 89 −243.1 −25.5 77.5
IL-8 96 253.0 (295.4) 97.8 100 58.3 (80.4) 30.6 95 −194.1 −37.3 75.8
TGF-α 92 160.1 (271.6) 33.2 100 44.7 (130.2) 9.9 92 −112.1 −10.0 75.0
TNF-α 94 105.4 (185.2) 15.6 100 25.0 (72.4) 6.6 93 −87.0 −3.6 71.0
VEGF 95 1778.4 (1755.0) 1319.6 94 1037.5 (1873.20) 579.0 92 −690.1 −153.3 70.6
Notes: aBoth fatigue and depression severity declined significantly at week 4, p<0.01 using Wilcoxon signed-rank test. bAll cytokines had statistically significant decrease
from baseline to week 4, p<0.01 using Wilcoxon signed-rank test. cNumber of patients with decrease in cytokine was defined as 100×(number of patients with any amount of
decrease in levels of cytokine divided by all patients with cytokine data at both visits). The percentage was lowest for IL-1Ra (p<0.001 comparing IL-1Ra with other cytokines using Fisher’s exact test).
Abbreviations: EGF, epidermal growth factor; IFN-γ, interferon-γ; IL, interleukin; SD, standard deviation; TGF-α, transforming growth factor-α; TNF-α, tumor necrosis
factor-α; VEGF, vascular endothelial growth factor.
Table 3 Multivariable logistic regression analysis for association between cytokine and symptoms at baselinea
Cytokine (natural logarithm transformed) as independent variable
No. of patients
Dependent variable = severe depression
Dependent variable = severe fatigue
Adjusted OR (95% CI) p-Value Adjusted OR (95% CI) p-Value
EGF 79 1.57 (0.93, 2.65) 0.09 1.17 (0.73, 1.85) 0.51
IFN-γ 80 1.45 (1.08, 1.94) 0.013 1.16 (0.90, 1.48) 0.25
IL-1 63 0.98 (0.60, 1.60) 0.93 0.71 (0.43, 1.17) 0.18
IL-1β 68 1.35 (0.92, 1.99) 0.13 0.88 (0.63, 1.24) 0.47
IL-1Ra 63 1.62 (1.07, 2.45) 0.022 1.57 (1.04, 2.36) 0.033
IL-6 80 1.45 (1.07, 1.96) 0.015 1.02 (0.79, 1.32) 0.87
IL-8 83 1.85 (1.23, 2.79) 0.003 0.98 (0.72, 1.32) 0.88
TGF-α 79 1.57 (1.08, 2.28) 0.019 1.09 (0.80, 1.50) 0.58
TNF-α 81 1.79 (1.21, 2.66) 0.004 1.02 (0.75, 1.40) 0.90
VEGF 82 1.75 (1.07, 2.86) 0.027 1.20 (0.79, 1.82) 0.39
Notes: aA multivariable logistic regression model was fit for each symptom to estimate the adjusted OR for each cytokine. In these models, the same set of adjusting
covariates was included for all cytokines.
Abbreviations: CI, confidence interval; EGF, epidermal growth factor; IFN-γ, interferon-γ; IL, interleukin; OR, odds ratio; TGF-α, transforming growth factor-α; TNF-α,
tumor necrosis factor-α; VEGF, vascular endothelial growth factor.
interventions based on molecular mechanisms could help alleviate fatigue. For example, a study of the prospective use of dexamethasone for fatigue in advanced cancer patients showed modest benefit at 2 weeks.27 Another recent trial using the anti-IL-6 antibody ALD 518 has shown some promising results and indicates that the IL-6 pathway disruption may be a promising avenue to pursue.28 The multidimensional causes of cancer fatigue production, in particular, the possible rela-tionship with disruption of the biologic timing mechanism by
ligands of the EGFR family, is another potential therapeutic intervention. Supporting this notion are the results with the tyrosine kinase inhibitor, gefitinib, that showed early reversal of multiple symptoms that are hard to explain solely on the basis of tumor response.29 Furthermore, in a small pilot trial, we found that the use of the tyrosine kinase inhibitor did reverse objective measurements of the circadian system with normalization of wrist actigraphy measurements, indicating fatigue in a cohort of patients with metastatic non-small cell
Cancer Management and Research downloaded from https://www.dovepress.com/ by 118.70.13.36 on 20-Aug-2020
Dovepress Rich et al
Table 4 Association between percent change (%) of cytokine and symptom response
Cytokine Non-response Response p–Value
(Wilcoxon rank sum)
N Median of % change
Mean of % change
N Median of % change
Mean of % change Fatigue
EGF 73 −59.2 −26.7 15 −70.4 −43.0 0.85
IFN-γ 75 −48.6 −9.5 13 −40.0 18.5 0.39
IL-1 54 −72.3 −28.1 8 −9.8 91.9 0.023
IL-1β 53 −54.8 180.1 11 −29.3 34.5 0.64
IL-1Ra 44 −43.7 67.0 12 −35.0 79.0 0.68
IL-6 73 −53.0 −14.7 14 −67.2 9.7 0.54
IL-8 79 −53.5 36.1 14 −47.3 5.4 0.53
TGF-α 75 −60.2 −28.4 15 −60.5 −20.2 0.97
TNF-α 77 −44.8 −10.6 14 −29.4 −23.3 0.82
VEGF 75 −30.7 −0.2 15 −16.3 −20.0 0.68
Depression
EGF 68 −61.8 −27.2 20 −58.1 −41.0 0.75
IFN-γ 70 −59.4 −24.1 18 22.9 66.7 0.005
IL-1 47 −74.7 −13.6 15 −17.9 −10.7 0.007
IL-1β 44 −69.2 212.5 19 −27.0 28.8 0.08
IL-1Ra 38 −44.9 68.4 17 −21.1 76.0 0.56
IL-6 65 −59.1 −14.9 22 −55.9 −2.0 0.67
IL-8 71 −59.6 40.4 22 −39.8 0.2 0.38
TGF-α 69 −60.2 −26.0 21 −62.3 −34.5 0.94
TNF-α 69 −45.7 −18.4 22 −35.2 4.0 0.55
VEGF 69 −38.3 −8.2 21 1.1 9.5 0.045
Abbreviations: EGF, epidermal growth factor; IFN-γ, interferon-γ; IL, interleukin; TGF-α, transforming growth factor-α; TNF-α, tumor necrosis factor-α; VEGF, vascular
endothelial growth factor.
lung cancer.30 Future studies with anti-EGFR agents should explore the potential for improvement of symptoms as well as antitumor activity in the quest for better understanding of the interventional potential of this class of agents.
In the parent E4Z02 trial16 and in our correlative cytokine study reported here, and in a separately published random-ized fatigue intervention trial,31 improvement in symptoms occurred independent of the therapeutic intervention and rep-resents a placebo effect. We show here that fatigue improve-ment is associated with a decline of the IL-1/IL-1Ra pathway in this population that experience the placebo effect (Table 2), thus contributing to the understanding of fatigue within the emerging knowledge of the importance of neural-chemical pathways in producing placebo effects per se.32 Although the precise neurochemical mechanism is unknown, the observed placebo effects can be important confounding factors in clinical symptom research. One approach to account for this would be to assess patient’s expectations, a dimension that has been shown to influence treatment intervention in stud-ies concerning pain and inflammation.33 Another way could examine the actual language used by health workers (e.g., certified research assistants and doctors) enrolling patients onto clinical trials that could provide an elevated sense of
anticipation that has been shown to influence outcomes positively or negatively (placebo or nocebo, respectively).32
There are some important limitations for this correlative study. First, only one follow-up was made, at week 4. Multiple evaluations of the cytokine levels at specific times as well as follow-up extended beyond 1 month might be important, given the known circadian variation in these cytokine levels as well as changing trajectory of fatigue over time. Second, various additional variables were not collected (e.g., duration of fatigue before study entry, body mass index, menopausal status of female subjects, sleep problems, concomitant use of sleep aid, nutrition and oxygen status, the type and the tim-ing of chemotherapeutic agents used, hormone therapy, and immunotherapy). Some of these additional variables might mediate the association between cytokines and fatigue. Third, some details about the blood draw (e.g., whether it is collected before taking the study drug intervention) are not explicitly specified in the protocol, which might have an impact on the study results. Fourth, we did not adjust these exploratory analyses for multiple comparisons. Finally, the analyses are underpowered due to the small sample size. Overall, these correlative study data should be considered as exploratory and hypothesis generating.
Cancer Management and Research downloaded from https://www.dovepress.com/ by 118.70.13.36 on 20-Aug-2020
Dovepress Association of cytokines with fatigue and depression
In summary, this correlative study of a placebo-controlled trial involving a drug intervention to treat fatigue indicates that there are elevations in proinflammatory cytokines (IL-1 and IL-1Ra) and ligands of the EGFR family that are correlated with fatigue and depression in cancer patients. Correlative studies are an important component of placebo-controlled symptom interventions, providing biological insights and leads that enhance the value proposition of this research even when the investigational treatments lack efficacy.
Acknowledgments
The authors wish to acknowledge the work of Dr. Mehmet Koc and the laboratory facilities of Dr. Jeffery Lisiak at the University of Virginia for the cytokine assays.
This study was conducted by the Eastern Cooperative Oncology Group and supported in part by Public Health Service Grants CA23318, CA66636, CA21115, CA49957, CA39229, and CA104362 from the National Cancer Institute, National Institutes of Health, and the Department of Health and Human Services. Its contents are solely the responsibility of the authors and do not necessarily represent the official views of the National Cancer Institute.
These data were previously presented at the Annual Meet-ing of the American Society of Clinical Oncology in 2011.
Disclosure
The authors report no conflicts of interest in this work.
References
1. Barsevick A, Frost M, Zwinderman A, Hall P, Halyard M. I’m so tired: biological and genetic mechanisms of cancer-related fatigue. Qual Life
Res. 2010;19(10):1419–1427.
2. Hart BL. Biological basis of the behavior of sick animals. Neurosci
Biobehav Rev. 1988;12(2):123–137.
3. Cleeland CS, Bennett GJ, Dantzer R, et al. Are the symptoms of cancer and cancer treatment due to a shared biologic mechanism? Cancer. 2003;97(11):2919–2925.
4. Bower JE, Ganz PA, Aziz N, Fahey JL. Fatigue and proinflamma-tory cytokine activity in breast cancer survivors. Psychosom Med. 2002;64(4):604–611.
5. Myers JS. Proinflammatory cytokines and sickness behavior: implica-tions for depression and cancer-related symptoms. Oncol Nurs Forum. 2008;35(5):802–807.
6. Musselman DL, Miller AH, Porter MR, et al. Higher than nor-mal plasma interleukin-6 concentrations in cancer patients with depression: preliminary findings. Am J Psychiatry. 2001;158(8): 1252–1257.
7. Rich T, Innominato PF, Boerner J, et al. Elevated serum cytokines cor-related with altered behavior, serum cortisol rhythm, and dampened 24-hour rest-activity patterns in patients with metastatic colorectal cancer. Clin Cancer Res. 2005;11(5):1757–1764.
8. Kurzrock R. The role of cytokines in cancer-related fatigue. Cancer. 2001;92(Suppl 6):1684–1688.
9. Greenberg DG, Gray JL, Mannix CM, Eisentha lS, Carey M. Treatment-related fatigue and serum interleukin-1 levels in patients during external beam irradiation for prostate cancer. J Pain Symptom
Manage. 1993;8(4):196–200.
10. Capuron L, Ravaud A, Dantzer R. Early depressive symptoms in cancer patients receiving interleukin-2 and /or interferon alfa-2b therapy. J Clin
Oncol. 2000;18(10):2143–2151.
11. Dantzer R, O’Connor JC, Freund GG, Johnson RW, Kelley KW. From inflammation to sickness and depression: when the immune system subjugates the brain. Nat Rev Neurosci. 2008;9(1):46–56.
12. Kramer A, Yang FC, Snodgrass P, Li X, Scammell TE, Davis FC, Weitz CJ. Regulation of daily locomotor activity and sleep by hypotha-lamic EGF receptor signaling. Science. 2001;294(5551):2511–2515. 13. Rich TA. Symptom clusters in cancer patients and their relation to
EGFR ligand modulation of the circadian axis. J Support Oncol. 2007;5(4):167–174; discussion 76–77.
14. Snodgrass-Belt P, Gilbert JL, Davis FC. Central administration of transforming growth factor-alpha and neuregulin-1 suppress active behaviors and cause weight loss in hamsters. Brain Res. 2005;1038(2): 171–182.
15. Gilbert J, Davis FC. Behavioral effects of systemic transforming growth factor-alpha in Syrian hamsters. Behav Brain Res. 2009;198(2): 440–448.
16. Cruciani RA, Zhang JJ, Manola J, Cella D, Ansari B, Fisch MJ. L-carnitine supplementation for the management of fatigue in patients with cancer: an eastern cooperative oncology group phase III, randomized, double-blind, placebo-controlled trial. J Clin Oncol. 2012;30(31):3864–3869.
17. Mendoza TR, Wang XS, Cleeland CS, Morrissey M, Johnson BA, Wendt JK, Huber SL. The rapid assessment of fatigue severity in can-cer patients: use of the Brief Fatigue Inventory. Cancan-cer. 1999;85(5): 1186–1196.
18. Radloff L. CES-D Scale: a self-report depression scale for research in the general population. Appl Psychol Measur. 1977;1:385–401. 19. Hann D, Winter K, Jacobsen P. Measurement of depressive
symp-toms in cancer patients. evaluation of the Center for Epidemiological Studies Depression Scale (CES-D). J Psychosom Res. 1999;46(5): 437–443.
20. Miaskowski C, Dodd M, West C, Paul SM, Schumacher K, Tripathy D, Koo P. The use of a responder analysis to identify differences in patient outcomes following a self-care intervention to improve cancer pain management. Pain. 2007;129(1–2):55–63.
21. Kleiner G, Marcuzzi A, Zanin V, Monasta L, Zauli G. Cytokine levels in the serum of healthy subjects. Mediators Inflamm. 2013;2013:1–6. 22. Kim HO, Kim HS, Youn JC, Shin EC, Park S. Serum cytokine profiles
in healthy young and elderly population assessed using multiplexed bead-based immunoassays. J Transl Med. 2011;9:113.
23. Bower JE, Ganz PA, Tao ML, et al. Inflammatory biomarkers and fatigue during radiation therapy for breast and prostate cancer. Clin Cancer Res. 2009;15(17):5534–5540.
24. Schubert C, Hong S, Natarajan L, Mills PJ, Dimsdale JE. The asso-ciation between fatigue and inflammatory marker levels in cancer patients: a quantitative review. Brain Behav Immun. 2007;21(4): 413–427.
25. Jehn CF, Kuehnhardt D, Bartholomae A, et al. Biomarkers of depression in cancer patients. Cancer. 2006;107(11):2723–2729.
26. Barsevick A, Cella D. NCI Symptom Management and Quality of Life
Steering Committee Clinical Trials Planning Conference: Cancer-Related Fatigue. Bethesda, MD: National Institutes of Health; 2010.
27. Yennurajalingam S, Frisbee-Hume S, Palmer JL, et al. Reduction of cancer-related fatigue with dexamethasone: a double-blind, randomized, placebo-controlled trial in patients with advanced cancer. J Clin Oncol. 2013;31(25):3076–3082.
28. Bayliss TJ, Smith JT, Schuster M, Dragnev KH, Rigas JR. A humanized anti-IL-6 antibody (ALD518) in non-small cell lung cancer. Expert Opin
Biol Ther. 2011;11(12):1663–1668.
Cancer Management and Research downloaded from https://www.dovepress.com/ by 118.70.13.36 on 20-Aug-2020
Dovepress
Cancer Management and Research
Publish your work in this journal
Submit your manuscript here: https://www.dovepress.com/cancer-management-and-research-journal Cancer Management and Research is an international, peer-reviewed open access journal focusing on cancer research and the optimal use of preventative and integrated treatment interventions to achieve improved outcomes, enhanced survival and quality of life for the cancer patient. The manuscript management system is completely online and includes
a very quick and fair peer-review system, which is all easy to use. Visit http://www.dovepress.com/testimonials.php to read real quotes from published authors.
Dove
press
Rich et al
29. Cella D, Herbst RS, Lynch TJ, et al. Clinically meaningful improve-ment in symptoms and quality of life for patients with non-small-cell lung cancer receiving gefitinib in a randomized controlled trial. J Clin
Oncol. 2005;23(13):2946–2954.
30. Iurisci I, Rich T, Levi F, et al. Relief of symptoms after gefitinib is associated with improvement of rest/activity rhythm in advanced lung cancer. J Clin Oncol. 2007;25(16):e17–e19.
31. Spathis AS, Fife K, Blackhall F, et al. Modafinil for the treatment of fatigue in lung cancer: results of a placebo-controlled, double-blind, randomized trial. J Clinl Oncol. 2014;32(18):1882–1888.
32. Benedetti F, Amanzio M. Mechanisms of the placebo response. Pulm
Pharmacol Ther. 2013;26(5):520–523.
33. Finniss DG, Kaptchuk TJ, Miller F, Benedetti F. Biological, clinical, and ethical advances of placebo effects. Lancet. 2010;375(9715):686–695.
Cancer Management and Research downloaded from https://www.dovepress.com/ by 118.70.13.36 on 20-Aug-2020