Missing Value Imputation using Mean Substitution based on radial
distance function
Gisele Giramata1, Dr. Cheruiyot W. Kipruto2, Dr. Marcel Ndengo3
School Of Computer Science and Information Technology, Jomo Kenyatta University of Agriculture and Technology
Abstract
The success of Machine learning and correlated areas such data
mining, data analysis and data science in general rely on the
purity of the dataset. Before performing the data mining, the data
has to be cleaned. An unprocessed dataset may contain noisy or
missing values which is a critical research issue in the
pre-processing stage. Imputation methods are being used to solve the
missing value problems. In this proposed work, a machine
learning based imputation method is proposed by using mean
substitution of nearest neighbor data points. For designing the
proposed model, a radial basis function has been used. The
performance of the proposed algorithm has been measured with
respect to different rate or percentage of missing values in the
dataset and the results has been compared with data points of
complete data. To evaluate the performance, different datasets
have been used. The proposed algorithm performs well and was
able to impute the missing values even in the worst cases with
entire attribute and instance of missing values. To evaluate the
proposed algorithm, four metrics have been used to each to
evaluate the imputed data accuracy and the algorithm
performance. In this study, the quality is measured in terms
imputation Accuracy and the classification accuracy. The results
demonstrated the efficiency and effectiveness of the proposed
algorithm.
Keywords: Data mining, imputation method, missing value, dataset
1.
Introduction
The success of Machine learning and correlated areas such
data mining, data analysis and data science in general rely
on the purity of the dataset. The quality of data quality is a
major concern in machine learning. As most machine
learning algorithms induce knowledge strictly from data,
the quality of the knowledge extracted is determined by
the quality of the underlying data. Before performing the
data mining, the data has to be cleaned.
Data cleaning processes apply routines that can handle
incomplete, noisy and inconsistent data. A missing value
is defined as an attribute or feature in a dataset which has
no associated data value. Handling missing values is
considered to be a crucial factor in overall data quality, as
they have a negative impact on the interpretation and
result of data mining processes. Incomplete data is an
unavoidable problem in dealing with most of the real
world data sources. The topic has been discussed and
analyzed by researchers Zhang et al. (2004) and Kotsiantis
et al. (2006) in the field of machine learning.
Generally, there are some important factors to be taken
into account when processing unknown feature values.
The most important one of them is the source
of ’unknowingness’ [9]. Today real world datasets
contains missing data due to human, operational error,
hardware malfunctioning and many other factors.
According to Somasundaram et al. (2013) Missing values
can occur in datasets in different forms. They can be
classified into three categories and a clear knowledge on
which category the missing values lies is a clear step
towards a positive solution:
• Missing values occur in several attributes (columns)
• Missing values occur in a number of instances (rows)
• Missing values occur randomly in attributes and instances
As methods used for each of these categories differ,
therefore selection of correct algorithm is significant.
Normally, missing rates less than one per cent are
considered trivial, 1-5% are considered to be manageable.
But databases with 5-15% missing data values rate needs
sophisticated methods to handle them correctly and more
than 15% requires careful handling as they affect
interpretation. It is in the last category most of the
solutions have been proposed and it is understood that
several alternative ways of dealing with missing data
exists. This topic has been discussed by.
Efficient treatment of missing values requires a complete
understanding behind it, some fundamental aspects of
incomplete or missing values will be discussed in 1.1
section.
Over years ago, there are many researches going on in the
area of machine learning as well as data mining especially
in the missing data. Various methods for dealing with such
issues have been developed. K-Nearest neighbor
imputation (KNN) technique is one of technique
developed to handle missing values that has great
advantages of imputing both discrete and continuous
values and also being robust to handle multiple missing
data as discussed and analyzed by Liu Peng, lie lei, in their
paper “A Review of Missing Data Treatment Methods”.
KNN imputation method imputes missing value using
values calculated from the k nearest neighbors. The
nearest, most similar, neighbors are found by minimizing a
distance function, usually the Euclidean distance, and as
Imputation is all about the procedure to replace the
missing data by considering the relationships present in
the observations [6].
Minakshi al., in his paper “Missing Value Imputation in
Multi Attribute Dataset”, to impute missing data he used
three techniques, that are wise deletion, mean imputation,
KNN imputation. After applying these techniques he had
three imputed dataset. On these imputed dataset he applied
classification algorithm c4.5/j48. His work analyzed the
performance of imputation methods using C4.5 classifier
on the basis of accuracy for handling missing value. After
that decide which imputation method is best to handle
missing value. On the basis of experimental results
accuracy KNN performed better than the other two
techniques. Therefore, KNN imputation was a better way
of handling missing value according to Minakshi.
However KNN imputation has limitations in handling
missing values when entire instance or attribute contain
missing values in the distance function because KNN
performs imputation based on a linear distance function.
Therefore most similar neighbors are define through
vector hence mean or median calculation that are
performed base on vector. Which means at some points
KNN fails to impute missing values due to its linear
function and ignore one dimension while imputing values
in a matrix or dimensional dataset.
The goal of this paper is to propose an enhanced
imputation algorithm that provides a non-linear imputation
and evaluate the accuracy of its imputed values. This
include:
(i) Design Radial Imputation algorithm.
(ii) Perform experiment on imputation using RImpute.
(iii)Evaluate the performance of proposed RImpute by computing Mean, Standard deviation,
MRSE and correlation index of imputed values in comparison with complete dataset.
1.1.Types of Missing Values
Little and Rubin (2002) define a list of missing
mechanisms, which are widely accepted by the community.
• Missing Completely at Random (MCAR): The term
“Missing Completely at Random” refers to data where
the missingness mechanism does not depend on the
variable of interest. Here the data are collected and
observed arbitrarily and the collected data does not
depend on any other variable of the dataset.
• Missing at Random (MAR): It termed as “Missing at
Random”. We can consider an entry Xi as missing at
random if the data meets the requirement that
missingness should not depend on the value of Xi
after controlling for another variable.
Not missing at Random (NAMR): If the data is not
missing at random or informatively missing then it is
termed as “Not missing at Random”. Such a situation
occurs when the missingness mechanism depends on the
actual value of missing data. Modeling such a condition is
a very difficult task to achieve. This means we need to
write a model for missing data and then integrate it into a
more complex model for estimating missing data.
2.
Proposed RImpute algorithm
2.1.RImpute concept
The proposed RImpute algorithm impute missing values
based on a radial distance function. When a missing value
is found and the radius distance is defined, the imputation
area is calculate in order to scan nearest values of the
missing values based on radius distance, then nearest
points or values are defined in the Imputation area which
are not null and then the mean is computed from not null
values found in the Imputation area and the computed
mean therefore substitute the missing value. The RImpute
have been designed for continuous data with related data
for two dimension.
Let us assume D as a dataset of m records in which, each
record contains n attributes. Hence, there will be m x n
values in that dataset D and having values V(x, y). If the
dataset D contains some missing attribute values, then,
inside that dataset, it may be represented by a null string
(but in our abstract case missing values are colored V).
Instanc e features
Y1 Y2 Y3 Y4 Y5 … Yn
X1 V11 V21 V31 V41 V51 … Vn1
X2 V12 V22 V32 V42 V52 … Vn2
X3 V13 V23 V33 V43 V53 … Vn3
X4 V14 V24 V34 V44 V54 … Vn4
… … … … … … … …
Xm V1m V2m V3m V4m V5m … Vnm Table1: RImpute concept
Assuming the radius distance r=1, the imputation area (AI)
is defined by AI=2*r+1, considering the missing value
v(x,y) as the center, as illustrated by these circle in the
dataset D. Therefore points or values inside the circle or
not greater that imputation area will be considered as
closest values of the missing value v(x, y). Nearest values are defined by (p-x)2+(q-y)2≤r2 where p is coordinate of nearest v in x direction and q is coordinate of nearest v in
y direction. After nearest values are found mean is
computed based on nearest values found.
Considering missing values V22 and V53, they will be
impute as follow:
• For V22 nearest values are V12, V21, V32 and V23
assuming none of these is null, therefore
V22=
• For V53 nearest values are V43, V52, V63 and V54
assuming V63 is null, therefore
V53=
The iteration will continue till all missing values are
substituted, hence a complete data Dmxn will be returned.
2.2. RImpute algorithm
RImpute algorithm function:
Function radial Imputation (Imxn, Omxn, Rmax) /* Inputs
I is the input dataset with missing values with size mxn
O is the output dataset with imputed missing values with
size mxn
Rmax is the maximum radius for imputing missing values
*/
/* Inputs validation */
If Rmax<1 //radius distance can't be less than 1
Then break
End if
If (m<=Rmax*2+1 || n<=Rmax*2+1) //where m is number
of rows and n is number of column
Then break
End if
/* Missing values imputation */
For each value v(x, y) in Imxn //where v(x, y) is a value in
Imxn dataset
If v is not missing Then O[x][y] ← v
Else
For each radius r from 1 to Rmax do
IA= 2r+1; //where AI is Imputation Area
//where λ is the number of none missing values found in the Imputation Area, p is the starting point of scanning in x direction, q is starting point of scanning in y direction , r is radius, x
and y are coordinates of center point which is the missing value
O[x][y] ← v End for
End if
End for
Return Omxn
3.
Experimental design and performance
evaluation
3.1.Experimental design
In this study, two datasets named NASDAQ Dividend and
Yale index that contained no missing values means
complete datasets were downloaded from [8] and [11]
respectively, in NASDAQ Dividend only data of Dividend
Market value attribute was considered. They were
deliberately chosen to help validate the accuracy of
RImpute. Randomly simulated missing values were then
inserted to each dataset, and the missing rates were fixed
at 10%, 20% and 30% having entire attribute and entire
instance with missing values, missing values were
simulated at different points to each percentage rate
simulation. Missing rate is the total number of missing
values over the total number of values in a dataset. Next,
each dataset is imputed independently using different
radius distance. Later Imputed dataset are compared with
original datasets.
3.2. Performance evaluation
3.2.1. Evaluation on Classification Accuracy
To evaluate the accuracy of imputed data we used three
metrics: mean, standard deviation and correlation index.
The first comparison was made between mean and
standard deviation of complete datasets and imputed
datasets and the second was computing correlation of
complete datasets and imputed datasets.
Mean is used to measure accuracy of imputed data,
accuracy is how close a measured value is to the actual
value. The standard deviation measures the Precision of
datasets, precision is how close the measured values are to
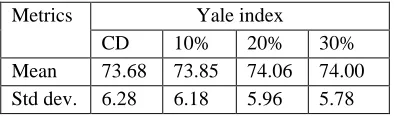
each other [2]. The mean and standard deviations of
complete datasets (CD) and imputed datasets with
percentage of missing values are shown in Table2 and 3.
Metrics NASDAQ Dividend
CD 10% 20% 30%
Mean 27.11 27.13 27.08 27.42
Std dev. 3.80 3.73 3.71 3.38
Table 2: Mean and standard deviation for NASDAQ Dividend dataset
Metrics Yale index
CD 10% 20% 30%
Mean 73.68 73.85 74.06 74.00
Std dev. 6.28 6.18 5.96 5.78
Table 3: Mean and standard deviation for Yale index dataset
The discrepancies between the values give an indication to
the degree of variance between these datasets. Observing
the mean and standard deviation of complete datasets and
imputed datasets, it can be seen that the imputed data fall
into a narrower with a slight variance from the complete
datasets. The results show that they are not equal but fall
in the same range for both datasets. The mean
v
ariationfor both datasets varies from 0.02 to 0,3 and the standard
deviation variability is between 0.07 and 0.5; meaning the
imputed values for both dataset NASDAQ Dividend and
Yale index are in the same distribution with the complete
datasets.
Correlation index was used to measure accuracy of impute
datasets. The correlation coefficient gives an index of the
strength of the relationship between two variables [1]. It is
a value ranging from -1 to 1 with 0 being completely
unrelated.
Missing values %
NASDAQ Dividend
Yale index
10% 0.9974 0.97
20% 0.9932 0.93
30% 0.9665 0.94
Table 4: Correlation Index of NASDAQ Dividend and Yale index datasets
The correlation of imputed datasets are shown in table
4.The correlation index for NASDAQ Dividend and Yale
datasets vary from 0.93 up to 0.99 which is almost +1.
This means that the data points from the complete datasets
and imputed datasets are highly correlated. A correlation
coefficient of +1 indicates a perfect positive correlation.
As variable of real data increases, variable imputed data
increases. As variable real data decreases, variable
imputed data decreases.
3.2.2. Evaluation on I mputation Accuracy
To evaluate the performance of an imputation method that
imputes actual missing values in a dataset, Root Mean
Squared Error (RMSE) approach is required.
The accuracy of imputation method was compared by
computing a statistic, quantifying the deviation between
the imputed and the true or complete datasets for
imputation method. These were done using RMSE as
recommended by [10] for datasets with continuous
variables. The imputation method achieving the smallest
RMSE gives the most correct picture of the complete data
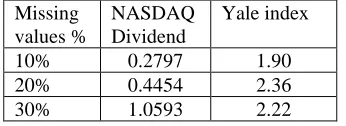
when estimated values were included. The RMSE of
NASDAQ Dividend and Yale index are shown in table 5.
Missing values %
NASDAQ Dividend
Yale index
10% 0.2797 1.90
20% 0.4454 2.36
30% 1.0593 2.22
Table 5: RMSE of NASDAQ Dividend and Yale index datasets
The MSRE found for both datasets vary from 0.2 up to 2.3
which is a good range for a prediction accuracy. The more
the RMSE is, the less is the prediction accuracy, from
computed MSRE this means that the imputation method
having a lower RMSE has a high accuracy.
4.
Conclusion
Our aim in this present work was to propose an algorithm
that can impute missing values in dataset based on a
nonlinear distance function and also an algorithm that can
impute a dataset having an entire attribute or instance of
missing values. The presented algorithm RImpute imputes
missing values based on radial distance function which
gives it capability to impute dataset with entire attribute or
instance with missing values.
The proposed RImpute imputation method has been
successfully implemented and evaluated. The performance
of the missing value imputation algorithms were measured
with respect to different percentage of missing values in
the datasets.
The performance of the algorithms was evaluated with
four different metrics in terms of imputation accuracy and
the classification accuracy. In all the metrics, proposed
algorithms performed well. It is proved that the proposed
RImpute imputation method provided efficient
performance in missing value imputation using mean
substitution.
5.
References
1. Clarke, G.M., Cooke, D. (2005) A Basic Course
in Statistics. 5th Edition, A Hodder Arnold
Publication, ISBN: 0340814063
2. Darren, B., Tshilidzi, M. (2008). Comparison of
Data Imputation Techniques and their Impact.
[unpublished paper] School of Electrical &
Information Engineering, University of the
Witwatersrand, South Africa.
3. Kotsiantis, S.B., Kanellopoulos D. Pintelas, and
P. E. (2006). Data preprocessing for supervised
leaning. International Journal of Computer
Science, 1 (2), 111-117.
4. Little, R.J.A., Rubin D.B., (2002). Statistical
Analysis with Missing Data. 2nd Edition, Wiley,
New York, ISBN-10: 0471183865, pp: 381.
5. Liu Peng, L. L. (n.d.). A Review of Missing Data
Treatment Methods.
6. Malarvizhi, R., Antony, S. T. (2012). K-Nearest
Neighbor in Missing Data Imputation.
International Journal of Engineering Research
and Development. 5(1), 5-7.
7. Minakshi, D. R. (2014). Missing Value
Imputation in Multi Attribute Dataset. (IJCSIT)
International Journal of Computer Science and
Information Technologies, 5(4), 5315-5321.
8. NASDAQ Dividend Income Index Family.
Retrieved from
https://www.quandl.com/data/NASDAQOMX/DI
VQ-NASDAQ-Dividend-Achievers-DIVQ
9. Somasundaram, R.S., Nedunchezhian, R. (2013).
Radial basis function network dependent
exclusive mutual interpolation for missing value
imputation. Journal of Computer Science, 9 (3),
327-334. DOI:10.3844/jcssp.2013.327.334.
10. Stekhoven, D. J., Bhlmann, P. (2012).
Missforest-Non-parametric missing value
imputation for mixed-type data. Bioinformatics,
28 (1), 112–118.
11. Stock Market Confidence Indices - United States
Valuation Index Data – Institutional. Retrieved
from
https://www.quandl.com/data/YALE/US_CONF_
INDEX_VAL_INST-Stock-Market-Confidence-
Indices-United-States-Valuation-Index-Data-Institutional
12. Zhang, S., C. Zhang and Q. Yang, (2004). Guest
editors’introduction-Information enhancement for
data mining. IEEE Intelligent Systems, 19(2),
12-13. DOI: 10.1109/MIS.2004.1274905