Cancer Management and Research
Dove
press
O R i g i n a l R e s e a R C h
open access to scientific and medical research
Open Access Full Text Article
impact of tumor dimensions and lymph
node density on the survival of patients with
hypopharyngeal squamous cell carcinoma
lu-lu Ye1,2,*
Jia Rao2,3,*
Xing-Wen Fan1,2
Qing-hai Ji2,4
Chao-su hu1,2
hong-Mei Ying1,2
1Department of Radiation Oncology,
Fudan University shanghai Cancer Center, shanghai 200032, P.R. China; 2Department of Oncology,
shanghai Medical College, Fudan University, shanghai 200032, P.R. China; 3Department of Pathology, 4Department of head and neck
surgery, Fudan University shanghai Cancer Center, shanghai 200032, P.R. China
*These authors contributed equally to this work
Purpose: To analyze the potential variables affecting the survival of patients undergoing primary
surgery for hypopharyngeal squamous cell carcinoma.
Patients and methods: Between August 2007 and December 2016, 93 patients with primary
hypopharyngeal squamous cell carcinomas undergoing radical surgery at Fudan University Shanghai Cancer Center were reviewed. The clinicopathological features were analyzed retrospectively. The optimal cutoff values were determined based on the receiver operating characteristic curve analysis. Pearson correlation coefficients were used to assess the correla-tions between variables. The Kaplan–Meier and Cox proportional hazard methods were used to evaluate the impact of variables on overall survival (OS), disease-specific survival (DSS), and disease-free survival (DFS).
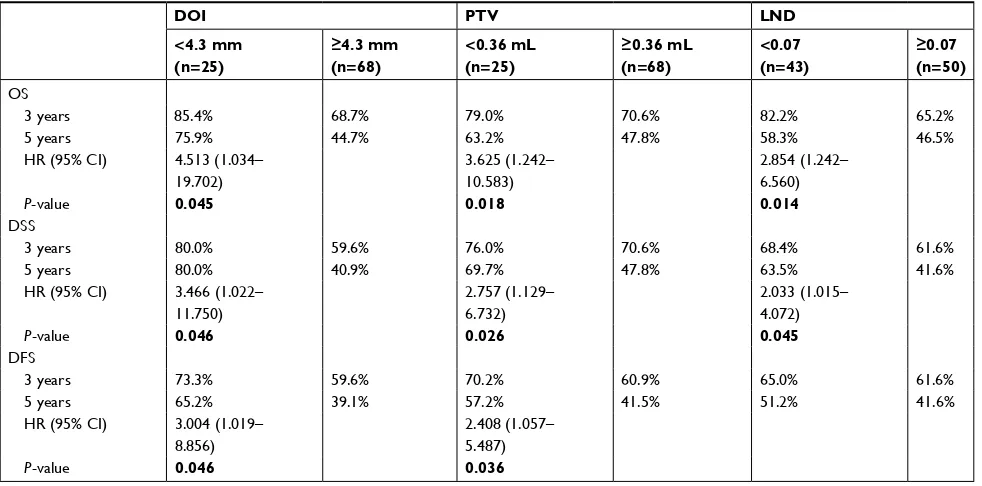
Results: Cox multivariate analysis revealed that a depth of invasion (DOI) ≥ 4.3 mm was corre-lated with inferior OS (P=0.045), DSS (P=0.046), and DFS (P=0.046). A primary tumor volume (PTV) ≥0.36 mL was related to poor OS (P=0.018), DSS (P=0.026), and DFS (P=0.036). A lymph node density (LND) ≥0.07 was also associated with worse OS (P=0.014) and DSS (P=0.045). Moreover, additional prognostic value was observed in the combined use of PTV and LND.
Conclusion: The DOI, PTV, and LND obtained from the surgical specimens could provide
additional valuable information for prognostic stratification and allowed the more appropriate selection of suitable candidates for more aggressive adjuvant therapy.
Keywords: hypopharynx, surgery, depth of invasion, primary tumor volume, lymph node
density, survival
Introduction
Hypopharyngeal cancer is not very prevalent accounting for 2.8%–6.5% of upper aerodigestive tract (UADT) cancers.1–3 Tumors arising from the hypopharyngeal
regions have specific clinicopathological characteristics distinguishing them from other UADT cancers.4–7 At diagnosis, 56.7%–80.5% of patients have T3/T4 disease
and 56.7%–83.7% have regional nodal metastasis (N+). Approximately 70%–87% of tumors are in advanced stages (III/IV disease) at initial presentation.4,5,7–12 Despite
aggressive combined treatment modalities, the prognosis of hypopharyngeal cancer remains the worst among UADT cancers.1–3
Traditionally, surgical ablation remains the preferred approach for treating hypo-pharyngeal cancer. Postoperative radiotherapy/chemoradiotherapy is recommended for adverse pathological features in accordance with the National Comprehensive Cancer Network (NCCN) Clinical Practice Guidelines.13 Nevertheless, the outcomes remain
compromised, with 5-year overall survival (OS) rates ranging from 41% to 55%.8,9,11,12,14
Correspondence: hong-Mei Ying Department of Radiation Oncology, Fudan University shanghai Cancer Center, 270 Dongan Road, shanghai 200032, P.R. China
Tel +86 21 6417 5590 Fax +86 21 6417 477
email dryinghongmei@163.com
Journal name: Cancer Management and Research Article Designation: Original Research Year: 2018
Volume: 10
Running head verso: Ye et al
Running head recto: Survival of patients with HPSCC DOI: http://dx.doi.org/10.2147/CMAR.S178750
Cancer Management and Research downloaded from https://www.dovepress.com/ by 118.70.13.36 on 20-Aug-2020
For personal use only.
Dovepress Ye et al
Understanding the significance of the primary tumor characteristics and regional nodal metastases is of criti-cal importance for gaining important insights into cancer growth and enabling more rational therapy decisions in clinical practice. We have previously demonstrated that some pathological characteristics are important prognostic factors.8 The lymph node density (LND) in
hypopharyn-geal cancer is believed to be of greater prognostic value than traditional nodal staging,8,11,12,14 which is calculated
as the number of metastatic lymph nodes (LNs) divided by the total number of resected LNs. Additionally, the depth of invasion (DOI)15–17 and the primary tumor volume
(PTV)9,10,18 are found to provide prognostic information in
hypopharyngeal cancer. The DOI is measured as the deepest structure reached by the primary tumor. The PTV is a three-dimensional concept that can be calculated with a modified formula19,20: PTV (mL) = tumor maximal diameter (mm)
× tumor minimal diameter (mm) × DOI (mm) ÷ 2×10⁻³. In
this study, we sought to gain a further insight into potential variables of surgical specimens that might hold promise for improving prognosis.
Patients and methods
study population
This retrospective study was approved by the Institutional Review Board of the Fudan University Shanghai Cancer Center. All patients provided written informed consent to participate. The study was performed in accordance with the principles of the Declaration of Helsinki and its amendments.
Between August 2007 and December 2016, the medical records of patients with primary hypopharyngeal squamous cell carcinoma (HPSCC) undergoing radical surgery at the Fudan University Shanghai Cancer Center were reviewed. The eligibility criteria were as follows: 1) histologically confirmed SCC in the hypopharyngeal region; 2) received radical resection of primary tumor and metastatic LNs with negative margin microscopically; 3) cervical nodal status initially evaluated with contrast-enhanced MRI or com-puted tomography (CT) preoperatively; 4) no preoperative chemotherapy or radiotherapy; and 5) no previous history of cervical LN dissection. Patients who were diagnosed with carcinoma in situ, who underwent incomplete primary tumor dissection with positive margin, or who experienced HPSCC recurrence were excluded.
Patients were screened with a full workup before treat-ment, including a complete medical history, physical exami-nation, electronic laryngoscope examiexami-nation, esophageal barium meal examination, contrast-enhanced MRI or CT
scan of the neck, plain chest CT scan, abdominal ultrasound, whole-body single-photon emission CT bone scan, complete blood count, and serum biochemistry profile. The tumor stage was classified using the seventh edition of the American Joint Committee on Cancer (AJCC) staging system.
surgery and adjuvant therapy
All patients underwent radical hypopharyngectomy and neck nodal dissection. Radical neck dissection was per-formed ipsilaterally in patients with clinically positive nodal metastasis (cN+), which involves levels II to VI or level I involvement. In case of contralateral clinically negative nodal metastasis (cN–), elective neck dissection (END) for contralateral neck was carried out in patients with tumors approaching or crossing the midline of the sagittal plane or tumor arising from the posterior wall or postcricoid regions. With regard to bilateral cN–, ipsilateral END was adopted in patients with lesion in pyriform sinus unilaterally not approaching the midline. Otherwise, bilateral END was performed. The scope of END included levels II to IV or level VI involvement.
Postoperative radiotherapy was recommended based on pathological findings, including 1) a primary pathological tumor classification (pT) of 3 or above, 2) close margins (<5 mm), 3) a pathological nodal classification (pN) of 2 or above, 4) extracapsular spread (ECS) of the LN, 5) perineural invasion, and 6) lymphovascular invasion. Radiotherapy was administered in the form of intensity-modulated radiotherapy with 6 megavoltage photons. The prescribed dose was 2.0 Gy in a daily fraction, given 5 days per week. The total dose was 60 Gy to high-risk microinvasive areas (CTV1) and 54 Gy to low-risk areas (CTV2). The CTV1 included the tumor bed of primary lesion with a concentrically isotropic margin of 2 cm in upward and downward directions, lymphatic areas of level II, III, VA, and VIII, and the station of the pathologi-cally positive lymph nodes. The CTV2 were the lymphatics of level IV and VB. The tumor bed was boost to 66 Gy in selective cases with extensive preoperative tumor load. CTV2 was not considered in case of pN0 classification. For patients with ECS, concurrent chemotherapy with cisplatin-based agents was administered at 80 mg/m2 every 3 weeks or 40
mg/m2 weekly.
Follow-up and clinical endpoints
After the completion of treatment, patients received regular examinations at outpatient clinics at 3-month intervals during the first 2 years, every 6 months in the third to fifth years, and annually thereafter.
Cancer Management and Research downloaded from https://www.dovepress.com/ by 118.70.13.36 on 20-Aug-2020
Dovepress survival of patients with hPsCC
The endpoints were OS, disease-specific survival (DSS), and disease-free survival (DFS). All endpoints were defined as the time interval between the initial therapy and the date of failure. For patients who were still alive or showed no progressive disease, the latest date of follow-up was recorded.
histopathological analysis
All surgical specimens were oriented and labeled by the surgeons before being fixed in 10% buffered formalin and embedded in paraffin. The specimens were sectioned for routine H&E staining. The histopathological review was per-formed by two experienced pathologists who were blinded to the patients’ medical information. When significant disagree-ment occurred, a third pathologist was needed to minimize the deviation. The DOI was measured from the basement membrane to the deepest point of the tumor. The dimension A was taken in exophytic tumor (Figure 1A) and dimension B in ulcerative type (Figure 1B).
statistical analysis
The SPSS version 22.0 (IBM, Armonk, NY, USA) was used for the data analysis. Receiver operating characteristic (ROC) analysis was applied to evaluate the optimal thresh-old values of variables for predicting survival. Pearson correlation coefficients were used to assess the correlations between variables. Survival curves for OS, DSS, and DFS were obtained utilizing the Kaplan–Meier method. Log-rank tests were performed to explore the significance of the tested variables on survival outcomes. Univariate and multivariate Cox proportional hazards regression analyses were carried out to assess the significance of variables associated with clinical outcomes. All variables identified in the univariate analysis were entered into the multivariate analysis. Log-minus-log plots were used to evaluate the proportional hazard
assumption. Any result with a two-sided P-value <0.05 was considered statistically significant.
Results
Basic characteristics
A total of 93 HPSCC patients were eligible for this study, and their clinicopathological features are provided in Table 1. The affected subsites were the pyriform sinus in 81 cases, the postcricoid area in 6 cases, and the posterior pharyngeal wall in 6 cases. All patients underwent neck nodal dissection, 31 (33.3%) received bilateral dissection, and 62 (66.7%) had unilateral dissection. Based on the seventh edition of the AJCC staging system, there were 6 (6.5%) patients in stage I, 6 (6.5%) in stage II, 14 (15.1%) in stage III, and 67 (72.0%) in stage IV.
In general, the median follow-up time was 33.1 months, ranging from 6.1 to 110.7 months. Throughout the period, 23 (24.7%) patients developed locoregional recurrence, 32 (34.4%) experienced distant metastasis, and 38 (40.9%) died. The 3- and 5-year OS, DSS, and DFS rates were 72.9%, 64.9%, 63.4%, and 52.0%, 50.3%, 45.8%, respectively.
ROC curve analysis was performed to evaluate the opti-mal cutoff values of the potential variables for mortality. Cutoff thresholds of 4.3, 0.36, and 0.07 were chosen for the DOI, PTV, and LND, respectively.
survival analysis
In terms of the DOI, there were 68 (73.1%) patients with DOI ≥4.3 mm and 25 (26.9%) with DOI <4.3 mm. Patients with higher DOI had inferior OS (3-year: 68.7% vs 85.4%; 5-year: 44.7% vs 75.9%, P=0.006; Figure 2A), DSS (3-year: 59.6% vs 80.0%; 5-year: 40.9% vs 80.0%, P=0.002; Figure 2B), and DFS (3-year: 59.6% vs 73.3%; 5-year: 39.1% vs 65.2%, P=0.004; Figure 2C). With regard to the PTV, there were 68 (73.1%) patients with PTV ≥0.36 mL and 25 (26.9%) with PTV <0.36 mL. Similarly, patients with high PTV suf-fered poorer OS (3-year: 70.6% vs 79.0%; 5-year: 47.8% vs 63.2%, P=0.031; Figure 2D), DSS (3-year: 70.6% vs 76.0%; 5-year: 47.8% vs 69.7%, P=0.013; Figure 2E), and DFS (3-year: 60.9% vs 70.2%; 5-year: 41.5% vs 57.2%, P=0.02; Figure 2F). Regarding the LND, there were 50 (53.8%) patients with LND ≥0.07 and 43 (46.2%) with LND <0.07. Patients with high LND also had worse OS (3-year: 65.2% vs 82.2%; 5-year: 46.5% vs 58.3%, P=0.027; Figure 2G) and DSS (3-year: 61.6% vs 68.4%; 5-year: 41.6% vs 63.5%,
P=0.021; Figure 2H); however, the difference in DFS was insignificant (3-year: 61.6% vs 65.0%; 5-year: 41.6% vs 51.2%, P=0.062; Figure 2I).
M
M
BM
BM
A B
A B
Figure 1 Measurement methods for depth of invasion from basement membrane to the deepest point of tumor: dimension a in exophytic specimen (A) or dimension B in ulcerative specimen (B).
Abbreviations: BM, basement membrane; M, mucosal surface.
Cancer Management and Research downloaded from https://www.dovepress.com/ by 118.70.13.36 on 20-Aug-2020
Dovepress Ye et al
Cox univariate analysis (Table 2) indicated that DOI
≥4.3 mm was associated with worse OS (P=0.010), DSS (P=0.005), and DFS (P=0.007). PTV ≥0.36 mL was corre-lated with poorer OS (P=0.037), DSS (P=0.017), and DFS (P=0.024). LND ≥0.07 was related to inferior OS (P=0.031) and DSS (P=0.023); however, the relation was not significant in terms of DFS (P=0.065).
Correlations assessed by Pearson correlation coefficients revealed positive correlations among these three variables (Fig-ure S1): DOI and PTV (r=0.876, P<0.0001), DOI and LND (r=0.660, P<0.0001), and PTV and LND (r=0.513, P=0.011). Because the collinearity would lead to highly unstable estimated regression coefficients, the DOI, PTV, and LND were entered separately into different multivariate regression models.
Cox multivariate analysis (Table 3) revealed that the DOI was significantly correlated with OS (HR: 4.513, 95% CI: 1.034–19.702, P=0.045), DSS (HR: 3.466, 95% CI: 1.022–11.750, P=0.046), and DFS (HR: 3.004, 95%
Table 1 Clinicopathological characteristics of 93 patients with hypopharyngeal squamous cell carcinoma
Characteristics N (%)
age
Mean ± sD (range, years)
56.9±9.8 (32–87)
sex
Male 91 (97.8)
Female 2 (2.2)
Cigarette smoking
no 15 (16.1)
Yes 78 (83.9)
alcohol drinking
no 27 (29.0)
Yes 66 (71.0)
Pharyngolaryngectomy
Total 43 (46.2)
Partial 50 (53.8)
neck nodal dissection
Bilateral 31 (33.3)
Unilateral 62 (66.7)
Tumor differentiation
Well 4 (4.3)
Moderate 63 (67.7)
Poor 26 (28.0)
Primary tumor subsite
Pyriform sinus 81 (87.1)
Posterior wall 6 (6.5)
Postcricoid region 6 (6.5)
pT classificationa
T1 19 (20.4)
T2 40 (43.0)
T3 18 (19.4)
T4 16 (17.2)
pN classificationa
n0 15 (16.1)
n1 19 (20.4)
n2a/b/c 1 (1.1) / 49 (52.7) /
9 (9.7)
n3 0 (0)
pTNM classificationa
i 6 (6.5)
ii 6 (6.5)
iii 14 (15.1)
iV 67 (72.0)
DOi
Mean ± sD (range, mm)
6.3±3.4 (0.6–15.0)
<4.3 mm 25 (26.9)
≥4.3 mm 68 (73.1)
PTV
Mean ± sD (range, ml)
2.08±3.02 (0.02–16.66)
<0.36 ml 25 (26.9)
≥0.36 ml 68 (73.1)
Tumor differentiation
Well 4 (4.3)
Moderate 63 (67.7)
(Continued)
Table 1 (Continued)
Characteristics N (%)
Poor 26 (28.0)
no. of metastatic ln
Mean ± sD (range) 3±3 (0–34)
lnD
Mean ± sD (range) 0.11±0.15
(0.00–0.63)
<0.07 43 (46.2)
≥0.07 50 (53.8)
eCs of ln
negative 80 (86.0)
Positive 13 (14.0)
surgical margin
≥5 mm 86 (92.5)
<5 mm 7 (7.5)
Perineural invasion
negative 79 (84.9)
Positive 14 (15.1)
lymphovascular invasion
negative 69 (74.2)
Positive 24 (25.8)
Postoperative treatment
no 7 (7.5)
RT alone 56 (60.2)
CCRT 30 (32.3)
Notes: aTumor-node-metastasis staging system according to the american Joint
Committee on Cancer (seventh edition).
Abbreviations: CCRT, combined chemoradiotherapy; DOi, depth of invasion; eCs, extracapsular spread; ln, lymph node; lnD, lymph node density; pn, pathological node; pT, pathological tumor; pTnM, pathological tumor-node-metastasis; PTV, primary tumor volume; RT, radiotherapy.
Cancer Management and Research downloaded from https://www.dovepress.com/ by 118.70.13.36 on 20-Aug-2020
Dovepress survival of patients with hPsCC
CI: 1.019–8.856, P=0.046). The PTV was identified as an independent prognostic predictor for OS (HR: 3.625, 95% CI: 1.242–10.583, P=0.018), DSS (HR: 2.757, 95% CI: 1.129–6.732, P=0.026), and DFS (HR: 2.408, 95% CI: 1.057–5.487, P=0.036). On the contrary, high LND was confirmed as an independent prognostic factor for poor OS (HR: 2.854, 95% CI: 1.242–6.560, P=0.014) and DSS (HR: 2.033, 95% CI: 1.015–4.072, P=0.045).
Prognostic scoring system
A prognostic scoring system was formulated by summing the significant risk factors, as follows: 0 for PTV <0.36 mL or LND <0.07; one for PTV ≥0.36 mL or LND ≥0.07. There were 16 (17.2%) patients with a score of 0, 36 (38.7%) with a score of 1, and 41 (44.1%) with a score of 2.
The data indicated that a score of 0 showed the best OS (5-year: 60.0%, 56.6%, and 43.5%, respectively, P=0.017;
Figure 3A), DSS (5-year: 76.6%, 56.5%, and 37.9%, respec-tively, P=0.008; Figure 3B), and DFS (5-year: 54.4%, 51.4%, and 37.9%, respectively, P=0.025; Figure 3C) compared with scores 1 and 2.
Discussion
Hypopharyngeal cancer is distinguished from other UADT cancers in anatomical structures and biological behaviors. Concealed anatomy and extensive submucosal spread bring about an initial underestimation of the tumor extent and the presence of multifocal lesions.7 Cervical metastases are
exceptionally frequent due to highly anastomotic lymphatics and signify advanced disease and deteriorated survival.4–7
Therapeutic decisions for managing hypopharyngeal cancer remain a crucial matter of debate, especially regarding therapy intensity and sequencing.21 Postoperative
radiother-apy is administered in the case of pT3/4, pN2/3, positive or
1.0 A 0.8 0.6 0.4 0.2 0.0 0 12 25
68 6425 4819 3312 1025 179 118 69 65 14 2568 5524 3717 1229 2010 169 98 66 11 11 2568 5524 1737 2912 1020 169 98 66 45 41 DOI < 4.3 mm
Overall surviva
l
DOI ≥ 4.3 mm
P=0.006
24 36 48 60 72 Time (months)
Number at risk Number at risk Number at risk
Number at risk Number at risk Number at risk
Number at risk Number at risk Number at risk
84 96 108 1.0 B 0.8 0.6 0.4 0.2 0.0 0 12
DOI < 4.3 mm
Disease-specific surviva
l
DOI ≥ 4.3 mm
DOI<4.3 mm DOI≥4.3 mm DOI < 4.3 mm
DOI ≥ 4.3 mm DOI < 4.3 mmDOI ≥ 4.3 mm
P=0.002
24 36 48 60 72 Time (months)
84 96 108 1.0 C 0.8 0.6 0.4 0.2 0.0
DOI < 4.3 mm
Disease-free surviva
l
DOI ≥ 4.3 mm
P=0.004
Time (months)
0 12 24 36 48 60 72 84 96 108
D 1.0 0.8 0.6 0.4 0.2 0.0 0 12 25
68 6424 4423 3213 1124 188 127 69 45 14 2568 5424 3618 1328 2010 178 107 66 54 13 2568 5424 1836 2813 1020 178 107 66 45 31 PTV < 0.36 ml
Overall surviva
l
PTV ≥ 0.36 ml
P=0.031
24 36 48 60 72 Time (months)
84 96 108
E 1.0 0.8 0.6 0.4 0.2 0.0 0 12
PTV < 0.36 ml
Disease-specific surviva
l
PTV ≥ 0.36 ml
PTV < 0.36 ml
PTV ≥ 0.36 ml PTV < 0.36 ml
PTV ≥ 0.36 ml PTV PTV < 0.36 ml≥ 0.36 ml P=0.013
24 36 48 60 72 Time (months)
84 96 108 1.0 F 0.8 0.6 0.4 0.2 0.0
PTV < 0.36 ml
Disease-free surviva
l
PTV ≥ 0.36 ml
P=0.020
Time (months)
0 12 24 36 48 60 72 84 96 108
G 1.0 0.8 0.6 0.4 0.2 0.0 0 12 43
50 4842 3433 2421 1421 1412 811 87 56 23 4350 4138 2727 1823 1812 1411 710 75 44 23 4350 4138 2727 2318 1218 1411 710 75 54 32 LND < 0.07
Overall surviva
l
LND ≥ 0.07
P=0.027
24 36 48 60 72
Time (months) 84 96 108
H 1.0 0.8 0.6 0.4 0.2 0.0 0 12
LND < 0.07
Disease-specific surviva
l
LND ≥ 0.07
LND < 0.07
LND ≥ 0.07
LND < 0.07
LND ≥ 0.07 LND LND < 0.07≥ 0.07
P=0.021
24 36 48 60 72 Time (months)
84 96 108 1.0 I 0.8 0.6 0.4 0.2 0.0
LND < 0.07
Disease-free surviva
l
LND ≥ 0.07
P=0.062
Time (months)
0 12 24 36 48 60 72 84 96 108
Figure 2 Kaplan–Meier survival curves of overall survival (A, D, G), disease-specific survival (B, E, H), and disease-free survival (C, F, I) according to the depth of invasion (DOi), primary tumor volume (PTV), and lymph node density (lnD). log-rank test, P<0.05.
Cancer Management and Research downloaded from https://www.dovepress.com/ by 118.70.13.36 on 20-Aug-2020
Dovepress Ye et al
close surgical margins, ECS of the LNs, perineural invasion, and lymphovascular invasion, according to the NCCN guide-lines.13 Nevertheless, some patients continue to face a dismal
prognosis.8,9,11,12,14 Over the past decade, more attention has
been directed toward the risk factors of surgical specimens, in addition to tumor-node-metastasis (TNM) staging, that might influence clinical outcomes.8–12,14–18 Generally, the size
and extent of the local spread of the primary tumor and the extent of regional dissemination are chief determinants of the prognosis in this distinct entity.
The DOI reflects the third dimension of the primary tumor. It is not only a quantitative assessment of the deepest anatomical structures reached by the tumor but also a qualita-tive indicator of the aggressive potential for local infiltration. It is well established that tumor cells with greater malignant potential are prone to invade vertically.15,22 The DOI can
be considered a product of the biological aggressiveness of the primary tumor and the host’s defense to the tumor. Increasing depth is considered to be correlated well with the occurrence of regional nodal disease in hypopharyngeal
Table 2 Univariate Cox regression analysis of clinicopathological variables affecting survival outcomes of 93 patients with hypopharyngeal squamous cell carcinoma
Variables OS DSS DFS
HR (95% CI) P-value HR (95% CI) P-value HR (95% CI) P-value
Primary tumor subsite
0.109 0.386 0.126
Pyriform sinus Ref Ref Ref
Posterior wall 2.008 (0.773–5.214) 1.220 (0.434–3.429) 1.396 (0.548–3.556)
Postcricoid region
1.968 (0.589–6.573) 1.637 (0.500–5.357) 2.132 (0.754–6.026)
Tumor differentiation
0.799 0.938 0.807
Well/moderate Ref Ref Ref
Poor 0.914 (0.457–1.826) 1.025 (0.544–1.932) 1.078 (0.592–1.963)
pTNM classificationa 0.365 0.148 0.240
i–ii Ref Ref Ref
iii–iV 1.937 (0.463–8.104) 2.857 (0.690–11.828) 2.020 (0.626–6.520)
DOi 0.010 0.005 0.007
<4.3 mm Ref Ref Ref
≥4.3 mm 3.935 (1.378–
11.232)
3.841 (1.511–9.764) 3.094 (1.369–6.993)
PTV 0.037 0.017 0.024
<0.36 ml Ref Ref Ref
≥0.36 ml 2.555 (1.056–6.178) 2.666 (1.188–5.984) 2.332 (1.118–4.864)
lnD 0.031 0.023 0.065
<0.07 Ref Ref Ref
≥0.07 2.172 (1.075–4.385) 2.071 (1.104–3.885) 1.737 (0.966–3.123)
eCs of ln 0.314 0.181 0.294
negative Ref Ref Ref
Positive 1.475 (0.693–3.138) 1.593 (0.805–3.155) 1.436 (0.730–2.825)
surgical margin <0.0001 0.006 0.008
≥5 mm Ref Ref Ref
<5 mm 6.042 (2.238–
16.316)
3.446 (1.421–8.355) 3.328 (1.378–8.035)
Perineural invasion 0.165 0.886 0.436
negative Ref Ref Ref
Positive 1.795 (0.786–4.096) 1.065 (0.451–2.516) 1.352 (0.633–2.888)
lymphovascular invasion
0.043 0.028 0.059
negative Ref Ref Ref
Positive 2.007 (1.021–3.944) 1.985 (1.079–3.651) 1.777 (0.978–3.229)
Notes: aTumor-node-metastasis staging system proposed by the american Joint Committee on Cancer (seventh edition). Bold values indicate P-value<0.05.
Abbreviations: DFS, disease-free survival; DOI, depth of invasion; DSS, disease-specific survival; ECS, extracapsular spread; LN, lymph node; LND, lymph node density; OS, overall survival; PTV, primary tumor volume; pTnM, pathological tumor-node-metastasis; Ref, reference.
Cancer Management and Research downloaded from https://www.dovepress.com/ by 118.70.13.36 on 20-Aug-2020
Dovepress survival of patients with hPsCC
cancer.16,17 However, reports relating to predicting survival
are scarce.15 On the contrary, the PTV encompasses all three
dimensions of the tumor adequately.19,20 Larger tumor bulk
is related to an increased number of clonogenic tumor cells and increased radioresistance due to tumor hypoxia.23,24
Additionally, volumetric staging has been documented to be an accurate predictor of prognosis superior to T staging in hypopharyngeal cancer.9,10,18
N+ disease is generally claimed to be the most potent prognostic indicator of early regional relapse, distant metas-tasis, and inferior survival in patients with hypopharyngeal cancer.2,5,6,8,11,12,14 N+ hypopharyngeal cancer is staged as
III/IV according to the AJCC staging system and is well
established as a major matter of concern, with at least a 25% reduction in OS.5 The LND, incorporating the burden
of regional nodal disease with the extent of nodal dissection, addresses the role of neck dissection as both a diagnostic and therapeutic procedure. Assessment accuracy is determined by three essential elements: the standard range of neck dis-section, consummate surgical skills, and pathological mea-surement. The LND has been found to be a better indicator of prognosis in hypopharyngeal cancer than N staging.8,11,12,14
In summary, the DOI and PTV assess the primary tumor mass, while the LND is a better indicator of the regional nodal burden. The current study clearly shows that higher DOI, PTV, and LND are predictive of poorer prognosis in
Table 3 Multivariate Cox regression analysis of potential variables affecting survival outcomes of 93 patients with hypopharyngeal squamous cell carcinoma
DOI PTV LND
<4.3 mm (n=25)
≥4.3 mm (n=68)
<0.36 mL (n=25)
≥0.36 mL (n=68)
<0.07 (n=43)
≥0.07
(n=50)
Os
3 years 85.4% 68.7% 79.0% 70.6% 82.2% 65.2%
5 years 75.9% 44.7% 63.2% 47.8% 58.3% 46.5%
hR (95% Ci) 4.513 (1.034– 19.702)
3.625 (1.242– 10.583)
2.854 (1.242– 6.560)
P-value 0.045 0.018 0.014
Dss
3 years 80.0% 59.6% 76.0% 70.6% 68.4% 61.6%
5 years 80.0% 40.9% 69.7% 47.8% 63.5% 41.6%
hR (95% Ci) 3.466 (1.022– 11.750)
2.757 (1.129– 6.732)
2.033 (1.015– 4.072)
P-value 0.046 0.026 0.045
DFs
3 years 73.3% 59.6% 70.2% 60.9% 65.0% 61.6%
5 years 65.2% 39.1% 57.2% 41.5% 51.2% 41.6%
hR (95% Ci) 3.004 (1.019– 8.856)
2.408 (1.057– 5.487)
P-value 0.046 0.036
Note: Bold values indicate P-value<0.05.
Abbreviations: DFS, disease-free survival; DOI, depth of invasion; DSS, disease-specific survival; LND, lymph node density; OS, overall survival; PTV, primary tumor volume.
1.0 A 0.8 0.6 0.4 0.2 0.0 0 12 16
36 35 27 17 12 11 9
16 15 9 7 5 5 4
7 63 23
Score 0: 60.6% (5-yr)
Overall surviva
l
Score 1: 56.6% (5-yr) Score 2: 43.5% (5-yr)
P=0.017
24 36 48 60 72 Time (months) Number at risk
84 96 108
Score 0 Score 1
41 39 26 20 17 11 6 5 3 1
Score 2 1.0 B 0.8 0.6 0.4 0.2 0.0 0 12 16
36 32 20 14 11 10 8
16 13 9 6 5 5 4
6 43 23
Score 0: 76.6% (5-yr)
Disease-specific surviva
l
Score 1: 56.5% (5-yr) Score 2: 37.9% (5-yr)
P=0.008
24 36 48 60 72 Time (months) Number at risk
84 96 108
Score 0 Score 1
41 32 22 19 14 11 5 3 3 1
Score 2 C 1.0 0.8 0.6 0.4 0.2 0.0 0 12 16
36 32 20 14 11 10 8
16 13 9 6 5 5 4
6 43 23
Score 0: 54.4% (5-yr)
Disease-free surviva
l
Score 1: 51.4% (5-yr) Score 2: 37.9% (5-yr)
P=0.025
24 36 48 60 72 Time (months) Number at risk
84 96 108
Score 0 Score 1
41 32 22 19 14 11 5 3 3 1
Score 2
Figure 3 Kaplan–Meier survival curves of overall survival (A), disease-specific survival (B), and disease-free survival (C) according to the prognostic scoring system. log-rank test, P<0.05.
Notes: *scoring according to PTV (primary tumor volume) ≥0.36 ml and lnD (lymph node density) ≥0.07.
Cancer Management and Research downloaded from https://www.dovepress.com/ by 118.70.13.36 on 20-Aug-2020
Dovepress Ye et al
hypopharyngeal cancer patients. As the PTV incorporates the DOI in its calculation, we formulated a scoring system using the PTV and LND to define distinct prognostic groups for further analysis. The combination of these two novel prog-nostic scores had a significant impact on survival prognosis. Current strategies may not be sufficient for patients with one or more of the above risk factors.
Although our results are consistent with those of previous related studies, some notable limitations might impede the reliability of these prognostic indicators, such as different cancer entities,4,15–17 diverse therapeutic strategies,10,18 and
relatively small populations.9–11,16,17 Additionally, the
volu-metric assessment methods adopted are time-consuming, or labor-intensive, or based on nonuniform criteria.10,18
The major strengths of our study are the uniform grouping criteria and treatment modalities, as well as the limitation of the analysis specifically to primary hypopharyngeal cancer patients treated surgically with/without adjuvant therapy. Moreover, we incorporated three potential variables and provided further confirmation of the prognostic value greatly expanded by their combination in these patients; to the best of our knowledge, this is the first report to demonstrate these important findings.
The principal limitations are mainly associated with the relatively few included cases and the retrospective nature of the study with potential bias in the patient selection and follow-up data. On the contrary, cross-validation or multiple testing was not established, which may lead to overoptimistic results. The cutoff value of variables determined by ROC analysis neglected the time effect when selecting the moral-ity as the endpoint event. Large-scale prospective trials are needed to validate our results and confirm the clinical sig-nificance of these variables in this setting.
Conclusion
Although TNM staging reflects the overall disease status, it does not adequately assess tumor burden or biological activ-ity. Our results suggest that prognostic stratification could be improved with evaluation of the DOI, PTV, and LND for the more appropriate selection of suitable candidates for more aggressive adjuvant therapy.
Acknowledgment
This research did not receive any specific grant from funding agencies in the public, commercial, or not-for-profit sectors.
Disclosure
The authors report no conflicts of interest in this work.
References
1. Carvalho AL, Nishimoto IN, Califano JA, Kowalski LP. Trends in incidence and prognosis for head and neck cancer in the United States: a site-specific analysis of the SEER database. Int J Cancer. 2005;114(5):806–816.
2. Hall SF, Groome PA, Irish J, O’Sullivan B. The natural history of patients with squamous cell carcinoma of the hypopharynx. Laryngoscope. 2008;118(8):1362–1371.
3. Cooper JS, Porter K, Mallin K, et al. National Cancer Database report on cancer of the head and neck: 10-year update. Head Neck. 2009;31(6):748–758.
4. Huang YC, Lee YC, Tseng PH, et al. Regular screening of esophageal cancer for 248 newly diagnosed hypopharyngeal squamous cell car-cinoma by unsedated transnasal esophagogastroduodenoscopy. Oral Oncol. 2016;55:55–60.
5. Spector JG, Sessions DG, Haughey BH, et al. Delayed regional metas-tases, distant metasmetas-tases, and second primary malignancies in squa-mous cell carcinomas of the larynx and hypopharynx. Laryngoscope. 2001;111(6):1079–1087.
6. Werner JA, Dünne AA, Myers JN. Functional anatomy of the lymphatic drainage system of the upper aerodigestive tract and its role in metastasis of squamous cell carcinoma. Head Neck. 2003;25(4):322–332. 7. Ho CM, Lam KH, Wei WI, Yuen PW, Lam LK. Squamous cell
carci-noma of the hypopharynx--analysis of treatment results. Head Neck. 1993;15(5):405–412.
8. Ye LL, Oei RW, Kong FF, et al. The prognostic value of preopera-tive prognostic nutritional index in patients with hypopharyngeal squamous cell carcinoma: a retrospective study. J Transl Med. 2018;16(1):12.
9. Baghi M, Bisdas S, Engels K, et al. Prognostic relevance of volumetric analysis in tumour specimens of hypopharyngeal cancer. Clin Otolar-yngol. 2007;32(5):372–377.
10. Roh JL, Kim JS, Kang BC, et al. Clinical significance of pre-treatment metabolic tumor volume and total lesion glycolysis in hypopharyngeal squamous cell carcinomas. J Surg Oncol. 2014;110(7):869–875.
11. Hua YH, Hu QY, Piao YF, et al. Effect of number and ratio of positive lymph nodes in hypopharyngeal cancer. Head Neck. 2015;37(1):111–116. 12. Joo YH, Cho KJ, Kim SY, Kim MS. Prognostic significance of lymph
node density in patients with hypopharyngeal squamous cell carcinoma. Ann Surg Oncol. 2015;22(Suppl 3):1014–1019.
13. National Comprehensive Cancer Network [webpage on the Internet]. NCCN guidelines. Available from: https://www.nccn.org/professionals/ physician_gls/default.aspx#head-and-neck. Accessed October 10, 2018. 14. Lo WC, Wu CT, Wang CP, et al. The pretreatment neutrophil-to-lymphocyte ratio is a prognostic determinant of T3-4 hypopharyngeal squamous cell carcinoma. Ann Surg Oncol. 2017;24(7):1980–1988. 15. Moore C, Kuhns JG, Greenberg RA. Thickness as prognostic aid in
upper aerodigestive tract cancer. Arch Surg. 1986;121(12):1410–1414. 16. Ambrosch P, Kron M, Fischer G, Brinck U. Micrometastases in
carcinoma of the upper aerodigestive tract: detection, risk of metas-tasizing, and prognostic value of depth of invasion. Head Neck. 1995;17(6):473–479.
17. Tomifuji M, Imanishi Y, Araki K, et al. Tumor depth as a predictor of lymph node metastasis of supraglottic and hypopharyngeal cancers. Ann Surg Oncol. 2011;18(2):490–496.
18. Yang CJ, Kim DY, Lee JH, et al. Prognostic value of total tumor volume in advanced-stage laryngeal and hypopharyngeal carcinoma. J Surg Oncol. 2013;108(8):509–515.
19. Williams SS, Alosco TR, Mayhew E, Lasic DD, Martin FJ, Bankert RB. Arrest of human lung tumor xenograft growth in severe combined immunodeficient mice using doxorubicin encapsulated in sterically stabilized liposomes. Cancer Res. 1993;53(17):3964–3967.
20. Kuriakose MA, Loree TR, Hicks WL, Welch JJ, Wang H, Delacure MD. Tumour volume estimated by computed tomography as a predic-tive factor in carcinoma of the tongue. Br J Oral Maxillofac Surg. 2000;38(5):460–465.
Cancer Management and Research downloaded from https://www.dovepress.com/ by 118.70.13.36 on 20-Aug-2020
Dovepress survival of patients with hPsCC
21. Takes RP, Strojan P, Silver CE, et al. Current trends in initial manage-ment of hypopharyngeal cancer: the declining use of open surgery. Head Neck. 2012;34(2):270–281.
22. Clark WH, From L, Bernardino EA, Mihm MC. The histogenesis and biologic behavior of primary human malignant melanomas of the skin. Cancer Res. 1969;29(3):705–727.
23. Johnson CR, Thames HD, Huang DT, Schmidt-Ullrich RK. The tumor volume and clonogen number relationship: tumor control predictions based upon tumor volume estimates derived from computed tomogra-phy. Int J Radiat Oncol Biol Phys. 1995;33(2):281–287.
24. Lartigau E, Le Ridant AM, Lambin P, et al. Oxygenation of head and neck tumors. Cancer. 1993;71(7):2319–2325.
Cancer Management and Research downloaded from https://www.dovepress.com/ by 118.70.13.36 on 20-Aug-2020
Dovepress
Cancer Management and Research
Publish your work in this journal
Submit your manuscript here: https://www.dovepress.com/cancer-management-and-research-journal Cancer Management and Research is an international, peer-reviewed open access journal focusing on cancer research and the optimal use of preventative and integrated treatment interventions to achieve improved outcomes, enhanced survival and quality of life for the cancer patient. The manuscript management system is completely online and includes
a very quick and fair peer-review system, which is all easy to use. Visit http://www.dovepress.com/testimonials.php to read real quotes from published authors.
Dove
press
Ye et al
Supplementary materials
DOI DOI
PTV
PTV
0.876 0.876
0.660
0.660
0.513 0.513
Correlation < 0.8 Correlation ≥ 0.8
LND
LND
Figure S1 Correlation between pathological variables. Pearson correlation coef-ficient, P<0.05.
Abbreviations: DOi, depth of invasion; lnD, lymph node density; PTV, primary tumor volume.
Cancer Management and Research downloaded from https://www.dovepress.com/ by 118.70.13.36 on 20-Aug-2020