factor for estimating wind erodibility of farm fields. J. Soil and Water Conserv. 17: 162-165.
CHEPIL, W. S., F. H. SIDDOWAY, AND D. V. ARMBRUST. 1964. Wind erod- ibility of knolly terrain. J. Soil and Water Conserv. 19:179-181.
FRANKLIN, W. T. 1969. Mineralogy of representative soils at the Pawnee Site. Tech. Rep. No. 30, Grassland Biome, U.S. Intern. Biol. Program. Colorado State Univ., Fort Collins. 9 P-
GALBRAITH, A. F. 1969. Soil water study of a shortgrass prairie ecosys- tem Pawnee Site. Tech. Rep. No. 6, Grassland Biome, U.S. Intern. Biol.
9
Program. Colorado State Univ., Fort Collins. 52 p.
HYDER, D. N., R. E. BEMENT, E. E. REMMENGA, AND C. TERWILLIGER, JR. 1966. Vegetation-soils and vegeta- tion-grazing relations from frequency data. J. Range Manage. 19: 11-17. HYDER, D. N., AND R. E. BEMENT.
1970. Soil physical conditions after plowing and packing of ridges. J. Range Manage. 23:289-292.
JOHNS, H. E. 1964. The Physics of Radiology. Charles C. Thomas, Springfield, Illinois. 767 p.
LAPP, R. E., AND H. L. ANDREWS. 1964. Nuclear Radiation Physics. Prentice- Hall, Inc., Englewood Cliffs, N.J.
413 p. -
9
1 ’
Estimating Forage Protiuctlon
from Shrub Ring Widths in
Hot Creek Vallky, Nevada’!”
J. BARRY DAVISs, PAUL T. TUELLER, AND ALLEN D. BRUNER
Graduate Fellow, Associate Range Ecologist, and Research Associate, Renewable Resources Center,
University of Nevada, Reno.
Highlight
Floristic and soil factors on 60 sites in the shadscale and sagebrush zone in Hot Creek Valley, Nevada were sampled to derive one or more equations for estimating production on those sites. The factors were analyzed by an all possible correlation followed by stepwise regression with production as the dependent variable. Many of the factors correlated significantly with production, but widths of growth rings of shrubs accounted for most of the variation in production. Thus, ring widths of big sagebrush, bud sagebrush, shad- scale, common winterfat, and spiny hopsage were used to derive regression equations to estimate forage production. Big sagebrush and shadscale ring widths varied exponen- tially with production, while a linear relationship expressed the regression of production on ring widths for the other shrubs. The linear regression probably represents only a portion of the complete curve. The methods of collection and analysis of shrub rings to derive production estimation equations could probably be extended to other areas within the Great Basin.
Forage productivity, with reservations due to varying stages of plant succession, has been used extensively as an index of site quality. Productivity
l Received August 18, 1971.
2 The authors wish to acknowledge support of this study by the USAEC, Nevada Operations Office, Life Sciences Branch, AEC Contract AT(26-1)-409.
3 Now Forester, U.S. Forest Service, Ephraim, Utah.
LYONS, T. L., H.O. BUCKMAN, AND N. C. BRADY. 1952. The Nature and Properties of Soils. Macmillian Co., New York. 591 p.
MCHENRY, J. R. 1968. Use of tracer technique in soil erosion research. Trans. Amer. Sot. Agr. Eng. 11:619- 625.
SAMPSON, A. W. 1944. Effect of chap- arral burning on soil erosion and on soil moisture relations. Ecology 25:
171-191.
WOODRUFF, N. P., AND F. H. SIDDOWAY. 1965. A wind erosion equation. Soil Sci. Sot. Amer. Proc. 29:602-608. WOOLRIDGE, D. D. 1965. Tracing soil
particle movement with Fe-59. Soil Sci. Sot. Amer. Proc. 29:469-472.
is a function of at least climate, vegetation, soil, time, and biota. We need to relate production, as the dependent variable, to site characteristics in developing production estimation equations.
Carmean (1954) determined the effects of soil, climate, and topography on the growth of Douglas- fir [Pseudotsuga Menziesii (Mirb.) France] in south- western Washington. He linked site quality with specific site factors, and developed prediction equa- tions of the general form,
Y = f (X, x2 . . . X,)
which expressed tree height in terms of tree age and associated environmental conditions. Carmean found that site quality for Douglas-fir increased with an increase in depth to substratum, decreased with an increase in percent of gravel in the soil profile, and decreased as soil compaction increased.
Hulett et al. (1969) found that total forage pro- duction and total basal area on clay upland range sites in western Kansas increased as the combined depth of the A and B horizon increased. Doolittle (1957) noted that depth of the A horizon accounted for 91% of the variation in the site index of scarlet and black oak in the southern Appalachians.
Soil texture, like depth, has been a useful index to productivity. Medin (1960) found that the production of mountainmahogany (Cercocarpus montanus Raf.) varied directly with the clay con- tent of the A horizon and soil depth.
over respective precipitation indices and fitted by linear regression. Blaisdell (1958) observed a sim- ilar correlation between precipitation and subse- quent herbage yield along the upper Snake River. In western Kansas, forage production on clay up- land range sites was related to seasonal precipita- tion, with May and June precipitation the most influential determinant of total forage production (Hulett et al. 1969).
Floristic qualities by themselves have not been, until quite recently in the United States, related to site production. Kinsinger and Strickler (1961) in Nevada noted significant correlations between the production and ground cover of winterfat [Eurotia Zanata (Pursh) Moq.]. Crown diameters of Utah juniper [Juniperous utahensis (Engelm) Lemm.] were used successfully by Mason and Hutchings (1967) to estimate the total foliage production of juniper. Goebel et al. (1958) observed a definite correlation between plant cover estimate and herb- age production in shadscale [A triplex confertifoka (Torr. & Frem.) Wats.] and winterfat when these plants occurred in pure stands. Tower (1970) found significant correlations between the cover, density, and production in Nevada of antelope bit- terbrush [Purshia tridentata (Pursh) DC.].
McGinnies (1967) reported good correlations be- tween herbage production and radial increment of growth rings. He compared production of crested wheatgrass plantings with the annual growth incre- ments of trees and shrubs surrounding the seedings. DieHert (1938) in his description of the stem structure of big sagebrush (Artemisia tridentata Nutt.) describes the growth rings as annual rings. Ferguson (1964) found that the width of annual rings of big sagebrush were strongly correlated to winter precipitation in Arizona.
Experimental Area and Procedures
The Hot Creek study area is located within the Great Basin Section of the Basin and Range Province described by Hunt (1967). The study area is at the base of Morey Peak, about 70 miles northeast of Tonopah, and within the Atomic Energy Commission’s Central Nevada Supplement Test Site. The elevation of the area varies from 5,440 feet to 6,500 feet with an average elevation of 5,705 feet. The past an- nual ZO-year average precipitation for the Rattlesnake High- way station (elev. 5,910 feet) is 5.84 inches and the average temperature is 51 F.
The plant associations were defined on the basis of domi- nant shrubs in the overstory and dominant grasses or forbs in the understory. Once the plant associations were defined and delineated, a macroplot procedure was used to collect vegetation and ground cover information excluding produc- tion. Each plot was selected on the basis of uniformity, not only in regard to floristic composition, but also with regard to soil and relief. Vegetation data were collected from four to fourteen 15 x 30 m macroplots within each plant asso- ciation. Ten, 15 m transects were located perpendicular to the 30 m baseline and up slope where the slope could be de-
termined visually. Frequency, vegetative cover, and ground cover characteristics were determined along the 15 m tran- sects. Frequency percentages were determined as rooted presence in 100 microplots per macroplot. Cover, as used here, is the basal area of the forbs and grasses plus the shrub crown cover, The ground cover was classified into one of the following categories: (1) plant basal area, (2) litter, (3) bare soil, (4) gravel (2 mm to 7 cm), and (5) stone (greater than 7 cm diameter).
Productivity of grasses, forbs, and shrubs was determined from clippings on twenty 9.6 fta plots located along a line through the center of each macroplot. Grasses and forbs were clipped at ground level. Only the current year’s growth of the shrubs was removed. Clipping was completed each of 2 years after all of the major plant species had completed growth. This occurred during late August the first year and the first of September the second year. The plant material was oven-dried and weighed to the nearest gram. These weights were then converted to pounds per acre.
Within each macroplot a soil pit was dug to at least a 48-inch depth or until a duripan or bedrock was encountered. Soil characteristics such as pH, depth of horizon, color, and position on slope were coded so that differences in each property could be expressed quantitatively and used to de- termine their relationship to plant production on each macroplot. A soil sample was obtained from each soil horizon and particle size distribution was determined using a hydrom- eter method (Bouyoucos, 1936). The available water-hold- ing capacity was estimated from soil texture and depth of soil (Anon., 1968). Elevation, slope, microrelief, location on the slope and aspect were recorded for each macroplot.
Stems of each shrub species were collected and ring widths from ten shrubs of each species were measured for every macroplot. Shrub rings measured were those from shrubs that had 25 to 35 growth rings. After sanding and polishing the cross sections, ring widths were measured to the nearest 0.01 mm with a Craighead-Douglas dendrochronograph. Ring widths were measured along two radii on each cross-section and averaged for each year. Shrub cross-sections were col- lected again the second year when the macroplots were clipped for production.
All growth rings were compared with the known annual rings of big sagebrush to determine if any correlation ex- isted. A close correlation might suggest that the rings from species other than big sagebrush were annual rings.
Results and Discussion
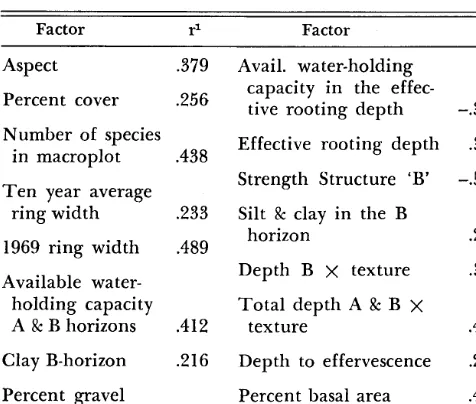
To determine the effect of all of the factors on the production within 50 macroplots, each of 60 soil and floristic factors were correlated with all of the remaining factors for all macroplots (Table 1). Using a step-wise regression program (Dixon, 1970), those variables with the highest partial correlation coefficients with production were combined to create a multiple regression equation having the least possible standard error. Even though some of the simple coefficients were highly significant, the most significant accounted for only 16% of the vari- ation in the annual forage production. The stan- dard error of the resulting equation was 25% of the mean and too large to estimate forage production.
Table 1. Correlation coefficients of floristic and soil fac- tors in Hot Creek Valley which in 1969 were significantly correlated with forage production.
Factor r1 Factor r
Aspect .379
Percent cover .256
Number of species
in macroplot .438
Ten year average
ring width .233
1969 ring width .489
Available water- holding capacity A & B horizons .412
Clay B-horizon .216
Percent gravel
A Pe B horizons -.271
Avail. water-holding capacity in the effec- tive rooting depth
Effective rooting depth
Strength Structure ‘B’
Silt & clay in the B horizon
Depth B x texture
Total depth A & B x texture
Depth to effervescence
Percent basal area
-.387
.340
-.554
.235
.390
.425
.218
.430
1 Significance of the correlation coefficients. r = .211 P < .l
r = .250 P < .05 r = .324 P < .Ol
late poorly because spiny hopsage [Gruyia spinosa (Hook.) Moq.], big sagebrush, bud sagebrush (Artemisia spinescens D.C. Eat.), and shadscale are grouped together as one variable. This grouping was necessary because none of the shrubs are found on all of the macroplots. Big sagebrush, which is the most widely distributed shrub, is located on only one-third of the macroplots.
There was no correlation between ring widths of big sagebrush and those species belonging to the
Chenopodiaceae. Evidence suggests that these spe- cies may not produce annual rings (Eames and
MacDaniels, 1925; Plummer”). The ring widths on the cheopods were complacent. Ring width differ- ences within a site normally varied no more than 20 percent. However, from site to site there was as much as 600% difference. Thus, we feel that even though the ring widths may not necessarily be annual increments, they definitely reflect site differences.
To reduce the variance, the macroplots were grouped into five plant associations (Table 2) and analyzed with an all-possible correlation analysis followed by the step-wise regression. Shrub rings accounted for an average of 90% of the reduction in the standard error. Therefore, the estimation equations could be greatly simplified, without re- ducing their precision significantly, if ring widths only were used as the independent variable. Then simple linear and curvilinear regressions were cal- culated with production as the dependent variable.
The relationship between production and width of big sagebrush and shadscale growth rings appear to be exponential. The highest correlation coeffi- cient was obtained by relating the logarithms of both production and ring width (Fig. 1). The confidence belt shown is for the mean and not for individual ring width observations. Figure 2 illustrates examples of shrub rings used in esti- mating production.
In contrast, linear equations adequately describe the relation between yield and ring widths of win- terfat, spiny hopsage, and bud sagebrush. This
4 Personal communications with A. Perry Plummer, 1971.
Table 2. Production estimation equations for Hot Creek Valley with ring widths of shrubs as the independent variables.
Significance
Shrubs Location Equation r and r” level
Winterfat All plant associations where
found1
Shadscale Atco Hija plant associations
Bud sagebrush Atco Hija plant associations Y = 756.43 + 39.33X,
Spiny hopsage All plant associations where found1
Big sagebrush Artr Hija plant associations
Big sagebrush Artr Grsp Orhy associations
Y = 1620X, - 129.22
Log Y = Log(X,)1.454 + 3.45 Y = 2795x1.454
Y = 1328.69 - 76.41X,
Log Y = Log(X,)1.5196 + 2.15 Y = 346X11=96
Log Y = Log(X,)1.55 + 2.55 Y = 354x11.55
r = .939 r2 = .882
.OOl level
r = .933 rz = . 870
.OOl level
r = .615 r- o = .378
.Ol level
r = .832 r-2 = . 693
.OOl level
r = .823 r-3 = . 678 r = .972 r2 = .945
.OOl level
.OOl level
l Five plant associations were defined in this study: used are: Atco = shadscale, Hija =
Atco Hija, Artr Hija, Artr Grsp Orhy, Chvi Hija, and Eula Atco Hagl. Symbols
grass (Oryzo~sis hymenoides), Chvi
galleta (Hilaria jamesii), Artr = big sagebrush, Grsp = spiny hopsage, Orhy = Indian rice-
(Halogeton glomeratus).
regression probably represents only a linear portion of the complete curve (Fig. 1).
The method used to derive estimation equations could possibly be extended to other plant associa-
tions in the Intermountain Region. To eliminate the problem caused by younger plants with larger rings, individual ring widths should be standardized by dividing each ring width by the average ring width of that particular plant. The widths then would be expressed as a percentage of the average width. Production of a site should then be ex- pressed as a percentage of the site’s average annual production. This method of converting production was done by Sneva and Hyder (1962) and the con- verted values are referred to as yield indices. Yield indices for range sites from whuzh the shrubs were collected are then plotted against the standardized ring widths. The sampling could be continued until the standard error is reduced to the satisfac- tion of the resource manager. On big sagebrush sites approximately 50 ring widths were needed to reduce the standard error to 10% of the average production. Once a sufficient number of sites have been sampled, a single regression equation may be computed to obtain a production estimation equation for that particular shrub and within the area sampled. This would be meaningful only for plants such as big sagebrush that have sensitive ring widths.
The past average estimated production for a site with big sagebrush or other species with sensitive growth ring series could be determined as far back in time as there are annual rings of the sample shrub. This offers an excellent opportunity for ob- taining 5, 10, or 15 year average production for a particular site. For a shrub to be useful in esti- mating yield, unless it occurs as a pure stand, its period of growth must coincide with those species that contribute to all or most of the production within the association.
Literature Cited
ANONYMOUS. 1968. Guides for calculating available water- holding capacity. Soil Conserv. Serv., U.S. Dep. Agr., Berkeley, Calif. Tech. Note No. 15. 1 p.
BLAISDELL, J. P. 1958. Seasonal development and yield of native plants on the upper Snake River and their re- lationship to certain climate factors. U.S. Dep. Agr. Tech. Bull. 1190. 30 p.
BOUYOUCOS, G. J. 1936. Directions for making mechanical analysis of soils by the hydrometer method. Soil Sci. 42: 225-230.
CARMEAN, W. H. 1954. Site quality for douglas-fir in southwestern Washington and its relationships to pre- cipitation, elevation, and physical soil properties. Soil Sci. Sot. Amer. Pro. 18:330-334.
DIEHERT, R. A. 1938. The morphology of Artcmisia trident&z. Nutt. Lloydia 1: 3-74.
DIXON, W. J. 1970. Stepwise regression, BMD Biomedical Computer Programs, Univ. of Calif. Publications in Auto- matic Computation. p. 233-257.
DOOLITTLE, W. I. 1957. Site index of scarlet and black oak
in relation to southern Appalachian soil and topography. Forest Sci. 3: 114-124.
EAMES, A. J., AND MACDANIELS, L. H. 1925. An introduc- tion to plant anatomy. McGraw-Hill Book Co., New York. 364 p.
FERGUSON, C. W. 1964. Annual rings in big sagebrush. Papers of the Laboratory of Tree-Ring Research No. 1. The Univ. of Ariz. Press, New York. 95 p.
GOEBEL, C. J., LEONARD DEBANO, AND RUSSEL D. LLOYD. 1958. A new method of determining forage cover and production on desert shrub vegetation. J. Range Manage. 11: 244-246.
HULETT, G. K., AND G. W. TOMANEK. 1969. Forage pro- duction on a clay upland range site in western Kansas. J. Range Manage. 22:270-276.
HUNT, CHARLES B. 1967. Physiography of the United States. W. H. Freeman and Co., San Francisco. 430 p. KINSINGER, F. R., AND G. S. STRICKLER. 1961. Correlation
of production with growth and ground cover of whitesage. J. Range Manage. 29: 161-166.
MASON, L. R., AND S. S. HUTCHINGS. 1967. Estimating foliage yields on Utah juniper from measurements of crown diameter. J. Range Manage. 20:161-166.
MEDIN, D. E. 1960. Physical site factors influencing an- nual production of true mountain mahogany (Cercocarpus
montunus). Ecology 41:454460.
MCGINNIES, W. J. 1967. Correlation between annual rings of woody plants and herbage production. J. Range Manage. 20:4245.
SNEVA, F. A., AND D. N. HYDER. 1962. Estimating herbage production on semi arid ranges in the Inter-mountain region. J. Range Manage. 15:88-93.
TOWER, J. 1970. Vegetation stagnation in three-phase big game exclosures and its effect in determining forage utili- zation. M. S. Thesis; (unpublished). 65 p.
THESIS: UNIVERSITY OF WYOMING
Size, Density, Growth Rate and Age of Rocky Mountain Juniper and Interrelationships with Environmental Factors, by Carl L. Wambolt. M.S., Range management.
An investigation was made of three Rocky Mountain Juniper (Juniperus scopulorum Sarg.) communities in the Big Horn Basin of north-central Wyoming. Each of the study sites was chosen to exhibit an age gradation o,f the juniper trees so that the sites could be further subdivided into age zones. Juniper size and form were used as criteria on which to base age differences between zones. This was done so that the various age zones could be compared to one another on the basis of any differences or similarities found in this investigation. Data were collected on vegeta- tion, soils and other site characteristics.
The only study site with a northerly exposure had a slower juniper crown diameter growth rate in all three age zones than did the other two sites but it only had a slower growth rate in height in the mature age zone. A strong cor-
1968.