P R O C E E D I N G S
Open Access
Using a Bayesian latent variable approach to
detect pleiotropy in the Genetic Analysis
Workshop 18 data
Lizhen Xu
1, Radu V Craiu
1, Andriy Derkach
1, Andrew D Paterson
2,3, Lei Sun
3,1*From
Genetic Analysis Workshop 18
Stevenson, WA, USA. 13-17 October 2012
Abstract
Pleiotropy, which occurs when a single genetic factor influences multiple phenotypes, is present in many genetic studies of complex human traits. Longitudinal family data, such as the Genetic Analysis Workshop 18 data, combine the features of longitudinal studies in individuals and cross-sectional studies in families, thus providing richer information about the genetic and environmental factors associated with the trait of interest. We recently proposed a Bayesian latent variable methodology for the study of pleiotropy, in the presence of longitudinal and family correlation. The purpose of this work is to evaluate the Bayesian latent variable method in a real data setting using the Genetic Analysis Workshop 18 blood pressure phenotypes and sequenced genotype data. To detect single-nucleotide polymorphisms with pleiotropic effect on both diastolic and systolic blood pressure, we focused on a set of 6 single-nucleotide polymorphisms from chromosome 3 that was reported in the literature to be significantly associated with either diastolic blood pressure or the binary hypertension trait. Our analysis suggests that both diastolic blood pressure and systolic blood pressure are associated with the latent hypertension severity variable, but the analysis did not find any of the 6 single-nucleotide polymorphisms to have statistically significant pleiotropic effect on both diastolic blood pressure and systolic blood pressure.
Background
Abundant pleiotropy has been reported for complex human traits [1]. However, few current genetic studies formally investigate pleiotropy, because of the analytical difficulties in modeling the inherent data complexity. Challenging aspects include the different types of phe-notype of interest (continuous, discrete, or both) and various correlations present in the data (between the phenotypes of interest, between individuals if family data are collected, and between measurements over time if longitudinal data are collected).
There have been some recent developments in meth-ods proposed for joint analysis of multiple phenotypes. For example, Weller et al [2] applied principal compo-nent analysis to multiple traits to obtain independent
canonical variables and then conducted univariate quan-titative trait locus (QTL) analyses. Lange and Whittaker [3] developed a QTL-mapping method based on general-ized estimating equations. Xu et al [4] extended the stan-dard linear combination test to incorporate data-driven weighting factors. Nicolae et al [5] studied the correlation between 2 quantitative traits stratified by genotype. Borecki et al [6] investigated the percentage of trait cor-relation explained by a marker of interest. O’Reilly et al [7] reversed the role of phenotype and genotype so that the genotype is treated as the response variable. Li et al [23] modified the approach of O’Reilly et al [7] and pro-posed a likelihood ratio test that compares a full model with 2 phenotypes of interest with a nested model. How-ever, these methods were proposed primarily for studies of quantitative traits with cross-sectional data in unre-lated individuals.
Longitudinal family data, such as Genetic Analysis Workshop 18 (GAW18), combine the features of * Correspondence: [email protected]
3
Division of Biostatistics, Dalla Lana School of Public Health, University of Toronto, Ontario M5S 3G3, Canada
Full list of author information is available at the end of the article
longitudinal studies in independent individuals and stu-dies using families. Therefore, they provide more infor-mation about the genetic and environmental factors associated with the trait of interest than cross-sectional studies [8]. However, joint modeling of multiple pheno-types using longitudinal family data involves nontrivial analytical challenges because of the complex phenotypic, familial, and serial correlations.
We recently proposed to use the latent variable (LV) methodology for study of pleiotropy, in the presence of longitudinal and family correlation [9]. The LV metho-dology has been widely used in many scientific fields, including economics, psychology, and social sciences, and it is becoming increasingly attractive for genetic stu-dies. For example, Ohara et al [10] proposed a LV approach for the analysis of multivariate quantitative trait loci; Tayo et al [11] applied a factor analysis (a subtype of the LV model [LVM]) to find latent common genetic components of obesity traits; and Nock et al [12] used factor analysis for a metabolic syndrome study. Initial applications of LVM focused on reducing the number of manifest variables to a smaller number of latent out-comes. Sammel and Ryan [13,14] extended the LVM to allow covariates to have effects on both the manifest and LVs. Roy and Lin [15] discussed a LV approach for longi-tudinal data with continuous outcomes. Xu et al [9] extended the work of Roy and Lin [15] to accommodate both binary and continuous phenotypes and family data, and proposed a Bayesian approach for parameter estima-tion. The focus of this work is to evaluate the Bayesian LV method of Xu et al [9] in a real data setting using the GAW18 blood pressure phenotype data and sequenced genotype data.
Methods
The latent variable model
Here we briefly review the LV methodology proposed by Xu et al [9]. The formulation of the LVM relies on pos-tulating the effect of a random variable that is not observed by the researchers but is assumed to play an important role in various observed variables (also known as the manifest variables), and thus induces cor-relations among them [16]. In the context of pleiotropy studies, the manifest variables are the multiple observed phenotypes, which inform the LV that represents the underlying conceptual disease status or severity. The proposed LVM consists of 2 parts. The first part models the relationship between the manifest variables (Ys) and the LV (U) to characterize the within-subject correlation among different outcomes. The second part uses a linear mixed-effect model to investigate the effect of a genetic marker and other covariates (X s) on the LV (U), accounting for the longitudinal and familial correlations.
Formally, letYcit = (ycit1,. . .,ycitJ)be the J × 1 vector of responses (eg, phenotypes) measured at the tthtime on theithindividual from the cthfamily (or cluster) for i= 1, 2,. . .,Nc, i= 1, 2,. . .,Nc, t= 1, 2,. . .,Tci, where C denotes the total number of families,Nc is the number
of individuals within thecthfamily,Tciis the total
num-ber of repeated measurements for the individual {c, i} and J is the total number of responses. Among the J responses, Ycitc = (yccit1,· · ·,yccitJ1) are the continuous responses and Ycitb = (ycitJb 1+1,· · ·,ycitJb ) are the binary responses. LetUcitbe the LV representing the
concep-tual disease severity, which summarizes the partial infor-mation brought by each of theJphenotypes.
The first part of the LVM models the relationship between the phenotypes (Ys) and the LV (U) to charac-terize the within-subject correlation among the different outcomes. A continuous phenotype is linked to the latent traitUcit via a linear mixed model
yccitj=β0j+WcitTβj+λjUcit+bcij+ecitj (2:1)
whereecitjiid∼N(0,σj2),Wcitis a p1-dimensional vector
of direct effect covariates,β0jis the mean effect of phe-notypej, andλjis the factor loading that represents the effect of the LV on the phenotype. The random compo-nentbcijcaptures the family-specific within-subject
cor-relations over time. We assumebcijiid∼N(0,τj2), and ecitj
and bcij are mutually independent. If a phenotype is
bin-ary, a generalized linear mixed model,
ηcitj=β0j+WcitTβj+λjUcit+ecitj (2:2)
is assumed with a probit link,
E[ycitjb |Ucit,bcij] =p(ybcitj= 1|Ucit,bcij) =(ηcitj) (2:3)
We choose a probit link instead of a logit link to gain computational efficiency.
The second part of the LVM models the influence of indirect covariates on the LV via the linear mixed model,
Ucit=XTcitα+ac+dci+εcit (2:4)
wherecit∼iidN(0, 1),ac anddciare the random effects
to model correlations of the LV Ucit among subjects
within a family and the dependency between repeated measures ofUcit, withac∼N(0,σa2), anddci∼N(0,σd2). Xcit is a p2-dimensional vector of covariates that can
interest. Particularly, if a single-nucleotide polymorph-ism (SNP) included inX is found to be statistically asso-ciated withU, the SNP is deemed to be pleiotropic. For the purpose of model identification, we assume that the 2 sets of covariatesXandWare disjoint.
Parameter estimation via Bayesian method
Xu et al [9] considered a Bayesian estimation for the LVM parameters to allow a principled approach to incor-porate prior information, which can be substantial in many practical genetic studies, and to produce finite sample likelihood-based inference. The data in the pro-posed LVM contain the observed continuous and binary outcomesY, the covariatesWwith direct effect onY, and the covariatesXwith indirect effect onYviaU. The para-meter of interest is= (β0,β,α,λ,τ2,σ2,σa2,σd2)where β= (β
1,. . .,βJ), β= (β1,. . .,βJ), βj= (βj1,. . .,βjp1)
λ= (λ1,. . .,λJ), λ= (λ1,. . .,λJ),τ2= (τ12,· · ·,τJ2)and σ2= (σ2
1,· · ·,σJ21)
. The posterior distribution for the
model parameters is:p(|Y,W,X)∝P()p(Y|,W,X) Markov chain Monte Carlo (MCMC) algorithms are used to draw posterior samples for statistical inference. In addition, the data augmentation principle of Tanner and Wong [17] and the parameter expansion and hierarchical centering techniques of Gelfand [18], Liu and Wu [19], and Meng and van Dyk [20] are applied to speed up the MCMC’s mixing. Uninformative conjugate priors are given to the parameters in the expanded model. Bayes factors (BFs) calculated using the path sampling method are used to test the significance of factor loadings and the fixed effects. The support for the alternative hypothesis of pleiotropy is detected if log BF > 0.5 [9].
Data analysis
The phenotypes of interest are diastolic blood pressure (DBP) and systolic blood pressure (SBP). We considered 464 individuals from the 16 families (Type 2 Diabetes Genetic Exploration by Next-generation sequencing in Ethnic Samples [T2D-GENES] Project 2) that were sequenced. Among the 464 individuals, 396 individuals have at least 1 blood pressure measure (90 have only 1, 78 have 2, 131 have 3, and 97 have 4 measurements). The length of time between 2 consecutive measurements ranges from 3 to 9 years, and the number of family mem-bers varies from 11 to 36. For the phenotypes of interest, we added a value of 15 to SBP and a value of 10 to DBP for those individuals who took antihypertensive medica-tion [21]. Among the available covariates–age, sex, antihy-pertensive medications, and tobacco smoking status–we included age and sex in our analysis.
To detect SNPs with pleiotropy effect, we focused on a set of 6 SNPs from chromosome 3 (rs9816772, rs9852991, rs6768438, rs9815354, rs7640747 and rs743395) that had
been reported to be significantly associated with either DBP or the binary hypertension trait, based on a large-scale genome-wide association study of blood pressure and hypertension under an additive genetic model assumption [22]. Table 1 summarizes the results that were reported in Levy et al [22]. It shows that 4 SNPs (rs9816772, rs9852991, rs6768438, and rs9815354) were found to be significantly associated with DBP but not with SBP nor with the binary hypertension trait. Note that the 4 SNPs are near the geneULK4, close to each other, and likely to be in strong linkage disequilibrium (LD). There-fore their statistical association results are expected to be similar. The other 2 SNPs (rs7640747 and rs743395) were found to be significantly associated with hypertension, but only suggestively with SBP or DBP. These 2 SNPs are also close to each other in high LD and near ITGA9.
We then applied the Bayesian LVM method to analyze 1 SNP at a time, assuming an additive genetic model. For each SNP of interest, the phenotypes Ys are SBP and DBP, the covariates include the genotype of the SNP, age, and sex, and the continuous LVUrepresents the conceptual hypertension severity level. We began our analysis by considering all possible models that include the 3 covariates, where each covariate has either direct effects on the phenotypes Ys or indirect effect throughU. Table 2 gives the deviance information cri-teria statistics of these models and model 5 (covariate Sex is included in Equation (2.1) with direct effect on the phenotypes and Age and SNP in Equation (2.4) with indirect effect on the phenotypes via the LV) has smal-lest deviance information criteria (DIC) value. Thus, we used model 5 to fit the data. We then applied the BF method to further determine whether the effects of these chosen covariates are statistical significant. The folded-t prior with 3 degrees of freedom is used forλj, Np1(0,Ip1)is used forβj, and Np2(0, Ip2)is used for a. For comparison, we also report the highest posterior density interval (HpdI) for testing the factor loadings and the fixed effects.
Table 1 Genome-wide association result for the 6 SNPs reported by Levy et al [22]
pValues
SNP Gene MAF DBP SBP Hypertension
rs9816772 ULK4 0.16 9.7 × 10⁻⁷ 0.5 0.85 rs9852991 ULK4 0.16 9.7 × 10⁻⁷ 0.59 0.85 rs6768438 ULK4 0.16 9.7 × 10⁻⁷ 0.59 0.84 rs9815354 ULK4 0.17 7.8 × 10⁻⁷ 0.69 0.83 rs7640747 ITGA9 0.38 9.5 × 10⁻⁴ 5.9 × 10⁻⁴ 4.8 × 10⁻⁷ rs743395 ITGA9 0.38 4.4 × 10⁻⁴ 8.0 × 10⁻⁴ 7.5 × 10⁻⁷
Results
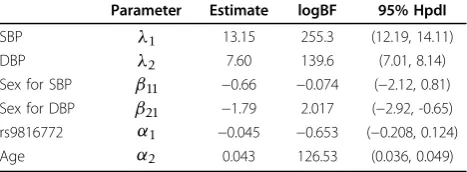
Based on the results shown in Table 3, both SBP and DBP are associated with the latent hypertension severity variable with the factor loading for SBP being 13.15 and for DBP being 7.60, which are all significantly larger than zero. Furthermore, the sizes of the 2 factor load-ings suggest that the strength of the relationship between SBP and the LV is about 1.7 times greater than that between DBP and the LV. Sex shows no significant association with SBP, with the logarithm of Bayes factor (logBF) being negative, and the 95% HpdI covering zero. However, it has significant negative effect on DBP, indi-cating that females have lower DBP than males. Age appears to have a significant positive effect on the underlying hypertension severity variable with logBF equaling 126.53. There is no evidence that rs9816772 is significantly associated with the LV, with the logBF being less than zero and the 95% HpdI fora1, the coef-ficient for the SNP, covering zero. Results for other SNPs are characteristically similar to what’s reported here for rs9816772. Therefore, our analysis did not detect a pleiotropy effect on both DBP and SBP for any of the 6 SNPs that were previously reported to be asso-ciated with DBP or the binary hypertension trait.
Discussion and conclusions
In this paper, we investigated the Bayesian LV metho-dology recently proposed by our group to joint model multiple phenotypes, in the presence of serial and famil-ial correlations [9]. The proposed method provides a conceptually easy but effective way to jointly study mul-tiple correlated phenotypes, which could be a mixture of continuous and binary outcomes with serial and familial correlations. These multiple outcomes are assumed to be related to a LV, which can be interpreted as the latent disease severity. As a by-product of our MCMC algorithm, the method provides subject-specific estimate of the LV, which can be used for further analysis. The 2-level modeling scheme allows us to estimate and test the global effects of the covariates on the multiple out-comes, which are more efficient than the traditionally used multiple tests [15].
We applied this method to the GAW18 data, jointly analysing SBP and DBP. A LV Uis introduced to char-acterize the within-subject correlation between the 2 phenotypes and can be interpreted as the underlying hypertension severity variable. Pleiotropy is detected if a genetic marker is found to have a significant effect on U. To detect SNPs with pleiotropic effect on SBP and DBP, we investigated a set of 6 SNPs from chromosome 3 that were previously shown to be significantly asso-ciated with either DBP or the hypertension trait. How-ever, we did not see statistically significance evidence for pleiotropy effect for any of the 6 SNPs.
The incorporation of family-specific random effectac
in equation (2.4) allows us to model the familial correla-tion of the underlying disease trait. However, this for-mulation does not take into account the different degrees of genetic relationship among the individuals within a family. Thus, alternative models incorporating the kinship matrix will be considered in the future. Our future work also includes developing alternative models that adjust for the unequally spaced time measurements, and more efficient algorithms so that a genome-wide search for pleiotropic SNPs can be performed. (The
Table 2 Goodness-of-fit statistics for alternative latent variable models applied to rs9816772
Model Covariates DIC
With phenotypesYs in Equation (2.1) With latent variableUin Equation (2.4)
1 Age+sex+SNP N/A 15388.7
2 Age+sex SNP 15729.3
3 Age+SNP Sex 15746.5
4 Sex+SNP Age 15820.6
5 Sex Age+SNP 15226.5
6 SNP Age+sex 15247.9
7 Age Sex+SNP 15744.0
8 N/A Age+sex+SNP 15948.3
DIC, deviance information criteria.
Table 3 Results of the Bayesian LV method applied to rs9816772, previously identified as associated with DBP
Parameter Estimate logBF 95% HpdI
SBP λ1 13.15 255.3 (12.19, 14.11)
DBP λ2 7.60 139.6 (7.01, 8.14)
Sex for SBP β11 −0.66 −0.074 (−2.12, 0.81)
Sex for DBP β21 −1.79 2.017 (−2.92, -0.65)
rs9816772 α1 −0.045 −0.653 (−0.208, 0.124)
Age α2 0.043 126.53 (0.036, 0.049)
λjis the factor loading for the association between phenotypeYj(j= 1, 2:
SBP and DBP) and the conceptual latent variableU,βjkevaluates the association between phenotypeYjand covariateWk(k= 1: sex),αkcaptures
the association between the latent variableUand covariateXk(k= 1, 2: SNP
current computation time is about 1.7 minutes per SNP.) Evaluating the performance of the Bayesian LVM method using the simulated data, and extension of the method to joint analysis of multiple rare variants are also of interest.
Competing interests
The authors declare that they have no competing interests.
Authors’contributions
Study design: LX, RVC, ADP, and LS. Analysis: LX and AD. Manuscript drafting: LX and LS. All authors read and approved the final manuscript.
Acknowledgements
This work was supported by the Natural Sciences and Engineering Research Council of Canada (NSERC) to LS, NSERC to VRC, the Canadian Institutes of Health Research (CIHR) to VRC and LS, the Ontario Graduate Scholarship (OGS) to LX, and the OGS and the CIHR Strategic Training for Advanced Genetic Epidemiology (STAGE) fellowship to AD, University of Toronto. ADP holds a Canada Research Chair in the Genetics of Complex Diseases. The GAW18 whole genome sequence data were provided by the T2D-GENES Consortium, which is supported by NIH grants U01 DK085524, U01 DK085584, U01 DK085501, U01 DK085526, and U01 DK085545. The other genetic and phenotypic data for GAW18 were provided by the San Antonio Family Heart Study and San Antonio Family Diabetes/Gallbladder Study, which are supported by NIH grants P01 HL045222, R01 DK047482, and R01 DK053889. The Genetic Analysis Workshop is supported by NIH grant R01 GM031575.
This article has been published as part ofBMC ProceedingsVolume 8 Supplement 1, 2014: Genetic Analysis Workshop 18. The full contents of the supplement are available online at http://www.biomedcentral.com/bmcproc/ supplements/8/S1. Publication charges for this supplement were funded by the Texas Biomedical Research Institute.
Authors’details
1
Department of Statistical Sciences, University of Toronto, Toronto, Ontario M5S 3G3, Canada.2Program in Genetics and Genome Biology, The Hospital for Sick Children, Toronto M5G 1X8, Canada.3Division of Biostatistics, Dalla Lana School of Public Health, University of Toronto, Ontario M5S 3G3, Canada.
Published: 17 June 2014
References
1. Sivakumaran S, Agakov F, Theodoratou E, Prendergast JG, Zgaga L, Manolio T, Rudan I, McKeigue P, Wilson JF, Campbell H:Abundant pleiotropy in human complex diseases and traits.Am J Hum Genet2011,
89:607-618.
2. Weller JI, Wiggans GR, VanRaden PM, Ron M:Application of canonical transformation to detection of quantitative trait loci with the aid of genetic markers in a multitrait experiment.Theor Appl Genet1996,
92:998-1002.
3. Lange C, Whittaker JC:Mapping quantitative trait loci using generalized estimating equations.Genetics2001,159:1325-1337.
4. Xu X, Lu T, Wei LJ:Combining dependent tests for linkage or association across multiple phenotypic traits.Biostatistics2003,4:223-229.
5. Nicolae D, Kistner E, Cox N:Testing for pleiotropy in quantitative traits using data from genome-wide association studies.The 59th annual meeting of the American Society of Human Genetics, Honolulu, HI USA; 2009, Abstract number 181. October 20-24.
6. Borecki I, Zhang Q, Province M:Detection and dissection of pleiotropy for complex multivariate traits.The annual meeting of the International Genetic Epidemiology Society; 2011, Abstract number 19.
7. O’Reilly PF, Hoggart CJ, Pomyen Y, Calboli PFC, Elliott P, Jarvelin MR, Coin LJ:Multiphen: joint model of multiple phenotypes can increases discovery in GWAS.PLoS One2012,7:e34861.
8. Burton P, Scurrah K, Tobin MD, Palmer L:Covariance components models for longitudinal family data.Int J Epidemiol2005,34:1063-1067.
9. Xu L, Craiu V, Sun L, Paterson A:Bayesian latent variable modelling of longitudinal family data for genetic pleiotropy studies.Cornell University Library; 2012, arXiv:1211.1405 [stat.AP].
10. O’Hara RB, Komulainen P, Savolainen O, Sillanpää MJ:A latent variable approach to multivariate quantitative trait loci.Nature Precedings2010 [http://hdl.handle.net/10101/npre.2010.4137.1], Available from. 11. Tayo B, Harders R, Luke A, Zhu X, Cooper R:Latent common genetic
components of obesity traits.Int J Obes (Lond)2008,32:1799-1806. 12. Nock NL, Wang X, Thompson CL, Song Y, Baechle D, Raska P, Stein CM,
Gray-McGuirel C:Defining genetic determinants of the metabolic syndrome in the Framingham Heart Study using association and structural equation modeling methods.BMC Proc2009,3(Suppl 7):S50. 13. Sammel MD, Ryan LM:Latent variable models with fixed effects.
Biometrics1996,52:650-663.
14. Sammel MD, Ryan LM:Latent variable models for mixed discrete and continuous outcomes.J R Stat Soc Series B Stat Methodol1997,59:667-678. 15. Roy J, Lin X:Latent variable models for longitudinal data with multiple
continuous outcomes.Biometrics2000,56:1047-1054.
16. Bartholomew D, Knott M, Moustaki I:Latent Variable Models and Factor Analysis: A Unified Approach.Wiley Series in Probability and Statistics.John Wiley & Sons;, 3 2011.
17. Tanner M, Wong W:The calculation of posterior distributions by data augmentation.J Am Stat Assoc1987,82:528-540.
18. Gelfand AE:Efficient parametrisations for normal linear mixed models.
Biometrika1995,82:479-488.
19. Liu JS, Wu YN:Parameter expansion for data augmentation.J Am Stat Assoc1999,94:1264-1274.
20. Meng X-L, van Dyk D:Seeking efficient data augmentation schemes via conditional and marginal augmentation.Biometrika1999,86:301-320. 21. Tobin MD, Sheehan NA, Scurrah KJ, Burton PR:Latent common genetic
components of obesity traits.Stat Med2005,24:2911-2935.
22. Levy D, Ehret GB, Rice K, Verwoert GC, Launer LJ, Dehghan A, Glazer NL, Morrison AC, Johnson AD, Aspelund T,et al:Genome-wide association study of blood pressure and hypertension.Nat Genet2009,41:677-687. 23. Li W, Soave D, Miller MR, Keenan K, Fan L, Gong J, Chiang T,
Stephenson AL, Durie P, Rommens J, Sun L, Strug LJ:Unraveling the complex genetic model for cystic fibrosis: pleiotropic effects of modifier genes on early cystic fibrosis-related morbidities.Hum Genet2103 [http:// www.ncbi.nlm.nih.gov/pubmed/24057835], Epub ahead of print.
doi:10.1186/1753-6561-8-S1-S77
Cite this article as:Xuet al.:Using a Bayesian latent variable approach to detect pleiotropy in the Genetic Analysis Workshop 18 data.BMC Proceedings20148(Suppl 1):S77.
Submit your next manuscript to BioMed Central and take full advantage of:
• Convenient online submission
• Thorough peer review
• No space constraints or color figure charges
• Immediate publication on acceptance
• Inclusion in PubMed, CAS, Scopus and Google Scholar
• Research which is freely available for redistribution
![Table 1 Genome-wide association result for the 6 SNPsreported by Levy et al [22]](https://thumb-us.123doks.com/thumbv2/123dok_us/865276.1103764/3.595.306.541.614.713/table-genome-wide-association-result-snpsreported-levy-et.webp)