P R O C E E D I N G S
Open Access
Adjusting for population stratification and
relatedness with sequencing data
Yiwei Zhang
*, Wei Pan
From
Genetic Analysis Workshop 18
Stevenson, WA, USA. 13-17 October 2012
Abstract
To avoid inflated type I error and reduced power in genetic association studies, it is necessary to adjust properly for population stratification and known/unknown subject relatedness. It would be interesting to compare the performance of a principal component-based approach with a linear mixed model. Furthermore, with the availability of genome-wide sequencing data, the question of whether it is preferable to use common variants or rare variants for such an adjustment remains largely unknown. In this paper, we use the Genetic Analysis Workshop 18 data to empirically investigate these issues. We consider both a quantitative trait and a binary trait.
Background
In genetic association studies, population stratification and known or cryptic relatedness are always issues. If not sui-tably accounted for, these may cause inflated type I errors and reduced power. A popular approach to adjusting for population stratification is to construct principal compo-nents (PCs) from some similarity matrix for the samples and to include the PCs as covariates in a regression model [1]. This is referred to as a PC-based approach. However, it is thought that these approaches“do not model family structure or cryptic relatedness”[2]. A more general, and perhaps more powerful, approach is to apply linear mixed models (LMMs) to account for both population stratifica-tion and relatedness [3,4]. EMMAX software [5] has facili-tated the implementation of LMM by using the identity-by-state (IBS) matrix to capture the complex correlation structure in the samples. As these methods are studied intensely in genome-wise association studies (GWAS), a natural question is how they will perform with sequencing data. It is also of interest to investigate whether common variants (CVs) with minor allele frequencies (MAFs) no less than 0.05, or rare variants (RVs) with 0< MAF < 0.01, should be used to infer the samples’genetic similarities.
In this paper, we compare the PC-based approach with LMM to determine which approach can better
control the inflation of type I error arising from corre-lated samples. The association testing is carried out for a quantitative trait and a binary trait in the Genetic Analysis Workshop 18 (GAW18) family-based sequen-cing data. For a complete comparison, we construct and consider PCs from different similarity matrices: the sam-ple covariance matrix and the IBS matrix. Finally, we discuss the best choice of variants for constructing the similarity matrix, which has been the subject of several recent studies [6-8].
Methods
In the PC-based approach, for a given similarity matrix, we obtain itsmlargest eigenvaluesljand the corresponding
eigenvectors vj for j = 1, ..., m and denote
vector of the genotype scores for 1 or more variants to be tested. We denote the method by which PCs are obtained from the IBS matrix as PCA. IBS, and the method by which PCs are obtained from the covariance matrix as PCA.V.
* Correspondence: [email protected]
Division of Biostatistics, School of Public Health, University of Minnesota, 420 Delaware Street SE, Minneapolis, MN 55455, USA
In an LMM,Y=b0+Zζ+gb+u+δ, whereY , Z, and
gare defined as above,uis the random effect for other polygenic effects andδis the residual error. It is assumed thatδ~ N(0,s2I) andu= (u1,u2,. . .,un)∼N(0,σg2K),
whereKis the IBS matrix. We use EMMAX [5] for para-meter estimation and inference.
For hypothesis testing, PCA.V and PCA.IBS adopted the Wald test and EMMAX adopted the F-test.
Results
We used the GAW18 sequencing data containing 959 individuals and 8,348,674 single nucleotide variants (SNVs) across all 11 chromosomes, among which 2,791,923 SNVs were CVs and 3,977,003 were RVs. After pruning by PLINK [9] using a sliding window of size 50, moving step of 5 andr2<5%, and filtering out those with missing call>0.05, there were 63,157 CVs left. We ran-domly selected 10,837 CVs from those to construct the similarity matrix. The IBS matrix was obtained by EMMAX, and the covariance matrix was obtained by the R functioncov()with“use = pairwise.complete.obs”to utilize the maximum number of variants.
We used the measurements of systolic blood pressure (SBP) at time point 1,SBP1, and the hypertension
diagno-sis at time point 1,HTN1. The former is a quantitative
trait and the latter is a binary trait. There are 855 samples available. Gender, smoking, and age are the covariates.
Association test with CVs
We carried out single single-nucleotide polymorphism (SNP) analysis on a set of 6228 CVs randomly selected
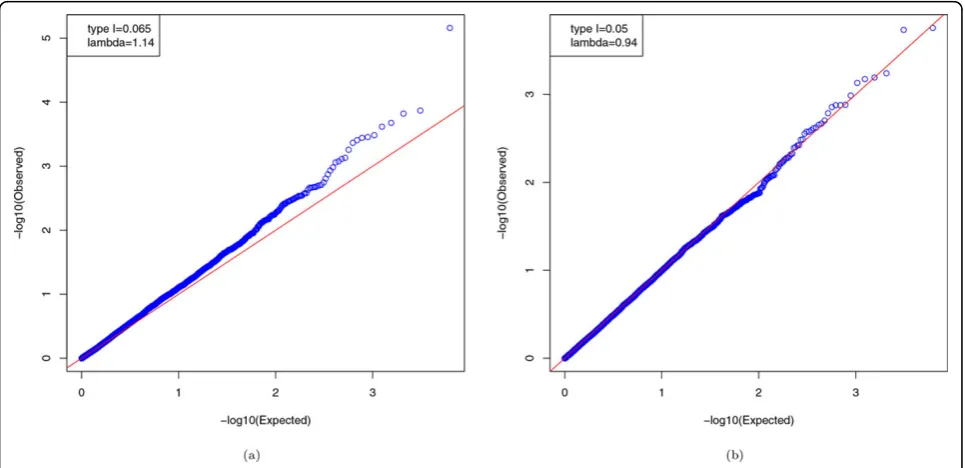
from all the pruned CVs. Based on the findings of pre-vious GWAS that most of the SNPs were not signifi-cantly associated with hypertension, we could assume these 6228 CVs were null SNPs. Because some subjects were from the same families and thus correlated, we expected to observe an inflated type I error if we treated the samples as independent. If the PC-based method or LMM was effective in adjustment, the pvalues should have followed a uniform distribution. This also meant that the proportion of the tests with p value <0.05 should be close to 0.05 and the inflation factorl close to 1; l is the inflation factor of pvalues estimated by the functiongcontrol2in R packagegap. It is calculated as the ratio of the medians of the observed and expected statistics, respectively.
Figure 1 shows that, without adjustment, forSBP1the
observedpvalues deviate from the theoretical uniform distribution (l= 1.14). ForHTN1, the observedpvalues
seem to follow the uniform distribution (l= 0.94). This observation might indicate a mild heritability in the GAW18 data set.
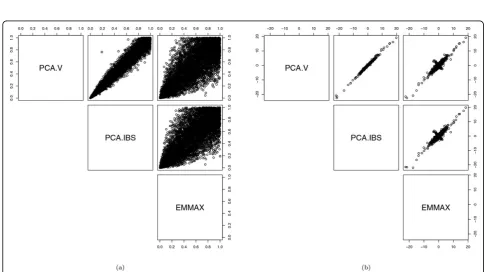
Table 1 shows the quantiles of the association mapping
p values of SBP1 with adjustment. We can see the
pvalues are almost uniformly distributed. The propor-tion of thepvalues<0.05, estimating the type I error rates, is around 0.05 and ofl’saround 1. Figure 2 shows some difference betweenpvalues obtained from the 2 PC-based models and EMMAX. There are also differ-ences in the estimated SNP effects,bˆs. However, both the pvalues and bˆs from the 3 methods are highly correlated.
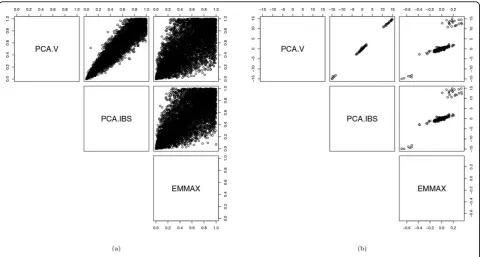
We also apply the methods to the binary traitH N1.
Table 2 shows thepvalues follow a uniform distribution after adjustment. Figure 3 shows that the correlations between the p values or bˆs from the 3 methods are weaker than those for SBP1. This contrast is partly a result of the logistic link in the PC-based models differ-ing from the identity link in the LMM.
CVs or RVs?
Lastly, we examine which type of variants, CVs or RVs, are more capable of capturing the underlying sample structure. For this purpose, we use PLINK to randomly select 11,103 variants from 1,104,098 pruned RVs to construct the covariance matrix or IBS matrix.
Table 3 shows the results of the association testing, adjusted with PCs of the new similarity matrices based on RVs. PCA.IBS does a satisfactory job of controlling type I errors and ls in testing 6228 CVs for bothSBP1
and HTN1. EMMAX is a little conservative for HTN1.
Interestingly, we can see a greater distinction between PCA.V and PCA.IBS here than in the previous results, where the similarity matrices were based on CVs. The PCA.IBS is better than the PCA.V at controlling the inflation.
Originally, the weaker performance of PCA.V based on RVs was thought to be a result of insufficient inclu-sion of PCs. Following the suggestion of Patterson et al [1], we use the Tracy-Widom test to test how many PCs
Table 1 Summary statistics ofpvalues forSBP1by PCA.V, PCA.IBS, and EMMAX. The similarity matrix is based on CVs.
Method Min. 1st. Qu. Median Mean 3rd Qu. Max. % (pval <0.05) l
PCA.V 1.106e-05 0.232 0.486 0.491 0.750 1.000 0.053 1.068
PCA.IBS 5.022e-06 0.235 0.491 0.493 0.749 1.000 0.054 1.041
EMMAX 1.42e-05 0.254 0.516 0.508 0.758 1.000 0.043 0.974
The similarity matrix is based on CVs.
Figure 2Comparison of PCA.V, PCA.IBS, and EMMAX in testing association betweenSBP1and each of 6228 SNPs
Table 2 Summary statistics ofpvalues forHTN1by PCA.V, PCA.IBS, and EMMAX
Method Min. 1st. Qu. Median Mean 3rd Qu. Max. % (pval <0.05) l
PCA.V 1.457e-04 0.239 0.489 0.494 0.748 1.000 0.055 1.054
PCA.IBS 7.044e-05 0.239 0.492 0.493 0.746 1.000 0.056 1.039
EMMAX 2.831e-04 0.259 0.510 0.507 0.761 1.000 0.048 0.977
are necessary to be considered significant [2,8]. The test shows that the top 210 PCs of the covariance matrix all have pvalues smaller than 0.05. However, we fail to obtain reasonable pvalues with 200 PCs included. This might be because the model could not be fitted, given the small sample size.
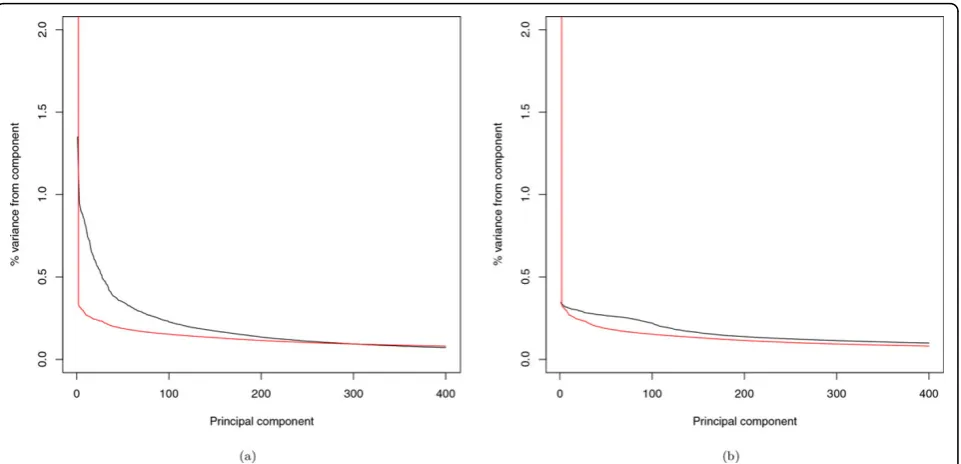
Alternatively, we turn to the scree plots (Figure 4) to explain the disparity between the use of CVs and of RVs for a similarity matrix. For the covariance matrix calcu-lated with CVs, there are 458 eigenvalues>1, with the top 25 PCs explaining 19.06% of the total variance; for the IBS matrix, there are only 32 eigenvalues>1, and the top 25 PCs explain 11.91% of the total variance. For the covariance matrix calculated with RVs, there are 433 eigenvalues>1 with the top 25 PCs explaining 7.73% of the total variance; for the IBS matrix, there is only 1 eigenvalue>1, with the top 25 PCs explaining 27.02% of the total variance. In short, when using CVs for con-structing the similarity matrix, the top 25 PCs of either type can approximate the correlation structure equally well. Although the top 25 PCs of the IBS matrix can still
preserve a large proportion of the variation, when using RVs for the similarity matrix, the counterpart of the cov-ariance matrix does a poorer job of approximation.
Conclusions
In this paper, we address 3 questions: (a) how the PC-based approach and LMM perform in controlling type I error for correlated samples; (b) whether the IBS or cov-ariance matrix should be used to generate PCs; and (c) whether CVs or RVs should be used to construct the similarity matrix. Based on the association testing of 6228 almost uncorrelated CVs from the GAW18 data, we find that PC-based models were capable of taking into account the sample correlations and worked as well as the LMM. This result is different from the claim made in Price et al [2] that PC-based models do not model family structure or cryptic relatedness. When using CVs to construct the similarity matrix, the top few PCs from the IBS matrix and the covariance matrix yield similar results. But when using RVs, the top few PCs from the IBS matrix are slightly better than those Figure 3Comparison of PCA.V, PCA.IBS, and EMMAX in testing association betweenHTN1and each of 6228 SNPs
Table 3 Results of the association tests by PCA
% (pval <0.05) l
PCA.V PCA.IBS EMMAX PCA.V PCA.IBS EMMAX
SBP1 0.068 0.052 0.052 1.121 1.050 1.054
HTN1 0.062 0.049 0.049 1.080 1.000 0.980
from the covariance matrix. LMM implemented by EMMAX is generally as effective as anticipated, although sometimes it can be conservative.
One limitation in our study was that in GAW18 data, there is no serious inflation in type I error for testing HTN1, even without any adjustment. Although our
stu-dies show a positive answer, more stustu-dies might be needed to confirm the effectiveness of a PC-based model for testing the binary trait.
Competing interests
The authors declare that they have no competing interests.
Authors’contributions
Wei Pan proposed the analysis plan, and Yiwei Zhang provided all statistical analysis and drfted the manuscript. All authors read and approved the final manuscript.
Acknowledgements
We thank the GAW18 workshop for offering us such a complete data set to practice our methods. YZ and WP were supported by National Institutes of Health grants R21DK089351, R01HL65462, R01HL105397, and R01GM081535. The GAW18 whole genome sequence data were provided by the T2D-GENES Consortium, which is supported by NIH grants U01 DK085524, U01 DK085584, U01 DK085501, U01 DK085526, and U01 DK085545. The other genetic and phenotypic data for GAW18 were provided by the San Antonio Family Heart Study and San Antonio Family Diabetes/Gallbladder Study, which are supported by NIH grants P01 HL045222, R01 DK047482, and R01 DK053889. The Genetic Analysis Workshop is supported by NIH grant R01 GM031575.
This article has been published as part ofBMC ProceedingsVolume 8 Supplement 1, 2014: Genetic Analysis Workshop 18. The full contents of the supplement are available online at http://www.biomedcentral.com/bmcproc/ supplements/8/S1. Publication charges for this supplement were funded by the Texas Biomedical Research Institute.
Published: 17 June 2014
References
1. Patterson N, Price AL, Reich D:Population structure and eigenanalysis. PLoS Genet2006,2:e190.
2. Price AL, Zaitlen NA, Reich D, Patterson N:New approaches to population stratification in genome-wide association studies.Nat Rev Genet2010, 11:459-463.
3. Yu J, Pressoir G, Briggs WH, Bi IV, Yamasaki M, Doebley JF, McMullen MD, Gaut BS, Nielsen DM, Holland JB:A unified mixed-model method for association mapping that accounts for multiple levels of relatedness.Nat Genet2005,38:203-208.
4. Zhou X, Stephens M:Genome-wide efficient mixed-model analysis for association studies.Nat Genet2012,44:821-824.
5. Kang HM, Sui JH, Zaitlen NA, Kong S, Freimer NB, Sabatti C, Eskin E: Variance component model to account for sample structure in genome-wide association studies.Nat Genet2010,42:348-354.
6. Siu H, Lin L, Xiong M:Manifold learning for human population structure studies.PLoS One2012,7:E29901.
7. Baye TM, He H, Ding L, Kurowski BG, Zhang X, Martin LJ:Population structure analysis using rare and common functional variants.BMC Proc 2011,5(Suppl 9):S8.
8. Zhang Y, Guan W, Pan W:Adjustment for population stratification via principal components in association analysis of rare variants.Genet Epidemiol2013,37:99-109.
9. Purcell S, Neale B, Todd-Brown K, Thomas L, Ferreira MAR, Bender D, Maller J, Sklar P, De Bakker PIW, Daly MJ:Plink: a tool set for whole-genome association and population-based linkage analyses.Am J Hum Genet2007,81:559-575.
doi:10.1186/1753-6561-8-S1-S42
Cite this article as:Zhang and Pan:Adjusting for population stratification and relatedness with sequencing data.BMC Proceedings
20148(Suppl 1):S42.