Denoising Using Blind Source Separation
for Pyroelectric Sensors
Regis Huez
LAM, Faculté des Sciences, Moulin de la Housse, 51687 Reims Cedex 2, France Email: regis.huez@univ-reims.fr
Danielle Nuzillard
LAM, Faculté des Sciences, Moulin de la Housse, 51687 Reims Cedex 2, France Email: danielle.nuzillard@univ-reims.fr
Alain Billat
LAM, Faculté des Sciences, Moulin de la Housse, 51687 Reims Cedex 2, France Email: alain.billat@univ-reims.fr
Received 5 December 1999 and in revised form 2 February 2001
This paper deals with a process of denoising based on a Blind Source Separation (BSS) method. This technique is inserted in an experimental device of nondestructive testing. Its excitation is a laser beam and its detectors are pyroelectric sensors. The latter are sensitive to the temperature. As they are also piezoelectric, they are particularly sensitive to the environmental noise. Therefore, it is necessary to denoise them. With this aim in view, a technique of blind source separation is implemented. One source corresponds to the incidental beam and the other sources are various noise. A judicious experimental device was designed in the laboratory. It fits to the requirements of the BSS technique, and it allows indeed a restoration of the incident signal.
Keywords and phrases:blind source separation, denoising, pyroelectric sensor, multi-sensor, laser beam, humidity profile.
1. INTRODUCTION
This paper describes the measurement of the time-dependent change in a space profile of moisture in a breadboard con-struction for nondestructive testing. The profile is defined according to the depth of a biopolymer. The change is mea-sured by photothermal methods in which a sample is optically excited by a laser diode and the heat produced is measured. The exciting wavelength was that of an absorption band of the water spectrum.
The intensity of the laser beam is modulated in frequency in order to excite sample zones at various depths. This effect is similar to the skin effect in electromagnetism. The frequencies of modulation were 0.1–400Hz, to make the penetration depths compatible with the required resolution (10µm) and the thickness of the sample (1 mm). The pyroelectric sensor placed behind the sample detects thermal waves coming from its surface. No direct contact is required [1, 2]. The sample is analysed by synchronous detection between the modulated control signal sent to the laser diode and the signal from the detector. Each frequency of modulation corresponds to a value of the gain and a value of
the phase, to give characteristic gain and phase curves. Both are representative of a moisture space profile. Their use with various physical models allows to go up to this profile [3].
1.1. The problem
Synchronous detection provides dispersed experimental measurements of phase and gain. The main causes are defects in the laser beam and the extreme sensitivity of the sensors.
1.2. The defects in the laser beam
The radiation from the laser beam is a fundamental frequency of modulation that undergoes two types of defects; its ampli-tude fluctuates in time and interfering signals are added to it.
Laser diode supply
Laser diode Focusing lens Laser beam Beam splitter Mirror
Reference sensor
Current-Voltage Converter
Measurement case with inner humidity control
Sample
Measurement sensor
Figure1: Measurement device.
also produces harmonics of the fundamental modulation fre-quency in the laser beam depending on the operating point and whose amplitude fluctuates in time. This point corre-sponds to the nonlinearity of the transfer function between the command signal of the diode and the intensity of the laser beam.
The added signals components (harmonics of the fre-quency modulation, and the 100Hz frequency) lie in the useful frequency range. Since they are not stationary, they cannot be eliminated by simple filtering.
We check the stability of the incident beam on the pre-cision of the gain and the phase before trying to remove these disturbances. We simulated a synchronous detection over20 periods between a sinusoidal signal and the same noisy sinusoid. This signal corresponds to the main fre-quency modulation. It has a signal to noise ratio (SNR) of 30 dB, similar to the disturbances of the experimental exit-ing beam (100Hz+harmonics of the excitation frequency). There were variations in the gain of1% and in the phase of 2%. Preliminary tests of a moisture space profile determi-nation showed that the resolution was to be approximately 0.1dB and 0.1◦ [3]. Thus, it is necessary to take into ac-count the real exiting beam. A second pyroelectric sensor is used as a reference, it receives part of the laser beam due to insertion of a separating blade in the device (Figure 1). As variations are included in the reference signal, they will not distort the results obtained at output of synchronous detec-tion.
The reference sensor also compensates for fluctua-tions in the amplitude of the fundamental modulation fre-quency.
1.3. The extreme sensitivity of the sensors
The second cause of dispersions is the extreme sensitivity of the sensors used. They are also piezoelectric and are partic-ularly sensitive to acoustic noises and vibrations. Their
po-sition and their keeping in the housing also influence the way in which they perceive noise. The reference and measur-ing sensors perceive noise differently, the phase and the gain characteristics at the output of synchronous detection are dis-turbed. It is thus necessary to denoise each sensor separately upstream of the synchronous detection.
1.4. The purpose of noise removal
The technique selected for noise removal was applied to process the response of the reference sensor. This principle is also applicable to the measuring sensor. We first describe the initial system without any noise removal and show that the classical techniques of noise removal are not suitable. We then describe a breadboard that includes the conditions for applying the BSS method using a double sensor. The results were analysed and the concept of using many sensors refined, such as a triple sensor. This will lead to more effective noise removal indeed and as well to a better understanding of the behaviour of the measuring device.
2. EXPERIMENTAL DEVICE
2.1. Construction of the initial reference sensor
the exiting beam (excitation frequency+harmonics+100Hz signal) will enable us to check the quality of noise re-moval.
The pyroelectric sensors perceive various types of noise:
• Thermal: changes in the temperature of the environ-ment of the experienviron-mental device.
• Vibratory: starting a motor some distance away, dis-placement in the room, vibrations inherent in the de-vice.
• Acoustic: somebody speaking in the room.
These various types of noise must all be removed. They can be in the range of the modulation frequencies used for the mea-surements. They are intrinsically not stationary (e.g., when somebody speaks) and are perceived as a function of the sur-face area of the sensor [2, 4]. They behave essentially as if they came from a single source and can be regarded as indissocia-ble. Their perception depends on the position of the sensor and the way in which it is kept in place by the sensor housing. This last point concerns especially vibrations.
2.2. Techniques of noise removal
There are two types, single-channel techniques, using only one sensor, and multiple-channel methods.
The single-channel techniques require “a priori” knowl-edge of the signal to be restored or the noise [5]. The noise is not easy to define in our application, because it is not sta-tionary. And our knowledge of the signal is incomplete. No single-channel method will be able to dissociate fluctuations in the amplitude of the fundamental modulation frequency from noise at the same frequency.
The two-channels technique with noise reference uses two sensors, whose one as noise reference [6, 7]. Their perfor-mance is improved when the signal is not present on the reference. But, it is very difficult to obtain a noise reference perfectly representative of the actual perceived noise. Their perception depends on the sensor location, and in the case of the sensor measurement, the small size of the experimental device and the constraints, such as a moisture gradient make it difficult to insert a second sensor. Lastly, the keeping in the sensor housing is specific to each one, the two sensors will not perceive vibration noises identically. These conven-tional methods of noise removal cannot, therefore, be used. However, the multiple-channel techniques of BSS can be used [8, 9, 10].
2.3. Blind source separation
In the case of two statistically independent sources and two sensors, the first sources1 will be the incident signal from the laser diode, the second sources2will be the main distur-bance and others weaker disturdistur-bances will be considered as the sensor noise [11]. The BSS techniques suppose that the observed sensor signals must be a linear unknown mixture of unobserved unknown source signals.
Then the unknown source signals are
S=!s1s2"T, (1)
and the observed mixed signals perceived by the sensors are
X=!x1x2"T. (2) They fit the linear model given below
X=A·S+N, (3)
whereAis the unknown mixture matrix andNis the addi-tive noise on the sensors. It is always possible to introduce a constantαsuch that
X=
A α
·(α·S)+N. (4)
This formulation points out the uncertainties in the power of the sources notedS. It is always possible to permute a column of the matrixAand a row in the source vectorS, that changes the order of the sources.
The BSS consists of determining a separation matrixB such that
B·A=I. (5)
That leads to:
Y =B·X=B·A·S+B·N. (6) And finally, we obtain
Y =Λ·Π·S+B·N. (7) The estimated sources namedY are equal to the sources S with a permutation matrixΠand a coefficient matrixΛ. The permutation and coefficient matrix come from the estimation ofB.
Additive white sensor noise does not affect the determina-tion ofB. In the following, it will be neglected in the equations, the estimated sources Y will be restored with this additive noise.
Most of the time, the first step of BSS algorithms is a singular decomposition value. Orthogonal sources are ob-tained. The solution is nonunique. It may exist a rotation of the sources which optimises the independence. The matrixB is estimated assuming that either the sources are statistically independent, then a criterion of independence is maximised [9, 10, 12, 13], or either they are uncorrelated, then a criterion of noncorrelation [14] is introduced.
An estimation of the mixing matrix can be obtained
A=B−1. (8)
Spatial energy distribution of the laser beam
Pyroelectric material
Upper electrode
Double sensor housing
Peripheral
sensor signal Centralsensor signal
Lower central electrode Lower peripheral
electrode
Figure2: The double sensor.
constituted by two sensors collecting a mixture of the two sources could allow to retrieve them by a source separation technique.
2.4. Optimum conditions for using source separation The pyroelectric sensor consists of a10mm diameter,0.2mm thick ceramic disc with metal electrodes on both surfaces. The sensor can be modelled as a current generator with a paral-lel capacitor. We used two characteristics of the breadboard construction for source separation [15]:
• a single pyroelectric sensor can be used as two sensors by cutting an electrode by removing a metal ring,
• the spatial distribution of the laser beam energy is Gaussian.
We made a double sensor by cutting the pyroelectric electrode with a scalpel to give a central disc (20mm2) and a peripheral crown (34mm2) (Figure 2). As the two sensors were on the same substrate, they were located at the same place and the sensor housing influenced them similarly. Thus, noise influ-enced the response per unit area of the two sensors in the same way. The noise was regarded as a single source, the response was proportional to the area of the sensor, so the central sen-sor was0.57(20/34)less sensitive than the peripheral one.
As the spatial distribution of the laser beam energy is Gaussian, the central part perceives more than the peripheral
part, and the ratio of the sensor responses depended on the focusing of the beam.
Each sensor received a different mixture of signals from one source (the modulated laser beam with its own imper-fections) and a second source (environmental noise).
A preliminary statistical study of the noise of unladen sensors in the experimental device revealed that it was white and Gaussian. The intensity was such that it could be regarded as negligible. The thermal diffusion length of pyroelectric material at working frequencies is sufficiently low compared to the width of the metal-free ring for the two parts of the double sensor to be regarded as independent.
2.5. BSS application
The mixture matrix of the previous model given in equation (3) is
A=
1
1 a1,2 a2,1 1
2
. (9)
by the central sensor. The inversion of the mixture matrix provides the separation matrix
B=Λ·Π·
The estimated sources are
Y =B·X, (11)
such thaty1is the estimate of the laser beam andy2is the estimate of the disturbances. The estimate of the laser beam y1is proportional to(x1−a1,2·x2), that shows that only the coefficienta1,2contributes to the restoration ofy1.
The use of source separation would not be justified if the coefficient a1,2 were known. However, the hand-made double sensor allows only a rough estimate of this coefficient. Creating several sensors on a single substrate would allow the use of a noise reference technique. But it would be necessary to focus the laser beam so that it would no longer fall on the peripheral sensor.
2.6. Applied algorithms
Source separation techniques are based on the statistical inde-pendence of the sources. The decorrelation requires second-order statistics, but the independence requires higher-second-order statistics than two. As third-order statistics are representa-tive of the dissymmetry of the density of probability, fourth-order statistics are mainly used to determine statistical inde-pendence of various sources in practice. If the sources are temporally correlated or, are not white, which is equivalent, second-order statistics of the sources and the time-shifted sources can be used. But higher-order statistics must be used if they are white.
The signal from the laser beam has a strong temporal co-herence, so an algorithm based on the second-order statistics which takes into account the correlation between the sources and the time-shifted sources such as SOBI[14, 16] is effi-cient. SOBIwas developed by Belouchrani et al. It consists of a first step of orthogonalization of data, followed by a sec-ond step which jointly diagonalized several cross correlation matrices from signal sensors to provide the demixing matrix. It is a block algorithm well adapted for this device because there is no temporal constraint, but online algorithms are used in real time working systems. It can be used directly, it just required the observed mixture signalsX, the number of searched sources “n” and the number “p” of delayed cross correlation matrices which take into account the temporal correlation.
Most source separation algorithms use higher-order statistics, we also used other block algorithms based on fourth-order statistics such as the ACIof Comon as defined in [13] and JADE of Cardoso [12] which maximise a contrast function. Both are classical references and are depending on the probability density function. Although they are less robust for these experimental signals, because they cannot take into
account the temporal coherence through the temporal cor-relation. Depending on the experimental noise context, they can fail to retrieve the sources. Nevertheless, they enabled us to confirm the results obtained with SOBI.
We recorded the sensor signals labelledX. We apply a BSS block algorithm which provides estimates of the mixing ma-trixAand the source signalsY. The estimated laser beamy1 is used in the post treatment which is a synchronous detection (lock in detection).
3. DOUBLE SENSOR: EXPERIMENTAL RESULTS
We then checked the effectiveness of the setup. The exiting sig-nal was composed of a fundamental frequency, its harmonics and a 100 Hz component. This was all our “a priori” knowl-edge of the real exiting beam. It was used to check whether the noise removal resulted in the exact restitution of the signal of the laser beam.
3.1. Double sensor-temporal field
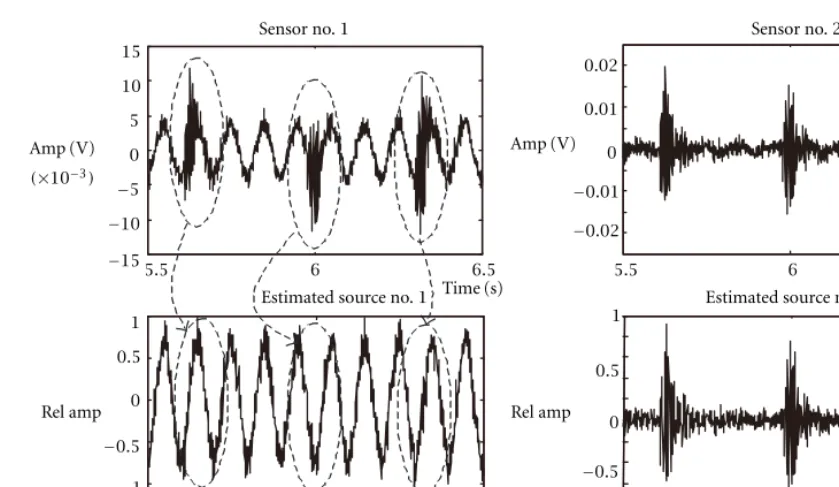
We generated a modulated exiting signal at 10 Hz, sampled at 1 kHz for 10 s and simulated noise by generating disturbances with a vibrating pot (exciting of calibration of 0.7 N) at 5.5 s and 6.5 s of the sampling time. The emerging laser beam had a rather low power (0.4mWeff). The SOBIalgorithm separated in the signals from the sensors in time with a joint diagonalization of5intercovariance matrices [17] (Figure 3). The notations sensor1and2are the responses of the central and peripheral sensors. The estimated sources1and2are the estimates of the signals corresponding to the laser beam and the generated noise. The amplitudes of the estimated sources were obtained within a multiplying coefficient and were normalised.
The three disturbances were removed from the estimated source1, but this signal corresponding to the estimated laser beam was still disturbed (Figure 3). The estimated matrix of separationBsuch that
Y=BX (12)
The coefficienta1,2 corresponding to the ratio of surfaces (0.5)was not equal to that expected(0.57). This could be because:
• the hand-made metal removal from electrodes induced an error in the surface areas,
5.5 6 6.5
−15
−10
−5 0 5 10 15
Amp (V)
(×10−3)
5.5 6 6.5
−0.02
−0.01 0 0.01 0.02
Amp (V)
Sensor no.1 Sensor no.2
Time (s) Time (s)
Estimated source no.1
−1.5
−1
−0.5 0 0.5 1
Rel amp
5.5 6 6.5 5.5 6 6.5
Time (s)
−1
−0.5 0 0.5 1
Rel amp
Estimated source no.2
Time (s)
Figure3: Vibratory noise-time domain.
the intrinsic resonance of pyroelectric material) could occur where the signal from the central sensor was am-plified, while that from the peripheral sensor was at-tenuated. This reasoning is valid for vibrations because of their transmission, but is not applicable to acoustic or thermal noise.
3.2. Double sensor-frequency field
We visualize these same signals in the frequency domain through a Hamming type window (Figure 4). The spectral power of the source was set at1. The “very high” energy of the main frequency (10Hz) compared to the other compo-nents, imposes to magnify the curves for the signal received by sensor1and the restored source1signals by an identical ratio. Figure 4 shows the signal received on sensor1. The fre-quency of the noise is mainly between100and150Hz, and the harmonics of the modulation frequency and the100Hz component are embedded in the noise. The estimated source 1signal is the estimate of the laser beam. The frequency com-ponents of the noise were removed and the harmonics of the main frequency and the100Hz signal remained, the third harmonic at30Hz is particularly visible. The noise removal was therefore particularly effective. Nevertheless, there re-mains a frequency of400–500Hz which was allotted to no source. These frequencies corresponded to a signal in the two sensors whose coefficients of the mixture matrix were differ-ent from those given previously. That comes from the prin-ciple of the source separation algorithms, which consists of, taking into account two sources, the two independent signals of the higher energy. Other signals will be restored in the two
estimated sources considered and will be distorted through the separation matrixB.
3.3. Test with greater power
A complementary test was carried out using a laser beam working point of about20mWeff. Stronger vibrations were generated to get similar magnitudes in the different signals. The noise removal remained very effective. The coefficient a1,2for separation was0.9. This abnormal value may have two probable origins:
• the piezoelectric coefficients are defined as the electric load collected on the electrodes of the sensor in re-sponse to a mechanical, acoustic or vibratory stimulus. These coefficients depend on the operating tempera-ture. The new working point implied a different in-crease. The average temperature of the central sensor is higher than that of the peripheral sensor and especially different from the previous test.
• the vibratory noise was particular (possible resonance), and acted on the sensors with a different ratio, depend-ing on the power.
3.4. Discussion
The first test revealed the need for blind source separation to determine the exact values of the coefficientsa1,2 anda2,1 for the separation matrix. The knowledge ofa1,2allows to remove noise from the signal by simple subtraction
Sensor no. 2
Estimated source 0
1 2 3
0 0.2 0.6 0.8 1
0.4 PSD
PSD 4
0 100 200 300 400 500 Frequency (Hz)
0 100 200 300 400 500 0
2
0 100 200 300 400 500 Frequency (Hz) Estimated source
Sensor no. 1
0 0.2 0.6 0.8 1
0.4 0 0.5 1
PSD
PSD 1.5
0 100 200 300 400 500 Frequency (Hz) 0 100 200 300 400 500
Frequency (Hz) Zoom×230
Zoom×230
(×10−3) (×10−3)
1.6×10⁻⁵
4.5×10⁻³
Figure4: Vibratory noise-frequency domain.
The second test, carried out at a different operating point and a higher power, provided another value ofa1,2. These values of the mixture matrix coefficients are linked to the type of test (power, type of noise).
BSS methods are needed to determine the coefficients exactly, which then leads to noise removal. We therefore undertook a thorough study of the sensors by considering more sources and increasing the number of sensors. Vibratory noise was closely linked to sensor anchoring (boundary con-ditions), while accoustic noise influenced the output signal proportionally to the volume of the sensor.
4. TRIPLE SENSOR: EXPERIMENTAL RESULTS
We made a triple sensor, consisting of a central sensor (sen-sor1), an inner peripheral crown (sensor2), and an external peripheral crown (sensor3), the areas of these three sensors were different. We standardised the areas to that of sensor2 to simplify comparison of the ratios. The standardised ratios of areas of sensors1,2, and3 were0.11,1, and0.3. The acoustic and thermal noises infuence these sensors as a func-tion of their area (the thickness of the disc being constant). But the effect of vibratory noise is certainly influenced by the sensor housing and the shape of the sensor. As the triple sensor was made from one disc, the central part could be more influenced by vibrations than the peripheral parts. The different areas and the shapes and locations of the three
sen-sors allowed the three sources to be dissociated, particularly acoustic or thermal noise from vibratory noise.
Preliminary tests without a laser beam were used to de-termine the influence of the various types of noise on the sensors. We recorded the amplitudes of the signals received by the three sensors corresponding to acoustic, thermal, and vibratory signals. Then, we deduced the standardised ratios (with respect to sensor2). There is no mixing matrix if the ratios for the three noises are identical, thus they cannot be separated. But if the ratios are sufficiently different, they can be separated.
−4
Times (s) Times (s)
Times (s)
Estimated source no. 1
Estimated source no. 2
Estimated source no. 3
(×10−3)
(×10−3)
Figure5: Acoustic noise-time domain.
the goal of this work was to show the contribution of source separation techniques to this type of device, the experimental differences between the various tests were of no importance.
4.1. The acoustic signal
The signal from the laser diode is a sine wave of frequency 9Hz and of power4mWeff, the sound effect is a sine wave of frequency32Hz. This signal was generated via a low power loudspeaker. The two signals were obviously deformed by the breadboard construction, mainly by the power supply for the laser diode and the loudspeaker for the sound effect. The estimated sources 1,2 corresponded to the estimated laser beam and acoustic signal (Figure 5).
Three sources were restored although only two sources were present and the sensor noises were white, then the third estimated source should be a white noise which is a linear combination of the three sensor noises. The third source has a temporal coherence when there are really three sources or when the mixture of signals is nonlinear. This third source can be confirmed by the signal analysis in the frequency domain (Figure 6).
The signals from the laser diode (presence of100Hz con-tribution) and the acoustic noise were perfectly restored. The estimated source3was not white, but made up of a main
frequency at172Hz and it was received on sensors1,2, and 3in the ratios0.4,1, and0.6, these were relatively close to the ratios obtained with a vibratory signal0.2,1,0.37,σ =0.15. We assumed that this is a particular resonance of the triple sensor. Complementary tests, including frequency analyses with a simple sensor and a double sensor, did not highlight this frequency. It probably was due to the construction of this triple sensor (manual metal removal of two crowns) which weakened it. The estimated sources1and2always contained the172Hz frequency produced by the nonlinearity of the mixing model for this source.
4.2. Vibratory signal
0
Frequency (Hz) Frequency (Hz)
Frequency (Hz)
Estimated source no. 1
Estimated source no. 2
Estimated source no. 3 Zoom×160
(×10−3)
(×10−3)
15×10−6 6×10⁻³
Figure6: Acoustic noise-frequency domain.
the laser beam. This is particularly visible on the magni-fied figures of the sensor and estimated source1signals. The 172Hz signal was always in the signals from the sensors, but it was restored with the vibratory signal (estimated source 2). This confirms the assumption that it was of vibratory origin.
The third estimated source corresponded to a stronger signal on the signal sensors, having different coefficients of the mixture matrix from those of the other two estimated sources. This particular result was due to the principle of op-eration of the algorithms of source separation. These gener-ally operate in two stages, first whitening and then separation. The initial whitening consists of determining the eigenvalues of the intercovariance matrix of the signals from the sensors. For experimental signals where there are more sensors than sources, the sensor noise involves the presence of eigenvalues associated with these noises. When this noise is not white, or when the sensors signals are disturbed by interferences during measurement, the eigenvalues of intercovariance-whitened matrix lead to nonwhite sources that have no real signifi-cance. Those do not respect the hypothesis of a linear mix-ture required for the separation of sources. This introduces this nonreal source in all the estimated sources. Thus, we see a 370Hz signal in the three figures of the estimated sources.
4.3. Thermal signal
The signal from the laser diode was a sine wave of frequency 9Hz and 3mWeff. The generated temperature variations were small and of very low frequency (0.4Hz). The signal separation was quite good (Figure 8). The thermal signal did not intervene in the same ratio as the vibratory signals, the third estimated source was the172Hz signal.
4.4. Analysis
The three previous tests showed that it was possible to disso-ciate the laser excitation signal from the acoustic, thermal and vibratory noises. The particular design of the multiple sensor (concentric rings) allowed separation of the vibratory noise from the acoustic and thermal noise. These latter influencing the output signals of the sensors in the same amplitude ra-tios, and so cannot be separated by this method. The mixture of acoustic and thermal noise was rather difficult to generate because they have a common mode of transmission by the displacement of air molecules.
4.5. Usefulness of triple sensor
4
Estimated source no. 1
Estimated source no. 2
Estimated source no. 3
(×10−6)
(×10−6)
(×10−4)
4×10⁻⁵
7×10⁻³
Figure7: Vibratory noise-frequency domain.
PSD
PSD
PSD PSD
PSD PSD
Frequency (Hz) Frequency (Hz)
Frequency (Hz)
Estimated source no. 1
Estimated source no. 2
Estimated source no. 3
(×10−4)
Sensor no. 1 Estimated source no. 1
Frequency (Hz) Frequency (Hz)
0 50 100 150 200 0 50 100 150 200
0 1 2 3 4 4.5
0 0.01 0.02
PSD PSD
(×10−5)
Figure9: Acoustic noise-enlargement-frequency domain.
1.06
1
0.94
0 20 40 60 80 −20 20 40 60 80
0 2 4
Test number Test number
Gain variations Phase variations(◦)
Figure10: Gain and phase of the digital synchronous filter output (20 periods).
adjacent part from the triple sensor. We used the estimates of the signal from the laser beam for both the double and triple sensors. These signals should be pure sine waves correspond-ing to the frequency modulation. We removed a sine wave signal of the frequency of modulation from the two estimated signals. Effective noise removal should give residues tending towards a white Gaussian sensor noise whose variance must tend towards a significant minimum.
The estimate provided by triple sensor gave a gain of9dB on the value of the variance of the residues compared to the estimate obtained by the double sensor. This improvement was mainly due to the fact of taking into account a third source (vibration particular to172Hz).
5. APPLICATION TO THE EXPERIMENTAL SETUP
5.1. Acoustic perturbation
This section describes results obtained from the output of the synchronous detection when a signal from a sensor is disturbed by an acoustic noise with a signal to noise ratio (SNR) of90dB in a frequency range close to the frequency modulation of the laser beam. The result is compared with that provided by this same signal with the noise removed by sources separation.
The output from the laser beam was34Hz and3mWeff, the frequency of the acoustic signal was25–60Hz (Figure 9). Noise was removed with the JADE algorithm. As the spectral density of the noise was relatively weak compared to that of the exciting signal, we made a proportional magnifying compared to the principal frequency modulation of the two signals.
Then we carried out a synchronous detection between a sine wave of34Hz and the signal from sensor1(raw signal). We did the same with a34Hz sine wave and the estimated source1(noise-free signal). The synchronous detection made over20periods is sufficient, the record being longer the al-gorithm is slid (80successive trials) to give several solutions. This gave the change in the gain and phase at the synchronous detection output. For a pure sine wave, the gain must be1and the phase0degree. The results are described in Figure 10, the solid line corresponds to the raw signal and the dotted line to the noise-free signal.
5.2. Discussion
This technique of noise removal was used in an experimen-tal setup for nondestructive testing. We showed that the use of a bad reference in an analysis by synchronous detection disperses the measurements. We reduced this dispersion by designing the experimental device around two pyroelectric sensors (reference and measurement). As the signals from the sensors were disturbed, we used source separation to remove noise.
The online BSS techniques are required for two reasons: (1) A variation in the beam focusing, or/and in the lo-cation sensor imply a change of the mixing matrix coeffi-cients. This drawback may be corrected by using a suitable BSS method at the beginning of the experience to find the new mixing matrix. This correction is similar to a calibra-tion.
(2) During the experience, different types of noise like acoustic or vibratory can operate on the sensors with different coefficients. Then, it is necessary to revalue them. It is an online correction.
We applied these techniques to the reference sensor dur-ing an analysis by synchronous detection with acoustic noise. A2-fold reduction in the standard deviation of the gain and phase was obtained. For similar signals (noise frequency close to signal frequency), a pre-treatment of the signals upstream of synchronous detection improved the precision of the re-sulting measurements.
6. CONCLUSION
We have developed a technique for removing noise from a signal from a pyroelectric sensor. It is based on the spatial nonuniformity of the signal and the possibility of creating several sensors on a single substrate. The source separation obtained with a double sensor gave precisely the coefficients of the separation matrix needed for noise removal. But un-foreseen coefficients led to the production of a triple sensor. This separated three signals, the emerging laser beam signal, vibratory noises and the other noises (acoustic and thermal). Taking into account the three signals improved the restitu-tion of the emerging laser beam signal and provided more information on the device, revealing a resonance frequency in the sensor.
Analysis by synchronous detection effectively rejects noise whose frequencies are far from the frequency of analysis. The removal of noise from the signals is interesting only when the analysed frequency is in the frequency range of the noise or very close to it. The contribution of these techniques to the nondestructive inspecting device described in this pa-per makes possible to obtain very precise measurements in difficult zones (50Hz, frequency range of vibrations of the device, …), where analysis by synchronous detection without noise removal would fail.
REFERENCES
[1] J. S. Antoniow, “A photopyroelectric method with air as the thermal coupling fluid,” J. Phys. D: Appl. Phys., vol. 30, pp. 1934–1944, 1997.
[2] R. W. Whatmore, “Pyroelectric devices and materials,” Rep. Prog. Phys., vol. 49, pp. 1335–1386, 1986.
[3] D. Paris,Etude de la migration d’humidité dans des biopolymères à base d’amidon par méthode photopyroélectrique, Thése de doctorat, Université de Reims Champagne-Ardenne, France, 1998.
[4] G. Asch,Les Capteurs en Instrumentation Industrielle, Dunod, France, 1987.
[5] L. Ljung,System Identification, Prentice Hall, London, 1987. [6] N. Wiener,Extrapolation, Interpolation and Smoothing of
Sta-tionary Time Series, with Engineering Applications, Wiley, New York, 1949.
[7] B. Widrow, “Adaptative noise cancelling: Principles and appli-cations,”Proc. IEEE, vol. 63, no. 12, pp. 1692–1715, 1975. [8] L. Cai and R. Anin, “La séparation de sources appliquée au
denoising en CND par courants de foucault,” Compte rendus du quinzième colloque GRETSI, pp. 109–112, 1995.
[9] J. F. Cardoso, “Source separation using higher order moments,”
Icassp’89, pp. 2109–2112, 1989.
[10] P. Comon, “Separation of sources using higher order cumu-lants,”SPIE Conference on Advanced Algorithms and Architec-tures for Signal Processing, vol. Real Time Signal Processing 12, pp. 170–181, 1989.
[11] J. L. Lacoume, P. O. Amblard, and P. Comon,Statistiques d’ordre Supérieur pour le Traitement du Signal, Masson, France, 1997. [12] J. F. Cardoso, “Blind beamforming for non-Gaussian signals,”
IEE Proceedings F, vol. 140, no. 6, pp. 362–370, 1993.
[13] P. Common, “Independant component analysis, a new con-cept,”Signal Processing, pp. 287–314, 1994.
[14] A. Belouchrani, Séparation Autodidacte de Sources: Algo-rithmes, Performances et Application à des Signaux Expérimen-taux, Thèse de l’ENST, France, 1995.
[15] R. Huez, D. Nuzillard, and A. Billat, “Détermination d’un profil de température dans des matériaux biopolymères par une méthode de séparation de sources,” inCompte Rendus du Seizième Colloque GRETSI, France, 1997, pp. 223–226. [16] A. Belouchrani, K. Abed Meraim, J. F. Cardoso, and
E. Moulines, “A blind source separation technique using the second order statistics,”IEEE Transactions on Signal Processing, vol. 45, no. 2, pp. 434–443, 1997.
[17] R. Huez, D. Nuzillard, and A. Billat, “De-noising of experimen-tals signals from pyroelectric sensors by a source separation method,” inProceedings of the Eusipco’98 Conference,Rhodes, vol. 4, pp. 2073–2076, 1998.
[18] R. Huez, D. Nuzillard, and A. Billat, “Bss analysis of an ex-perimental setup based on pyroelectric ceramics,” inFirst In-ternational Workshop on Independent Component Analysis and Source Separation ICA’99, pp. 435–440. Aussois, France, 1999.
Danielle Nuzillard(Ph.D., Paris XIin 1986) began to design analogical components (Thomson-CSF). Following graduation, she joined the Laboratory of Control and Micro-electronics at the University of Rheims. She is currently an assistant professor. Since few years, she has worked on source separation methods: blind, semi-blind, or constraint, and its applications: denoising of temporal signals, NMR spectra analysis, multispectral celestial images analysis.