R E S E A R C H A R T I C L E
Open Access
Prevalence and severity of low back- and
pelvic girdle pain in pregnant Nepalese
women
Ranjeeta Shijagurumayum Acharya
1,2,3*, Anne Therese Tveter
4,5, Margreth Grotle
4,6, Malin Eberhard-Gran
2,7,8and
Britt Stuge
3Abstract
Background:Low back pain (LBP) and pelvic girdle pain (PGP) are commonly reported during pregnancy and are known to affect pregnant women’s well-being. Still, these conditions are often considered to be a normal part of pregnancy. This study assesses the prevalence and severity of LBP and/or PGP among pregnant Nepalese women, as well as exploring factors associated with LBP and PGP.
Methods:A cross-sectional study with successive recruitment of pregnant women was conducted at two district hospitals in Nepal from May 2016 to May 2017. The data was collected using self-reported questionnaires.
Univariate and multivariate logistic regression were used to assess the associations between independent variables and LBP and/or PGP.
Results:A total of 1284 pregnant women were included in the study. The reported prevalence of pregnancy-related LBP and/or PGP was 34%. Pain intensity was high with a mean score (standard deviation) of 6 (2). The median (25th-75th percentiles) disability scores according to the total Pelvic Girdle Questionnaire and Oswestry Disability Index were 20 (10–32) and 30 (21–38), respectively. Even though only 52% of the women believed that the pain would disappear after delivery, concern about LBP and/or PGP was reported to be low (median 2 (0–4) (Numeric Rating Scale 0–10)). In the final model for women with LBP and/or PGP the adjusted odds ratios were for body mass index (20–24, 25–30, > 30) 0.7 (95% confidence interval (CI), 0.44–1.21), 1.1 (95% CI, 0.66–1.83), and 1.5 (95% CI, 0.78–2.94) respectively, for pelvic organ prolapse symptoms 6.6 (95% CI, 4.93–8.95) and for women with educated husbands (primary or secondary, higher secondary or above) 1.1 (95% CI, 0.53–2.16) and 1.7 (95% CI, 0.84– 3.47), respectively.
Conclusions:Pregnant Nepalese women commonly report LBP and/or PGP. The women experienced low disability despite severe pain intensity and poor beliefs in recovery after delivery.
Keywords:Pelvic girdle pain, Low back pain, Pelvic pain, Women’s health, Nepal, Pregnancy, Prevalence, Severity, Function, Impact
© The Author(s). 2019Open AccessThis article is distributed under the terms of the Creative Commons Attribution 4.0 International License (http://creativecommons.org/licenses/by/4.0/), which permits unrestricted use, distribution, and reproduction in any medium, provided you give appropriate credit to the original author(s) and the source, provide a link to the Creative Commons license, and indicate if changes were made. The Creative Commons Public Domain Dedication waiver (http://creativecommons.org/publicdomain/zero/1.0/) applies to the data made available in this article, unless otherwise stated.
* Correspondence:ranjeetashija@gmail.com 1
Introduction
Global progress in maternal mortality rate reduction has placed emphasis on maternal morbidity, addressing ma-ternal well-being and mental health [1, 2]. The World Health Organization’s Maternal Morbidity Working Group defined maternal morbidity as“any health condi-tion attributed to and/or aggravated by pregnancy and childbirth that has a negative impact on the woman’s wellbeing”[2].
As the most common pregnancy-related musculoskel-etal problems that impact pregnant women’s well-being are low back pain (LBP) and pelvic girdle pain (PGP), these conditions have garnered increasing interest worldwide [3–6]. LBP is defined as pain between the twelfth rib and the gluteal fold, while PGP is defined as pain experienced between the sacroiliac joint and the gluteal fold, or in the symphysis pubis [7]. The preva-lence of pregnancy-related LBP and PGP varies from 20 to 80%, with the majority of studies reporting approxi-mately 50% for LBP and/or PGP, and 20% for PGP spe-cifically [4,6–10].
Though not life-threatening conditions, pregnancy-related LBP and PGP may affect daily activities such as walking, working, sleep, and mood, thereby reducing quality of life [4,5]. Commonly reported risk factors for pregnancy-related LBP and PGP are strenuous workload, frequent or prolonged torso flexion, previous history of LBP or PGP, and previous trauma to the pelvis [7,8,11]. Body mass index (BMI), parity, and depression are also found to be associated with LBP and PGP [6,9,10].
Nepal’s main source of income is agriculture, with 76% of households involved in agricultural activities, and 84% of women involved in agricultural work [12,13]. The in-crease in labor migration among Nepal’s men has led to a triple role for women, who are involved in reproduction, agricultural production, and household work [14, 15]. The number of Nepalese women faced with physically strenuous work, little time for rest, and reduced family support, even during pregnancy, is high [16].
Pregnancy-related LBP and PGP are not generally regarded as serious complications and can thus be over-looked by healthcare professionals [4]. Nevertheless, dis-ability and negative psychological effects related to LBP and PGP have been reported in many countries [4–6,9,
10, 17–19]. A lack of awareness of the impairment caused by these musculoskeletal complaints can result in poor management of pregnant women. A multinational study showed variation in the prevalence, severity, and concern surrounding pregnancy-related LBP and PGP across different countries [4]. Societal attitudes, ethni-city, and cultural beliefs might influence how pregnancy-related LBP and/or PGP are perceived [20, 21]. Most studies on pregnancy-related LBP and PGP have been
conducted in developed countries, and it seems that these conditions are often overlooked in developing countries [22].
To our knowledge, the prevalence and severity of pregnancy-related LBP and PGP have never been exam-ined in Nepal [23]. Thus, the primary aim of this study was to assess the prevalence and severity of LBP and PGP in pregnant Nepalese women. A secondary aim was to determine the factors that influence LBP and PGP during pregnancy.
Methods
Study design and setting
A cross-sectional study with successive recruitment of pregnant women was conducted at two district hospitals in Nepal from May 2016 to May 2017. KIST Teaching Hospital in Lalitpur district is situated in the capital city Kathmandu, whereas Kathmandu University Dhulikhel Hospital (KUDH), in Kavreplanchowk district, is located 30 km northeast from Kathmandu. KIST and KUDH hospitals see about 1200 and 3500 live births each year, respectively.
Participants
Pregnant women attending antenatal control at KUDH and KIST hospitals were eligible for inclusion in the study if they were willing to participate, had no history of spinal fracture or surgery, and could understand and speak Nepali. Oral and written consent was obtained from women who agreed to participate in the study. One of two reasearch assistants collected and recorded data on a Samsung tablet with open data kit software.
Ethical approval was obtained from the Norwegian Re-gional Ethics Committee (REK Nord, 2015/2209), the Nepal Health Research Council Ethical Review Board (112/2016), and the Institutional Review Committee of Kathmandu University School of Medical Sciences/Dhu-likhel Hospital (25/16).
Measurements
cooking, child care, animal care, fetching water). Preg-nancy characteristics included number of pregnancies, parity, and gestation (weeks). Workload information in-cluded waking hours, hours of rest during work, types of field work (farming, grass cutting, branch cutting, fetch-ing water), workfetch-ing positions (sittfetch-ing or squattfetch-ing, stand-ing or bendstand-ing forward), and hours of prolonged sittstand-ing or standing.
The registration of LBP and PGP was done using a body chart. Participants who reported musculoskeletal pain were asked to indicate the location of their pain on a body chart, which was then validated by having the women point to the site of the pain on their body. If the women pointed to their lower back and/or pelvis, they were considered to have LBP and/or PGP. A physiother-apist then performed further clinical examination on women reporting LBP and/or PGP [7,24,25].
The women who reported LBP and/or PGP also responded to questions regarding pain intensity (nu-meric rating scale, 0 (no pain) to 10 (the most severe pain)) [26,27], pain frequency (on some days, most days, every day), specific pelvic pain locations (sacrum, sacro-iliac joints, and symphysis pubis), whether the LBP and/ or PGP limited their usual activities or changed their daily routine for more than 1 day (no/yes) [28], whether they were concerned about the LBP and/or PGP (nu-meric rating scale, 0 (not concerned) to 10 (extremely concerned), and whether they believed that the LBP and/or PGP would disappear after delivery (no/yes).
Reliable and valid Nepalese versions of outcome mea-sures were used to assess the severity of activity limita-tions and symptoms of pregnancy-related LBP and PGP. The Oswestry Disability Index (ODI), version 2 [29,30], consists of 10 items with scores from 0 to 5, describing an increasing degree of difficulty. The Pelvic Girdle Questionnaire (PGQ) comprises 25 items with scores on a 4-point descriptive scale from 0 to 3, describing an in-creasing degree of symptoms and activity limitations [31–33]. The total sum score for both the ODI and the PGQ is expressed as a percentage from 0 to 100 (severe disability).
The women completed questionnaires on pelvic organ prolapse (POP) symptoms, urinary incontinence (UI), and depression symptoms. The POP symptom score (POP-SS) ranges from 0 to 28, with higher scores indi-cating more severe symptoms [34]. The International Consultation on Incontinence Questionnaire-UI Short Form (ICIQ-UI SF) score ranges from 0 to 21, with higher scores representing more severe UI symptoms [35]. The short five-item version of the Edinburgh De-pression Scale (EDS-5) has four alternative answers to each question, scored from 0 to 3, adding up to a max-imum score of 15 to represent the highest severity of de-pression [36].
Statistical analysis
Continuous variables with normal distribution are pre-sented as mean (standard deviation (SD)) or median (interquartile range (iqr), 25th and 75th percentiles) if skewed. Categorical data are presented as numbers and percentages.
To assess the associations between independent vari-ables and LBP and/or PGP, univariate and multivariate logistic regression with odds ratios (OR) and 95% confi-dence intervals (CIs) were used. The authors planned to include 20 independent variables to assess these associa-tions, requiring at least 200 participants with pregnancy-related LBP and/or PGP. Prior to logistic regression ana-lysis, the independent variables were tested for collinear-ity, and correlations greater than 0.7 were considered to be one-dimensional. Following this rule, potential uni-variate associations for 20 independent variables with the outcome of LBP and/or PGP were analyzed using Mann-Whitney U or Chi-square tests, depending on whether variables were continuous or categorical. Vari-ables with p-values less than or equal to 0.25 were in-cluded in the multivariate regression model.
In order to enhance interpretability, the variables are presented in the following categories: age: ≤ 21, 22–24, 25–27,≥ 28 years; weeks of gestation: 1–12, 13–28, 29– 40; BMI: < 20, 20–24, 25–30, > 30; education: no educa-tion, primary-secondary (5–10 years), higher secondary and above (≥ 11 years); monthly income: no income, ≤ $153, and > $153; child care (no/yes), fetching water (no/ yes), field work (no/yes), rest during work (no/yes); POP-SS: no symptoms vs≥3 symptoms of POP (75th percentile); ICIQ-UI SF: no UI or reported UI; and EDS-5: < 5 or≥5 symptoms of depression. A backward strat-egy was used in the multivariate modelling. Variables with p-values greater than or equal to 0.05 were ex-cluded. Variables in the final model were checked for pair-wise interactions. The Statistical Package for the So-cial Sciences (SPSS) version 22 was used for statistical analysis.
Results
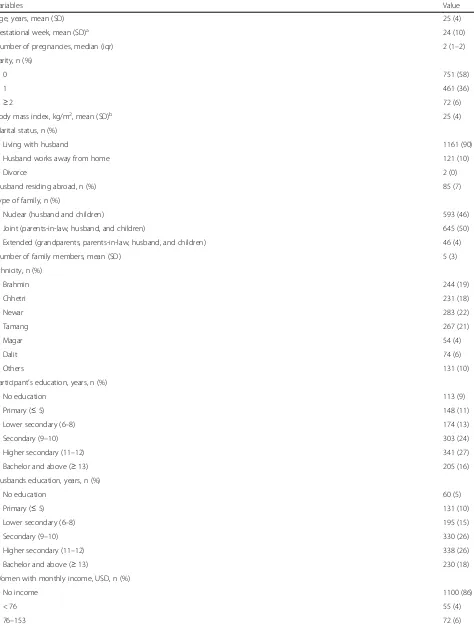
Table 1Characteristics of pregnant women included in the study (n= 1284)
Variables Value
Age, years, mean (SD) 25 (4)
Gestational week, mean (SD)a 24 (10)
Number of pregnancies, median (iqr) 2 (1–2)
Parity, n (%)
0 751 (58)
1 461 (36)
≥2 72 (6)
Body mass index, kg/m2, mean (SD)b 25 (4)
Marital status, n (%)
Living with husband 1161 (90)
Husband works away from home 121 (10)
Divorce 2 (0)
Husband residing abroad, n (%) 85 (7)
Type of family, n (%)
Nuclear (husband and children) 593 (46)
Joint (parents-in-law, husband, and children) 645 (50)
Extended (grandparents, parents-in-law, husband, and children) 46 (4)
Number of family members, mean (SD) 5 (3)
Ethnicity, n (%)
Brahmin 244 (19)
Chhetri 231 (18)
Newar 283 (22)
Tamang 267 (21)
Magar 54 (4)
Dalit 74 (6)
Others 131 (10)
Participant’s education, years, n (%)
No education 113 (9)
Primary (≤5) 148 (11)
Lower secondary (6–8) 174 (13)
Secondary (9–10) 303 (24)
Higher secondary (11–12) 341 (27)
Bachelor and above (≥13) 205 (16)
Husbands education, years, n (%)
No education 60 (5)
Primary (≤5) 131 (10)
Lower secondary (6–8) 195 (15)
Secondary (9–10) 330 (26)
Higher secondary (11–12) 338 (26)
Bachelor and above (≥13) 230 (18)
Women with monthly income, USD, n (%)
No income 1100 (86)
< 76 55 (4)
the most common types of field work, and most of the women’s working hours were spent either sitting, stand-ing, or bending forward, with a mean of 3 (SD 2) hours of prolonged standing.
The reported prevalence of pregnancy-related LBP and/or PGP was 34% (Table 1). The sacrum and sacro-iliac joints were the most commonly reported sites of pelvic pain, and only 7% of the women had pain in all three of the pelvic joints (Table 2). The clinical examin-ation was limited, as many of the women refused to per-form all clinical tests. The posterior pelvic pain provocation test was, however, performed in 379 (88%) women, and 73% had a positive result. Among the par-ticipants reporting LBP and/or PGP, evening pain inten-sity was reported to be high, with a mean of 6 (SD 2), while the total PGQ and ODI scores showed low and moderate disability, respectively. Twenty-four percent of the women had pain most days, and one-third reported a limitation of their ability to perform their usual
activities for more than 1 day due to LBP and/or PGP. Concern about LBP and/or PGP was reported to be low (median 2 (iqr 0–4)). Almost 50% of the participating women were either unsure or did not believe that their pain would disappear after delivery.
The univariate analyses showed a higher likelihood of pregnancy-related LBP and/or PGP in women with in-creased BMI, increasing weeks of gestation, higher education and higher monthly income, symptoms of POP, UI and depression, women who fetched water, and those whose husbands had a higher education and a higher monthly income (Table 3). The multi-variate regression analysis showed significant associa-tions in women with increased BMI, with husbands with higher education, and for women with POP symptoms (Table 4). No interactions were observed in the multivariate model. The strongest association was found between reported POP symptoms and LBP and/or PGP.
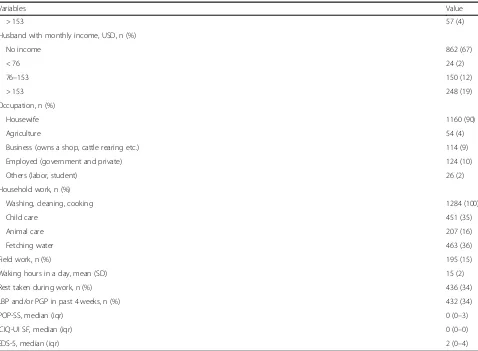
Table 1Characteristics of pregnant women included in the study (n= 1284)(Continued)
Variables Value
> 153 57 (4)
Husband with monthly income, USD, n (%)
No income 862 (67)
< 76 24 (2)
76–153 150 (12)
> 153 248 (19)
Occupation, n (%)
Housewife 1160 (90)
Agriculture 54 (4)
Business (owns a shop, cattle rearing etc.) 114 (9)
Employed (government and private) 124 (10)
Others (labor, student) 26 (2)
Household work, n (%)
Washing, cleaning, cooking 1284 (100)
Child care 451 (35)
Animal care 207 (16)
Fetching water 463 (36)
Field work, n (%) 195 (15)
Waking hours in a day, mean (SD) 15 (2)
Rest taken during work, n (%) 436 (34)
LBP and/or PGP in past 4 weeks, n (%) 432 (34)
POP-SS, median (iqr) 0 (0–3)
ICIQ-UI SF, median (iqr) 0 (0–0)
EDS-5, median (iqr) 2 (0–4)
SDStandard deviation; Interquartile range (iqr; percentiles 25th–75th),USDUnited States dollar,LBPLow back pain,PGPPelvic girdle pain,POP-SSPelvic organ prolapse symptom score,ICIQ-UI SFInternational consultation on incontinence questionnaire- urinary incontinence short form,EDS-5Edinburgh depression scale 5-item version
a
missing number: 15
b
Discussion
In this one-year prevalence study we found that LBP and/ or PGP were commonly reported in pregnant Nepalese women. Though the reported pain intensity was high, dis-ability and impact on daily life was found to be low. Only half of the participants believed that their pain would dis-appear after delivery. Multivariate analysis showed that women with increased BMI, POP symptoms, and hus-bands with higher education were significantly more likely to have pregnancy-related LBP and/or PGP.
The prevalence of LBP and/or PGP is consistent with a recent study from Western Nepal, in which back pain was reported as one of the most common complications during pregnancy [23]. A comparable study from an-other developing country also reported that LBP and PGP were commonly reported during pregnancy [17]. Still, the reported prevalence of pregnancy-related LBP and/or PGP in our study was found to be lower (34%) compared to studies in developed countries (45–86%) [4,
6, 8–10]. Possible explanations for the lower prevalence could be that most of our participants were pregnant for the first time, with a mean gestation of 24 weeks, com-pared to participants in other studies who were in their third trimester [4, 6, 10]. One or more previous
deliveries and increasing numbers of weeks of gestation have been reported to increase the risk of LBP and/or PGP [9,10,17,37].
Prevalence rates might also be influenced by the way data is collected. Data on LBP and PGP are commonly collected using questionnaires [4,38]. Optimally, classifi-cation of LBP and PGP should be done through a thor-ough clinical examination [7]. Unfortunately, we were not able to clinically examine all the women. We based our classification on a validated body chart by asking the women to point to the pain on their body site. Body charts have previously been used to determine LBP and/ or PGP; however, in contrast to our study, many studies lack a validation of the body chart [4,10].
Compared to a recent international study, the women in our study showed higher pain intensity than women in the United States, Norway, and Sweden, but lower than women in the United Kingdom [4]. The women in the United Kingdom had lower education than the women studied in the other countries. The majority of the women in our sample also had lower education levels, which could be one reason for their reported high pain intensity, as education level has been found to be associated with severity of symptoms [39].
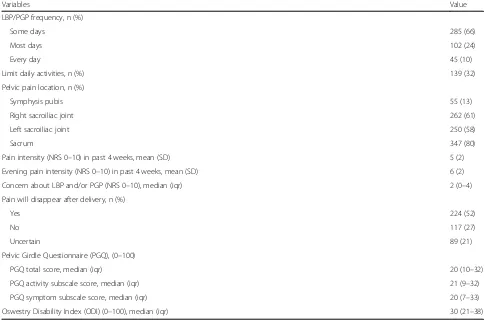
Table 2Descriptives of self-reported low back pain (LBP) and/or pelvic girdle pain (PGP) (n= 432)
Variables Value
LBP/PGP frequency, n (%)
Some days 285 (66)
Most days 102 (24)
Every day 45 (10)
Limit daily activities, n (%) 139 (32)
Pelvic pain location, n (%)
Symphysis pubis 55 (13)
Right sacroiliac joint 262 (61)
Left sacroiliac joint 250 (58)
Sacrum 347 (80)
Pain intensity (NRS 0–10) in past 4 weeks, mean (SD) 5 (2)
Evening pain intensity (NRS 0–10) in past 4 weeks, mean (SD) 6 (2)
Concern about LBP and/or PGP (NRS 0–10), median (iqr) 2 (0–4)
Pain will disappear after delivery, n (%)
Yes 224 (52)
No 117 (27)
Uncertain 89 (21)
Pelvic Girdle Questionnaire (PGQ), (0–100)
PGQ total score, median (iqr) 20 (10–32)
PGQ activity subscale score, median (iqr) 21 (9–32)
PGQ symptom subscale score, median (iqr) 20 (7–33)
Oswestry Disability Index (ODI) (0–100), median (iqr) 30 (21–38)
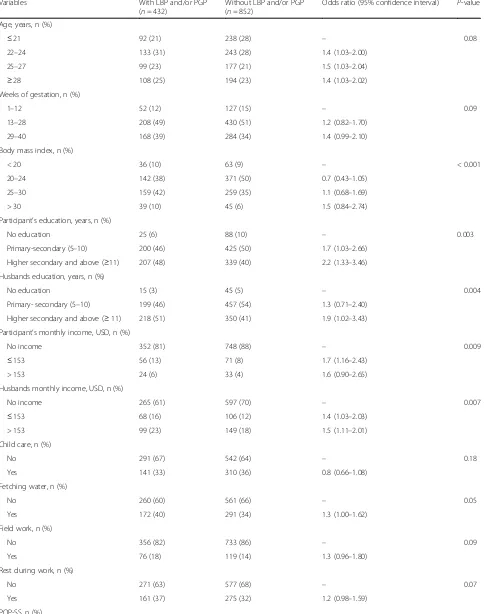
Table 3Univariate analysis of factors associated with and without pregnancy-related low back pain (LBP) and/or pelvic girdle pain (PGP)
Variables With LBP and/or PGP
(n= 432)
Without LBP and/or PGP (n= 852)
Odds ratio (95% confidence interval) P-value
Age, years, n (%)
≤21 92 (21) 238 (28) – 0.08
22–24 133 (31) 243 (28) 1.4 (1.03–2.00)
25–27 99 (23) 177 (21) 1.5 (1.03–2.04)
≥28 108 (25) 194 (23) 1.4 (1.03–2.02)
Weeks of gestation, n (%)
1–12 52 (12) 127 (15) – 0.09
13–28 208 (49) 430 (51) 1.2 (0.82–1.70)
29–40 168 (39) 284 (34) 1.4 (0.99–2.10)
Body mass index, n (%)
< 20 36 (10) 63 (9) – < 0.001
20–24 142 (38) 371 (50) 0.7 (0.43–1.05)
25–30 159 (42) 259 (35) 1.1 (0.68–1.69)
> 30 39 (10) 45 (6) 1.5 (0.84–2.74)
Participant’s education, years, n (%)
No education 25 (6) 88 (10) – 0.003
Primary-secondary (5–10) 200 (46) 425 (50) 1.7 (1.03–2.66)
Higher secondary and above (≥11) 207 (48) 339 (40) 2.2 (1.33–3.46)
Husbands education, years, n (%)
No education 15 (3) 45 (5) – 0.004
Primary- secondary (5–10) 199 (46) 457 (54) 1.3 (0.71–2.40)
Higher secondary and above (≥11) 218 (51) 350 (41) 1.9 (1.02–3.43)
Participant’s monthly income, USD, n (%)
No income 352 (81) 748 (88) – 0.009
≤153 56 (13) 71 (8) 1.7 (1.16–2.43)
> 153 24 (6) 33 (4) 1.6 (0.90–2.65)
Husbands monthly income, USD, n (%)
No income 265 (61) 597 (70) – 0.007
≤153 68 (16) 106 (12) 1.4 (1.03–2.03)
> 153 99 (23) 149 (18) 1.5 (1.11–2.01)
Child care, n (%)
No 291 (67) 542 (64) – 0.18
Yes 141 (33) 310 (36) 0.8 (0.66–1.08)
Fetching water, n (%)
No 260 (60) 561 (66) – 0.05
Yes 172 (40) 291 (34) 1.3 (1.00–1.62)
Field work, n (%)
No 356 (82) 733 (86) – 0.09
Yes 76 (18) 119 (14) 1.3 (0.96–1.80)
Rest during work, n (%)
No 271 (63) 577 (68) – 0.07
Yes 161 (37) 275 (32) 1.2 (0.98–1.59)
Despite high pain intensity, low disability scores were observed. Reported disability rates were much higher in pregnant women in Scandinavian countries, the United Kingdom, and the United States [4]. This result could be influenced by the differences in gestational period among the various groups of women studied, neverthe-less, the inconsistency between pain intensity and dis-ability is surprising. Only 10% of our sample reported LBP and/or PGP every day, and only one-third of the women reported that they had to limit their daily activ-ities. These rates are lower than those seen in the study by Gutke et al. [4] Pain tolerance has been shown to be strongly associated with ethnic differences [20]. The
differences in impact on daily life might be explained by the way Nepalese women adapt to pain or adopt differ-ent ways of coping with pain. Another possible explan-ation could be the neglect of health problems in Nepal due to the challenges of survival and meeting basic needs [16].
The participants were not very concerned about their LBP and/or PGP, even though only half of them believed that their pain would disappear after delivery. This belief in persistent pain postpartum could be due to lack of knowledge regarding the prognosis and recovery for LBP and PGP after delivery [40]. A study from Nepal re-ported the challenges faced by healthcare providers in Table 3Univariate analysis of factors associated with and without pregnancy-related low back pain (LBP) and/or pelvic girdle pain (PGP)(Continued)
Variables With LBP and/or PGP
(n= 432)
Without LBP and/or PGP (n= 852)
Odds ratio (95% confidence interval) P-value
0–2 (no symptoms of POP) 209 (48) 731 (86) – < 0.001
≥3 (symptoms of POP) 223 (52) 121 (14) 6.4 (4.92–8.34)
ICIQ-UI SF, n (%)
0- No UI 333 (77) 723 (85) – 0.003
1- Reported UI 99 (23) 129 (15) 1.7 (1.24–2.23)
EDS-5, n (%)
< 5 - no symptoms of depression 309 (72) 714 (84) – < 0.001
≥5 - symptoms of depression 123 (28) 138 (16) 2.1 (1.56–2.72)
USDUnited States dollar,POP-SSPelvic organ prolapse symptom score,≥3 (symptoms of POP); 75th percentile,ICIQ-UI SFInternational consultation on incontinence questionnaire-urinary incontinence short form,EDS-5Edinburgh depression scale 5-item version (cut off≥5 for symptoms of depression)
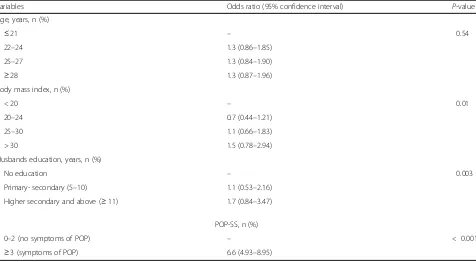
Table 4Multivariate analysis of factors associated with pregnancy-related low back pain (LBP) and/or pelvic girdle pain (PGP)
Variables Odds ratio (95% confidence interval) P-value
Age, years, n (%)
≤21 – 0.54
22–24 1.3 (0.86–1.85)
25–27 1.3 (0.84–1.90)
≥28 1.3 (0.87–1.96)
Body mass index, n (%)
< 20 – 0.01
20–24 0.7 (0.44–1.21)
25–30 1.1 (0.66–1.83)
> 30 1.5 (0.78–2.94)
Husbands education, years, n (%)
No education – 0.003
Primary- secondary (5–10) 1.1 (0.53–2.16)
Higher secondary and above (≥11) 1.7 (0.84–3.47)
POP-SS, n (%)
0–2 (no symptoms of POP) – < 0.001
≥3 (symptoms of POP) 6.6 (4.93–8.95)
Adjusted for age in the multivariate analysis
providing information to patients with low education [41]. The lower educational level of our sample and lack of information regarding common pregnancy complaints might have led to their belief in persistent LBP and/or PGP postpartum.
We found that women with a higher BMI were more likely to report LBP and/or PGP. This finding is consist-ent with several previous studies [6, 9, 10, 42], although one study [43] reported no association. One surprising finding in the current study was that women with edu-cated husbands were positively associated with pregnancy-related LBP and/or PGP. The majority of the women in our study were unemployed, and since highly educated husbands probably work away from home, it is likely that these women are responsible for household work, which might result in an increased strenuous physical workload influencing LBP and PGP [8,11]. Our finding is supported by another study from Nepal where the overburden of physical work on women is reported to be due to the migration of their husbands, either to urban centers or abroad, for employment [15]. Half of the women in our study had to fetch water and take care of animals, in addition to household chores, and 15% of the studied women were also involved in field work. Heavy physical workload might be a reason for Nepalese women reporting a significantly higher prevalence of backache compared to Nepalese men [44].
POP symptoms were also found to be associated with pregnancy-related LBP and/or PGP in our study. LBP, PGP, and POP are reported to be influenced by weakness and laxity of the muscles and their supporting structures [45,46]. During pregnancy the laxity of pelvic ligaments is exacerbated due to the release of the hormone relaxin [47]. Even though increased concentration of relaxin is seen during pregnancy, a positive association has not been established between pregnancy-related PGP and re-laxin [48]. Dufour et al. [49] reported high correlations between pelvic organ dysfunction and lumbo-pelvic pain, whereas Stuge at al. [50] reported no evidence for im-paired pelvic floor muscle function in postpartum women with PGP, though a tendency towards POP was reported. We used POP-SS, which is a self-reported out-come measure for identifying POP symptoms, and as one of the questions is related to LBP this might influ-ence the association.
Our univariate model showed significant associations of LBP and/or PGP with women with higher education and income, women whose husbands had higher in-come, weeks of gestation, workload (fetching water, rest during work, field work), and UI and depression symp-toms. However, in contrast to previous studies, none of these variables were associated in our multivariate model [9–11,19,39,51]. Compared to most studies performed in developed countries, our study might be influenced
by other social and ethnic factors [20,21]. More studies in developing countries are needed to increase the knowledge related to these factors.
A strength of our study is the large sample size of 1284 pregnant women. Further, to gain a broader repre-sentation of Nepal’s population, data was collected from two hospitals in different districts that care for patients from rural (KUDH hospital) and urban (KIST hospital) areas. Still, the results from our study population might not be generalized to women living in remote areas. An-other strength is that we used reliable and valid outcome measures for assessing LBP and PGP, allowing us to compare our results with those from other studies. To our knowledge, the prevalence, severity, and associations of pregnancy-related LBP and/or PGP have not previ-ously been assessed in Nepal using standardized ques-tionnaires. The use of open data kit software for data collection led to very little missing data, further strengthening our study. One possible limitation is that the questionnaires were administrated by a research as-sistant, however, since most of the participants had low levels of education, oral administration was needed to obtain data.
The present study shows that LBP and PGP are preva-lent in pregnant Nepalese women and that women ex-perience severe pain intensity alongside a belief in persistent pain post-partum. In developing countries like Nepal, LBP and PGP might be overlooked or considered to be normal complaints during pregnancy [22]. Nepal-ese women contribute significantly to agricultural and household work, even during pregnancy, and good phys-ical health is needed [15,16,44]. Hence, our study high-lights the need to address the complaints of LBP and PGP during pregnancy, and for health care providers to deliver timely information and treatment to prevent long-lasting pain.
Conclusions
LBP and PGP are prevalent in pregnant Nepalese women. Despite severe pain intensity, the women expe-rienced low disability. Women with increased BMI, POP symptoms, and husbands with higher education were significantly associated with LBP and/or PGP. Women’s belief in poor recovery of LBP and PGP after delivery in-dicates a need for assessment and information about musculoskeletal complaints in pregnant women in Nepal.
Abbreviations
Acknowledgements
The authors would like to thank the women who participated in this study. We would also like to thank the Obstetric and Gynaecology Department at KIST Teaching Hospital and Kathmandu University Dhulikhel Hospital, Nepal for allowing us to collect the data. In particular, we would like to thank the research assistants Ms. Jashmi Maharjan, Ms. Jesmina Maharjan and co-worker Ms. Bimika Khadgi for the help in data collection and valuable input for the questionnaires. We would also like to thank Eira Kathleen Ebbs for valuable help in language cleaning of the manuscript. Furthermore, we would like to thank Mr. Prabin Shakya and Ms. Pramita Shrestha for their valuable help in setting up the questionnaires in open data kit.
Authors’contributions
RSA, ATT, MG, MEG, and BS contributed to conception and design, analysis, interpretation of data, manuscript drafting, and critical revision of the manuscript. All authors read and approved the final manuscript.
Funding
Funding has been provided by the Norwegian State Educational Loan Fund through the Norwegian Quota Scheme, Norway.The funding body has not been involved in either the design of the study; collection, analysis, interpretation of data or in writing the manuscript.
Availability of data and materials
The datasets used and/or analysed during the current study are available from the corresponding author on request.
Ethics approval and consent to participate
Ethical approval was obtained from the Norwegian Regional Ethics Committee, Norway (REK Nord, 2015/2209); The Nepal Health Research Council Ethical Review Board (112/2016), Nepal; The Institutional Review Committee of Kathmandu University School of Medical Sciences/Dhulikhel Hospital (25/16), Nepal. Oral and written consent was obtained from the participants who agreed to participate in this study.
Consent for publication
Not applicable.
Competing interests
The authors declare that they have no competing interests.
Author details
1Department of Physiotherapy, Kathmandu University School of Medical Sciences, Kathmandu University Dhulikhel Hospital, Kavre, Nepal.2Institute of Clinical Medicine, University of Oslo, Oslo, Norway.3Division of Orthopaedic Surgery, Oslo University Hospital, Oslo, Norway.4Department of
Physiotherapy, Faculty of Health Sciences, Oslo Metropolitan University, Oslo, Norway.5National Advisory Unit on Rehabilitation in Rheumatology, Department of Rheumatology, Diakonhjemmet Hospital, Oslo, Norway. 6
FORMI, Oslo University Hospital, Oslo, Norway.7Health Services Research Unit, Akershus University Hospital, Lørenskog, Norway.8Department for Infant Mental Health, Regional Center for Child and Adolescent Mental Health, Oslo, Eastern and Southern Norway, Norway.
Received: 15 August 2018 Accepted: 4 July 2019
References
1. Alkema L, Chou D, Hogan D, Zhang S, Moller AB, Gemmill A, Fat DM, Boerma T, Temmerman M, Mathers C, et al. Global, regional, and national levels and trends in maternal mortality between 1990 and 2015, with scenario-based projections to 2030: a systematic analysis by the UN maternal mortality estimation inter-agency group. Lancet. 2016;387(10017): 462–74.https://doi.org/10.1016/S0140-6736(15)00838-7.
2. Firoz T, Chou D, von Dadelszen P, Agrawal P, Vanderkruik R, Tuncalp O, Magee LA, van Den Broek N, Say L. Measuring maternal health: focus on maternal morbidity. Bull World Health Organ. 2013;91(10):794–6.https://doi. org/10.2471/BLT.13.117564.
3. Ceprnja D, Chipchase L, Gupta A. Prevalence of pregnancy-related pelvic girdle pain and associated factors in Australia: a cross-sectional study
protocol. BMJ Open. 2017;7(11).https://doi.org/10.1136/bmjopen-2017-01 8334.
4. Gutke A, Boissonnault J, Brook G, Stuge B. The severity and impact of pelvic girdle pain and low-back pain in pregnancy: a multinational study. J Women's Health. 2018;27(4):510–7.https://doi.org/10.1089/jwh.2017.6342. 5. Mackenzie J, Murray E, Lusher J. Women’s experiences of pregnancy related
pelvic girdle pain: a systematic review. Midwifery. 2018;56:102–11.https:// doi.org/10.1016/j.midw.2017.10.011.
6. Mens JMA, Huis in’t Veld YH, Pool-Goudzwaard A. Severity of signs and symptoms in lumbopelvic pain during pregnancy. Man Ther. 2012;17(2): 175–9.https://doi.org/10.1016/j.math.2011.12.012.
7. Vleeming A, Albert HB, Östgaard HC, Sturesson B, Stuge B. European guidelines for the diagnosis and treatment of pelvic girdle pain. Eur Spine J. 2008;17(6):794–819.https://doi.org/10.1007/s00586-008-0602-4.
8. Wu WH, Meijer OG, Uegaki K, Mens JM, van Dieen JH, Wuisman PI, Ostgaard HC. Pregnancy-related pelvic girdle pain (PPP), I: terminology, clinical presentation, and prevalence. Eur Spine J. 2004;13(7):575–89.
9. Mogren IM, Pohjanen AI. Low back pain and pelvic pain during pregnancy: prevalence and risk factors. Spine (Phila Pa 1976). 2005;30(8):983–91. 10. Kovacs FM, Garcia E, Royuela A, Gonzalez L, Abraira V. Prevalence and
factors associated with low back pain and pelvic girdle pain during pregnancy: a multicenter study conducted in the Spanish national health service. Spine (Phila Pa 1976). 2012;37(17):1516–33.
11. Juhl M, Andersen PK, Olsen J, Andersen A-MN. Psychosocial and physical work environment, and risk of pelvic pain in pregnancy. A study within the Danish national birth cohort. J Epidemiol Community Health. 2005;59(7):580–5. 12. Government of Nepal, Ministry of Health and Population (MOHP). Nepal
demographic and health survey. 2011.https://dhsprogram.com/pubs/pdf/ fr257/fr257%5B13april2012%5D.pdf. Accessed 18 Jan 2018.
13. International Labour Organization. Nepal labour market update. 2017. https://www.ilo.org/wcmsp5/groups/public/---asia/---ro-bangkok/---ilo-kathmandu/documents/publication/wcms_543497.pdf. Accessed 18 Jan 2018.
14. Government of Nepal, Ministry of Labour and Employment. Labour migration for employment. A status report for Nepal: 2014/2015.https:// www.ilo.org/wcmsp5/groups/public/---asia/---ro-bangkok/---ilo-kathmandu/ documents/publication/wcms_500311.pdf. Accessed 21 Apr 2018. 15. Tamang S, Paudel KP, Shrestha KK. Feminization of agriculture and its
implications for food security in rural Nepal. J For Livelihood. 2014;12(1):20–32. 16. Shrestha B, Onta S, Choulagai B, Poudyal A, Pahari DP, Uprety A, Petzold M,
Krettek A. Women’s experiences and health care-seeking practices in relation to uterine prolapse in a hill district of Nepal. BMC Womens Health. 2014;14:20.https://doi.org/10.1186/1472-6874-14-20.
17. Ramachandra P, Maiya AG, Kumar P, Kamath A. Prevalence of
musculoskeletal dysfunctions among Indian pregnant women. J Pregnancy. 2015.https://doi.org/10.1155/2015/437105.
18. Pierce H, Homer CS, Dahlen HG, King J. Pregnancy-related lumbopelvic pain: listening to Australian women. Nurs Res Pract. 2012.https://doi.org/1 0.1155/2012/387428.
19. Virgara R, Maher C, Van Kessel G. The comorbidity of low back pelvic pain and risk of depression and anxiety in pregnancy in primiparous women. BMC Pregnancy Childbirth. 2018;18(1):288.https://doi.org/10.1186/s12884-01 8-1929-4.
20. Rowell LN, Mechlin B, Ji E, Addamo M, Girdler SS. Asians differ from non-Hispanic whites in experimental pain sensitivity. Eur J Pain. 2011;15(7):764– 71.https://doi.org/10.1016/j.ejpain.2010.11.016.
21. Sturgeon JA, Zautra AJ. Social pain and physical pain: shared paths to resilience. Pain Manag. 2016;6(1):63–74.https://doi.org/10.2217/pmt.15.56. 22. Gorginzadeh M, Imani F, Safari S. Pregnancy-related pelvic pain: a neglected
field in developing countries. Anesth Pain Med. 2016;6(1).https://doi.org/1 0.5812/aapm.35506.
23. Devkota R, Khan GM, Alam K, Regmi A, Sapkota B. Medication utilization pattern for management of pregnancy complications: a study in Western Nepal. BMC Pregnancy Childbirth. 2016;16:272.https://doi.org/10.1186/s12 884-016-1068-8.
24. Stuge B, Veierod MB, Laerum E, Vollestad N. The efficacy of a treatment program focusing on specific stabilizing exercises for pelvic girdle pain after pregnancy: a two-year follow-up of a randomized clinical trial. Spine (Phila Pa 1976). 2004;29(10):E197–203.
26. Kahl C, Cleland JA. Visual analogue scale, numeric pain rating scale and the mcgill pain questionnaire: an overview of psychometric properties. Phys Ther Rev. 2005;10(2):123–8.https://doi.org/10.1179/108331905X55776. 27. Sharma S, Palanchoke J, Reed D, Haxby AJ. Translation, cross-cultural
adaptation and psychometric properties of the Nepali versions of numerical pain rating scale and global rating of change. Health Qual Life Outcomes. 2017;15(1):236.https://doi.org/10.1186/s12955-017-0812-8.
28. Dionne CE, Dunn KM, Croft PR, Nachemson AL, Buchbinder R, Walker BF, Wyatt M, Cassidy JD, Rossignol M, Leboeuf-Yde C, et al. A consensus approach toward the standardization of back pain definitions for use in prevalence studies. Spine (Phila Pa 1976). 2008;33(1):95–103.https://doi. org/10.1097/BRS.0b013e31815e7f94.
29. Fairbank J, Couper J, Davies J, O’brien J. The oswestry low back pain disability questionnaire. Physiotherapy. 1980;66(8):271–3.
30. Acharya RS, Al-Oraibi S, Adhikari SP, Parajuli N, Limbu H, Al Enezi F. Validation in the cross-cultural adaptation of the Nepali version of the oswestry disability index. IJPOT. 2014;8(2):158.https://doi.org/10.5958/j. 0973-5674.8.2.079.
31. Stuge B, Garratt A, Jenssen HK, Grotle M. The pelvic girdle questionnaire: a condition-specific instrument for assessing activity limitations and symptoms in people with pelvic girdle pain. Phys Ther. 2011;91(7):1096–108. https://doi.org/10.2522/ptj.20100357.
32. Stuge B, Jenssen HK, Grotle M. The pelvic girdle questionnaire:
responsiveness and minimal important change in women with pregnancy-related pelvic girdle pain, low back pain, or both. Phys Ther. 2017;97(11): 1103–13.https://doi.org/10.1093/ptj/pzx078.
33. Shijagurumayum Acharya R, Tveter AT, Grotle M, Khadgi B, Koju R, Eberhard-Gran M, Stuge B. Cross-cultural adaptation and validation of the Nepali version of the pelvic girdle questionnaire. J Manipulative Physiol Ther. Accepted for publication on 7th April 2019.
34. Hagen S, Glazener C, Sinclair L, Stark D, Bugge C. Psychometric properties of the pelvic organ prolapse symptom score. BJOG. 2009;116(1):25–31. 35. Avery K, Donovan J, Peters TJ, Shaw C, Gotoh M, Abrams P. ICIQ: a brief and
robust measure for evaluating the symptoms and impact of urinary incontinence. Neurourol Urodyn. 2004;23(4):322–30.
36. Eberhard-Gran MEA, Samuelsen SO, Tambs K. A short matrix version of the Edinburgh depression scale. Acta Psychiatr Scand. 2007;116(3):195–200. 37. Bjelland EK, Eskild A, Johansen R, Eberhard-Gran M. Pelvic girdle pain in
pregnancy: the impact of parity. Am J Obstet Gynecol. 2010;203(2).https:// doi.org/10.1016/j.ajog.2010.03.040.
38. Bjelland EK, Stuge B, Engdahl B, Eberhard-Gran M. The effect of emotional distress on persistent pelvic girdle pain after delivery: a longitudinal population study. BJOG. 2013;120(1):32–40.
39. Chang HY, Jensen MP, Yang YL, Lee CN, Lai YH. Risk factors of pregnancy-related lumbopelvic pain: a biopsychosocial approach. J Clin Nurs. 2012; 21(9–10):1274–83.https://doi.org/10.1111/j.1365-2702.2011.03895.x. 40. Vollestad NK, Stuge B. Prognostic factors for recovery from postpartum
pelvic girdle pain. Eur Spine J. 2009;18(5):718–26.https://doi.org/10.1007/ s00586-009-0911-2.
41. Moore M. What do Nepalese medical students and doctors think about patient-centred communication? Patient Educ Couns. 2009;76(1):38–43. https://doi.org/10.1016/j.pec.2008.11.018.
42. Biering K, Nøhr EA, Olsen J, Andersen A-MN, Hjøllund NH, Juhl M. Pregnancy-related pelvic pain is more frequent in women with increased body mass index. Acta Obstet Gynecol Scand. 2011;90(10):1132–9.https:// doi.org/10.1111/j.1600-0412.2011.01141.x.
43. Sencan S, Ozcan-Eksi EE, Cuce I, Guzel S, Erdem B. Pregnancy-related low back pain in women in Turkey: prevalence and risk factors. Ann Phys Rehabil Med. 2018;61(1):33–7.https://doi.org/10.1016/j.rehab.2017.09.005. 44. Pradhan A, Shrestha N. Working hour and its impact on backache from
gender perspective. Dhaulagiri J Sociol Anthropol. 2010;4:235–46. 45. DeLancey JO, Morgan DM, Fenner DE, Kearney R, Guire K, Miller JM, Hussain
H, Umek W, Hsu Y, Ashton-Miller JA. Comparison of levator ani muscle defects and function in women with and without pelvic organ prolapse. Obstet Gynecol. 2007;109(2 Pt 1):295–302.
46. Goubert D, Oosterwijck JV, Meeus M, Danneels L. Structural changes of lumbar muscles in non-specific low back pain: a systematic review. Pain Physician. 2016;19(7):E985–E1000.
47. Petersen LK, Vogel I, Agger AO, Westergard J, Nils M, Uldbjerg N. Variations in serum relaxin (hRLX-2) concentrations during human pregnancy. Acta Obstet Gynecol Scand. 1995;74(4):251–6.
48. Aldabe D, Ribeiro DC, Milosavljevic S, Dawn BM. Pregnancy-related pelvic girdle pain and its relationship with relaxin levels during pregnancy: a systematic review. Eur Spine J. 2012;21(9):1769–76.
49. Dufour S, Vandyken B, Forget MJ, Vandyken C. Association between lumbopelvic pain and pelvic floor dysfunction in women: a cross sectional study. Musculoskelet Sci Pract. 2018;34:47–53.https://doi.org/10.1016/j. msksp.2017.12.001.
50. Stuge B, Sætre K, Brækken IH. The association between pelvic floor muscle function and pelvic girdle pain - a matched case control 3D ultrasound study. Man Ther. 2012;17(2):150–6.https://doi.org/10.1016/j.math.2011.12.004. 51. Fitzgerald CM, Santos LR, Mallinson T. The association between pelvic girdle
pain and urinary incontinence among pregnant women in the second trimester. Int J Gynaecol Obstet. 2012;117(3):248–50.https://doi.org/10.1016/ j.ijgo.2012.01.014.
Publisher’s Note