R E S E A R C H
Open Access
Network selection algorithm for
heterogeneous wireless networks based on
service characteristics and user preferences
Gen Liang
*and Hewei Yu
Abstract
Next generation heterogeneous wireless networks (HWNs) will integrate various wireless access technologies, such as cellular networks, wireless local area network (WLAN), and Worldwide Interoperability for Microwave Access (WiMAX), in order to support quality of service (QoS) requirements of various services. To connect mobile users to the best wireless network continuously, network selection has become a hotspot for research in HWNs. This paper designs a network selection algorithm based on service characteristics and user preferences. First, utility functions are used to calculate the utility value of each network attribute for different services. Next, the entropy method and the fuzzy-analytic hierarchy process (FAHP) are used to calculate the objective weight and subjective weight of network attributes respectively, with FAHP specifically being used to calculate the user preference values of services for candidate networks. Finally, simple additive weighting (SAW), multiplicative exponent weighting (MEW), and Technique for Order Preference by Similarity to Ideal Solution (TOPSIS) are used according to network attribute utility values and weights to calculate the score of each candidate network. These scores are converted into a comprehensive score for the candidate network based on such user preferences, thus obtaining the ranking of candidate networks. Simulation results show that the proposed algorithm can allow users to choose the most suitable network to access according to different service characteristics while reducing the number of network handovers.
Keywords:Network selection, Utility functions, Multiple attribute decision making, Fuzzy-analytic hierarchy process, Heterogeneous wireless networks
1 Introduction
In recent years, various radio access technologies have rap-idly developed. Cellular networks have evolved from the Global System for Mobile Communications (GSM) to the Universal Mobile Telecommunications System (UMTS) and then to Long Term Evolution (LTE), providing a wide range of wireless signal coverage [1]. Meanwhile, a series of wireless local area network (WLAN) standards (e.g., IEEE 802.11a, IEEE 802.11b, IEEE 802.11n, IEEE 802.11ac, etc.) provide users with high-speed data transmission services.
Within the signal coverage of cellular networks, a variety of other wireless access networks are deployed, forming heterogeneous wireless networks (HWNs) in which mul-tiple networks coexist with overlapping signal coverage
[2]. Due to the diversity of user services and the differ-ences in the transmission quality of wireless networks, it is necessary to rely on network selection algorithms to en-sure that users access the appropriate networks for service transmission and to provide users with the most appropri-ate connection services. Therefore, network selection has become a hotspot in research for HWNs [3,4].
In an environment with a single wireless network, the decision parameters of network selection are largely re-lated to the quality of wireless links (namely, received sig-nal strength (RSS) or the sigsig-nal to interference plus noise ratio (SINR)) [5], and there is usually only one decision parameter for network selection. Its goal is to better main-tain the physical connection of wireless channels. In an environment with HWNs, users can choose to access dif-ferent networks with their difdif-ferent service types and user preferences. Therefore, network selection should not be * Correspondence:[email protected]
School of Computer Science and Engineering, South China University of Technology, Guangzhou 510006, China
based on a certain decision parameter, but should com-prehensively consider multiple network attributes (such as RSS, bandwidth, network load, delay, delay jitter, packet loss ratio, moving speed, service price, and energy con-sumption) in order to allow users to access the most suit-able network [6].
In HWNs, network selection is usually modeled as a multi-attribute decision-making (MADM) problem be-cause multiple network attributes should be considered comprehensively [7,8]. MADM first collects data for each parameter, then normalizes the data, and calculates all at-tributes based on the weight of each attribute. Finally, the candidate networks are ranked. The MADM algorithm in-cludes many branches, such as simple additive weighting (SAW), multiplicative exponent weighting (MEW), Grey relational analysis (GRA), Technique for Order Preference by Similarity to Ideal Solution (TOPSIS), analytic hier-archy process (AHP), ELimination Et Choix Traduisant la REalite (“Elimination and Choice Expressing the Reality” or simply ELECTRE), VlseKriterijumska Optimizacija I Kompromisno Resenje (“Multi-Criteria Optimization and Compromise Solution”or simply VIKOR), and others.
Some literature adopts the utility theory to study net-work selection [9]. Utility is originally defined as the de-gree of satisfaction that a consumer obtains from a commodity after it is consumed and is commonly used in economics. In network selection, different services have different satisfaction levels for the same network attribute value due to the diversity of user services. Therefore, a utility function can be used to quantify user satisfaction with network attributes. The main idea of an access
selection algorithm based on the utility function is to de-sign the utility function to convert each network attribute to a utility value, calculate the comprehensive utility value for each candidate network, rank these values, and finally access the network with the highest value.
In addition, some literature uses intelligent algorithms to study network selection, such as game theory [10–12], Markov decision processes [13–15], and artificial neural networks [16,17]. These intelligent algorithms have high fairness and accuracy in network access selection and can accurately select a suitable network among multiple can-didate networks. However, this kind of algorithms is a gradual optimization process. Iteration must be executed several times to gradually obtain the optimal result. Usu-ally, insufficient number of iterations may not produce the desired result. In addition, this kind of algorithms may fall into a situation that it is possible to obtain local optimum in the calculation process, and the later convergence speed becomes slow, resulting in higher complexity of the rithm and more calculation time. Finally, this kind of algo-rithms can only obtain one network selection result for one user in one cycle, and the network selection efficiency is low, thus limiting the application of this kind of algo-rithms in the real environment [18].
Different from the above intelligent algorithms, MADM and the utility function can choose the best target network without iteration in the calculation process of network selection. This method is simple and efficient, with low computational complexity, short computation time, and a good quality of experience (QoE) for users [19]. Thus, a network access selection
algorithm that is based on MADM and utility function still provides great application value.
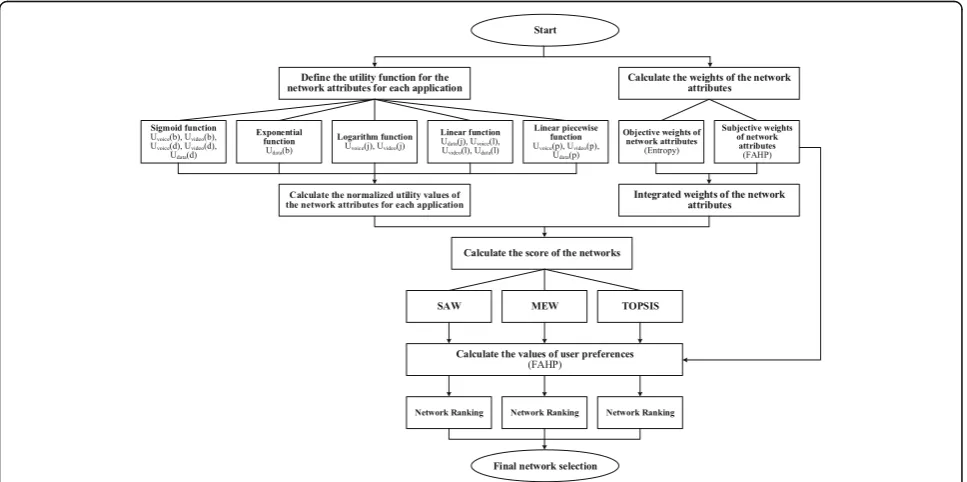
In this paper, we integrate the utility theory, the entropy method, the fuzzy-analytic hierarchy process (FAHP), the SAW, the MEW, and the TOPSIS to design the network selection algorithm (Fig. 1). In the process of algorithm design, we also consider the characteristics of different types of services, the objective and subjective weights of network attributes, the scores of network attributes, and the scores of user preferences. At present, although some other papers have integrated various methods to design network selection algorithms, to our best knowledge, none of the network selection algorithms designed by other pa-pers has integrated these methods at the same time as in this paper, and other papers have either not taken into ac-count the characteristics of services, or have not taken into account the subjective weights of network attributes, or have not taken into account the subjective preferences of users, etc. Therefore, the algorithm proposed in this paper gives a more comprehensive scheme for users to se-lect the most suitable network, which is the main contri-bution and feature of this paper.
The rest of this paper is organized as follows: Section2 reviews the related work on combination of multiple methods for network selection. Section 3 provides a de-tailed description of the scenario and the algorithm. The detailed calculation steps are also introduced. In addition, Section4 configures simulation environment parameters
and discusses the experimental results. Furthermore, Sec-tion 5 summarizes the article and introduces further research.
2 Related works
Every mathematical model (that is, MADM, utility the-ory, fuzzy logic, and game theory) has some advantages and disadvantages in network selection [20]. As this paper integrates various methods for network selection, we mainly analyze relevant literature that integrates vari-ous methods for the same.
In [21], Lahby et al. combine the enhanced TOPSIS method and the utility function for network selection. Firstly, the authors quantify the performance for each radio access network through enhanced TOPSIS method. Then, they use utility function to measure the degree of satisfaction when the mobile terminal moves out of range of the wireless access point. The policy of this literature can reduce the ping-pong effect and the number of hand-off failures.
In [22], Goyal et al. propose a FAHP-based network se-lection method and use triangular fuzzy numbers to rep-resent the importance of the elements in the comparison matrices for voice, video, and best effort applications. The authors also present a non-linear fuzzy optimization model for deriving crisp weights from fuzzy comparison matrices. In addition, the authors use utility functions to model the different network attributes (i.e., bandwidth,
delay, jitter, bit error rate, and cost) for three different types of applications. Finally, the authors calculate the scores of each network by SAW, TOPSIS, and MEW. The weights obtained from this literature are more consistent than the existing models; however, this literature does not consider the preferences of different applications.
In [23], Wu and Du propose a network selection scheme based on utility function. The authors jointly take users’ QoS demands, preferences, channel state in-formation, costs, and network loads into account. This scheme can use the radio resource efficiently to support diverse services, balance the load across different net-works, and improve the system throughput.
In [24], Ahuja et al. present a network selection algo-rithm in heterogeneous environment consisting of four networks (i.e., UMTS, WLAN, GPRS, and WiMAX) and consider different parameters including delay, bandwidth, packet loss, and cost. The authors compute the weight of the network attributes through entropy method and adjust the weight coefficients depending on the demand of ser-vices; finally, the authors rank the candidate network by TOPSIS. This literature considers the different require-ments of the three applications of voice, video, and data, but does not consider the different preferences of various applications for network attributes.
In [25], Senouci et al. propose a network selection strat-egy based on utility function and TOPSIS. The authors consider the problem of ranking abnormality generated by TOPSIS when a low-ranking network is disconnected and the order of higher ranking networks changes. The
authors also consider application needs to enhance the ranking quality.
In [26], Song et al. propose a network selection algo-rithm based on three multi-attribute decision-making methods (i.e., fuzzy-analytic hierarchy process, standard deviation method, and Grey relational analysis method). The authors use FAHP and standard deviation method to calculate the subjective and objective weights separ-ately and use GRA to rank the candidate networks.
As compared with the above works, the algorithm pro-posed in this article integrates the utility theory, the FAHP, the entropy method, and the MADM; obtains the utility values of various network attributes for different applications through utility functions; calculates the sub-jective and obsub-jective weights of network attributes by using the FAHP and the entropy method, respectively; calculates user preferences of different applications for each candidate network using the FAHP; and finally ranks networks with MADM.
3 System model
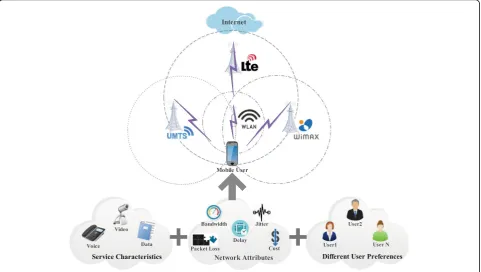
In the scenario with HWNs presented herein, there are four candidate networks (namely UMTS, LTE, WLAN, and WiMAX), and the signal coverage of these wireless networks overlaps. In addition, there are several mobile users in the scenario, and these users move in random di-rections within the signal coverage. These users are also treated as multi-mode mobile terminals with the ability to
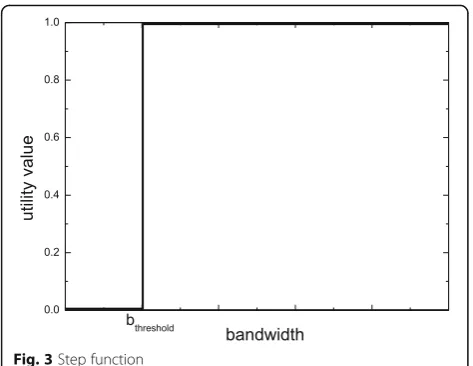
Fig. 3Step function
Table 1Utility function for bandwidth and parameter settings
Bandwidth Utility function a b c
uvoice(b) Sigmoid function 1000 10 \
uvideo(b) Sigmoid function 2500 5 \
udata(b) Exponential function \ \ 0.0003
Fig. 4Bandwidth utility function curve for voice, video, and data applications
Table 2Utility function for delay and parameter settings
Delay Utility function a b
uvoice(d) Sigmoid function 50 4
uvideo(d) Sigmoid function 100 3.5
process all wireless access technologies and to access any wireless network (Fig.2).
The process of network selection for a user is divided into three stages: network discovery, network selection decision-making, and access execution [27]. It is as-sumed that users can detect and collect the attribute data of each wireless access network within the signal range of the HWNs. It is also assumed that they can rank candidate networks according to the data and in conjunction with the network selection algorithm and ultimately complete the network connection according to the corresponding wireless network protocol. Here, it is assumed that there are five network attributes col-lected by users (namely, available bandwidth (b), delay (d), delay jitter (j), packet loss ratio (l), and service price (p)).
As different user applications have different sensitivities to the same network attribute (for example, real-time voice applications need the lowest bandwidth guarantee, video applications can adjust the resolution based on the bandwidth, and data applications expect larger band-width), this paper therefore divides user applications into three categories based on the service characteristics: in-elastic, partially in-elastic, and perfectly in-elastic, which will be represented by voice applications, video applications, and data applications, respectively. In addition, this paper as-sumes that an end user can only run any one of these three applications.
3.1 Using utility functions to calculate utility values of network attributes for different applications
Unlike the original definition of utility, network selec-tion in HWNs defines utility as the degree of satisfac-tion of users or applicasatisfac-tions, with the services provided by the network. Different applications have different degrees of satisfaction with the same network attribute value due to the diversity of user services, so the degree of user satisfaction with network attributes can be quantified by calculating utility values using utility functions [28]. The value of utility function is a relative index value. Generally speaking, the utility value for a user’s most satisfied attribute value is equal to 1, while the utility value for the least satisfied attribute value is equal to 0 [29]. For beneficial criteria (e.g., bandwidth), the larger the parameter value, the higher the degree of satisfaction; therefore, the utility value is u(x). For non-beneficial criteria (e.g., delay, jitter, packet loss ra-tio, price, and energy consumption), the larger the par-ameter value, the lower the degree of satisfaction; therefore, the utility value is 1−u(x).
For utility functions in the network selection algo-rithms, Wang and Kuo [9] explain in detail the principle of network selection using utility functions, the defini-tions, and the curve shapes of various utility functions. Ahmed et al. [30] summarize the meaning, advantages, and disadvantages of using utility function to design the network selection algorithm. Salih et al. [18] mention
Fig. 5Delay utility function curve for voice, video, and data applications
Table 3Utility function for delay jitter and parameter settings
Jitter Utility function d e f g h
uvoice(j) Logarithm function −2.67 0.75 35 \ \
uvideo(j) Logarithm function −1.35 0.5 15 \ \
udata(j) Linear function \ \ \ 1/100 0
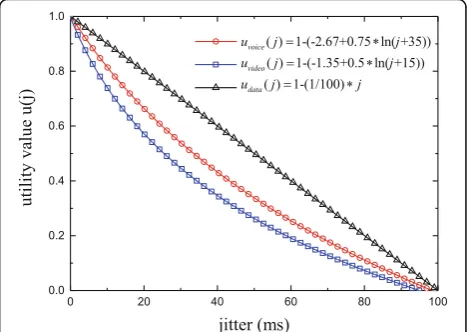
Fig. 6Delay jitter utility function curve for voice, video, and data applications
Table 4Utility function for packet loss ratio and parameter settings
Loss Utility function g h
uvoice(l) Linear function 1/30 0
uvideo(l) Linear function 1/30 0
that different services have different requirements and levels of satisfaction with network parameters, so differ-ent utility functions are designed for services of differdiffer-ent flexibility. Goyal et al. [22] use different utility functions such as sigmoid function, linear function, and exponen-tial function and different parameter settings for each network attribute. Trestian et al. [31] define the utility function of price as a linear piecewise function according to the user’s sensitivity to price.
On the basis of the above references, the utility func-tions adopted in this paper are sigmoid function, expo-nential function, logarithmic function, linear function, and linear piecewise function, specific definitions of which are shown in Formulas (1)–(5), respectively.
Sigmoid function:
u xð Þ ¼ ðx=aÞ b
1þðx=aÞb ð1Þ
Exponential function:
u xð Þ ¼e cx−1
ecx ð2Þ
Logarithm function:
u xð Þ ¼dþelnðxþ fÞ ð3Þ
Linear function:
u xð Þ ¼gxþh ð4Þ
Linear piecewise function:
u xð Þ ¼
1 ;x<i j−x
j−i ;i≤x<j
0 ;otherwise
8 > < >
: ð5Þ
a) Utility function for bandwidth
As inelastic services (i.e., voice applications) constrain the lowest value of bandwidth, Rakocevic et al. [32] define the bandwidth utility function of such applications as a step function. As shown below (Fig.3), there are only two function values (i.e., 1 or 0), which indicate whether the bandwidth obtained by an application exceeds or falls below the threshold (either satisfied or unsatisfied).
Although the inelastic service is very sensitive to the changes of some parameters, in an environment with HWNs, the values of parameters will change to some ex-tent due to factors such as the volatility and interference of wireless channels. In addition, the use of some tech-nologies (e.g. buffering technology) may also reduce the impact of these parameter value changes on the applica-tion. The use of a step function will often lead users to select the wrong network due to the changes of param-eter values. Therefore, this paper uses sigmoid functions to represent the effectiveness of bandwidth on voice ap-plications and tune the steepness of the function through the parameterbwith the threshold tuned by the parametera.
Some elastic services (i.e., video applications) can ad-just themselves based on the bandwidth provided by the network. In addition, their requirements for bandwidth are wider than those of voice applications, and they can
Fig. 7Packet loss ratio utility function curve for voice, video, and data applications
Table 5Utility function for price and parameter settings
Price Utility function i j
uvoice(p) Linear piecewise function 10 70
uvideo(p) Linear piecewise function 15 80
udata(p) Linear piecewise function 20 90
run within a larger bandwidth range. Therefore, the def-inition of bandwidth utility function for video applica-tions given herein is the same as that of voice applications (i.e., sigmoid functions), but a different par-ameter value is set for the utility function. In this paper, we assume that the bandwidth requirement of voice ap-plication is 1000 Kbps and that of video apap-plication is 2500 Kbps.
Fully elastic services (i.e., data applications) do not re-quire a strict minimum bandwidth guarantee, and the utility value increases with the bandwidth. Therefore, this paper uses exponential functions to represent the utility value of bandwidth to data applications (Table 1 and Fig.4).
b) Utility function for delay
Video applications and voice applications are both real-time traffic services, and the difference between them is that voice applications have more stringent delay re-quirements. Voice applications usually require the trans-mission delay to be limited to a certain range; otherwise, too high a delay may hinder voice understanding. The re-quirements of video applications for transmission delay are lower than those of voice applications. They only need to ensure that users can see continuous videos in the correct sequence. They do not require precise time synchronization between the client and the server. There-fore, video applications allow that transmission delays vary within a wide range. In this paper, we assume that the
delay requirement of voice application is 50 ms and the delay requirement of video application is 100 ms, and that data application is least sensitive to transmission delay, and the satisfaction gradually decreases with the increas-ing time of delay (Table2and Fig.5).
c) Utility function for delay jitter
Delay jitter refers to the difference between end-to-end delays of two consecutive data packets. At present, video applications mainly adopt streaming transmission, with stream media transmitted to users continuously and in real time through a video server. As a result, users do not have to wait until the entire file is down-loaded before watching a video. After waiting for just a few seconds or a dozen seconds, they can watch it. In the process of transmission, however, delay jitter may be caused by characteristics of the IP network and the per-formance of processing equipment. In serious cases, this phenomenon will affect the quality of streaming trans-mission, causing pixelated pictures, discoloration, re-peated buffering, and other phenomena, which will reduce user satisfaction. In addition, as data applications allow the receiver to reorder data packets arriving at dif-ferent times, data applications are not sensitive to delay jitter. Therefore, in this paper, we define the jitter utility functions of voice applications and video applications as logarithm functions, and jitter utility functions of data applications as linear functions (Table3and Fig.6).
d) Utility function for packet loss ratio
The packet loss ratio refers to the ratio of the number of lost packets to the number of transmitted packets.
Fig. 9FAHP hierarchy
Table 6Interpretation for importance level
Level Interpretation
0.5 Both are equally important
0.6 The former is slightly more important than the latter
0.7 The former is obviously more important than the latter
0.8 The former is strongly more important than the latter
0.9 The former is extremely more important than the latter
0.1, 0.2, 0.3, and 0.4
Ifxiis compared withxj, thenrijis obtained.
xjandxican be compared to the results inrji= 1−rij. 0.55, 0.65, 0.75, and the like represent the median value of adjacent levels.
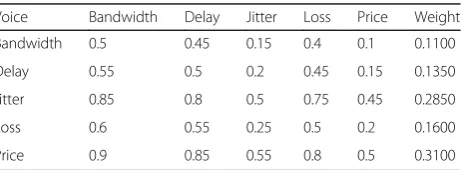
Table 7Fuzzy consistent matrix and weights for voice application
Voice Bandwidth Delay Jitter Loss Price Weight
Bandwidth 0.5 0.45 0.15 0.4 0.1 0.1100
Delay 0.55 0.5 0.2 0.45 0.15 0.1350
Jitter 0.85 0.8 0.5 0.75 0.45 0.2850
Loss 0.6 0.55 0.25 0.5 0.2 0.1600
Although voice, video, and data applications can be tolerant with packet loss ratio to a certain extent, with the increase of the packet loss ratio, the degree of satisfaction with these three kinds of applications will decline. This paper defines the utility function for packet loss ratio of these three kinds of applications as a linear function and assumes that these applications have the lowest satisfaction when the packet loss ratio exceeds 30% (Table4and Fig.7).
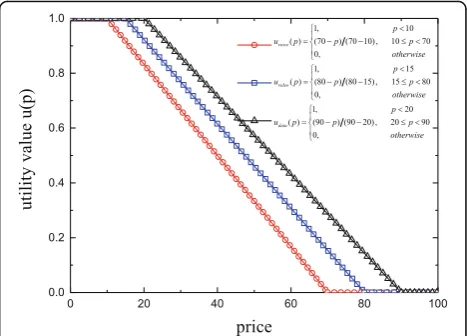
e) Utility function for price
In this paper, the linear piecewise function is used to represent the utility function for price, and the param-eter i of the function indicates the minimum service price that users are willing to pay. If i= 0, this indicates that users want to obtain free services. The parameter j
of the function indicates the maximum service price that users can pay. Ifp>j, this indicates that the price of this network exceeds the users’ability to pay, and users are unwilling to access this network. In this paper, we as-sume that the minimum prices for voice application, video application, and data application are 10, 15, and 20, respectively, and the maximum prices that can be paid are 70, 80, and 90, respectively (Table5and Fig.8).
3.2 Using the entropy method to calculate the objective weights of network attributes
In the information theory, entropy is a measure of un-certainty. The larger the amount of information, the smaller the uncertainty and the smaller the entropy. The smaller the amount of information, the greater the un-certainty and the greater the entropy. Based on the char-acteristics of entropy, we can judge the randomness and the degree of disorder of an event by calculating the en-tropy value. In addition, we can judge the dispersion de-gree of an attribute by using the entropy value. The
greater the dispersion of an attribute, the greater the in-fluence of the attribute on the comprehensive evalu-ation. Therefore, according to the variation degree of each attribute, the weight of each attribute can be calcu-lated by using the information entropy, providing the basis for comprehensive evaluation of multiple attri-butes. Based on References [33,34], the steps of calculat-ing the objective weight of network attributes uscalculat-ing the entropy method are as follows:
Step 1: Based on the type of the user’s application and the utility function of its network attributes, obtain the utility values and construct these values into a normalized matrixR= (uij)m×n, wheremis the number of candidate
networks andnis the total number of network attributes. In this paper,m= 4 andn= 5.
Step 2: Calculate the information entropy of each network attribute using Formula (7).
Ej¼−K
Xm
i¼1
uij ln uij ;ð1≤i≤m;1≤j≤nÞ ð7Þ
In the above formula,K¼ lnðmÞ1 .
Step 3: Calculate the objective weight of each network attribute using Formula (8).
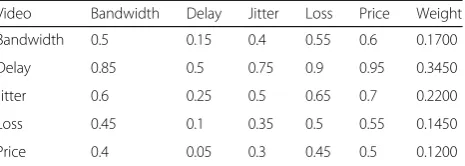
Table 8Fuzzy consistent matrix and weights for video application
Video Bandwidth Delay Jitter Loss Price Weight
Bandwidth 0.5 0.15 0.4 0.55 0.6 0.1700
Delay 0.85 0.5 0.75 0.9 0.95 0.3450
Jitter 0.6 0.25 0.5 0.65 0.7 0.2200
Loss 0.45 0.1 0.35 0.5 0.55 0.1450
Price 0.4 0.05 0.3 0.45 0.5 0.1200
Table 9Fuzzy consistent matrix and weights for data application
Data Bandwidth Delay Jitter Loss Price Weight
Bandwidth 0.5 0.85 0.95 0.55 0.75 0.3100
Delay 0.15 0.5 0.6 0.2 0.4 0.1350
Jitter 0.05 0.4 0.5 0.1 0.3 0.0850
Loss 0.45 0.8 0.9 0.5 0.7 0.2850
Price 0.25 0.6 0.7 0.3 0.5 0.1850
Table 10Applications and network attributes relationship matrix
Bandwidth Delay Jitter Loss Price
Voice 0.1100 0.1350 0.2850 0.1600 0.3100
Video 0.1700 0.3450 0.2200 0.1450 0.1200
Data 0.3100 0.1350 0.0850 0.2850 0.1850
Table 11Fuzzy consistent matrix and weights for bandwidth
Bandwidth UMTS LTE WLAN WiMAX Weight
UMTS 0.5 0.45 0.1 0.25 0.1333
LTE 0.55 0.5 0.15 0.3 0.1667
WLAN 0.9 0.85 0.5 0.65 0.4000
wobj ¼Xn1−Ej
j¼1
1−Ej
;ð1≤j≤nÞ ð8Þ
3.3 Using the FAHP to calculate the subjective weights of network attributes
The FAHP is an improved version of the AHP. Its principle is basically the same as that of AHP with the difference being that AHP establishes pairwise compari-son matrices of elements, and the consistency of the matrices must be judged after establishing the matrix, while the FAHP establishes consistent pairwise compari-son matrices whose consistency is ensured when estab-lishing the matrix [35]. In this paper, a fuzzy-analytic hierarchy process that is based on a fuzzy consistent matrix is used to calculate the subjective weights of net-work attributes. The main steps are as follows:
Step 1: Analyze the relationship between factors in access selection for HWNs and divide the analysis object into a target layer, criterion layer, and scheme layer, among which the target layer is the best access network, the criterion layer comprises network attributes (i.e., bandwidth, delay, jitter, packet loss ratio, and price), and the scheme layer is composed of candidate networks (i.e., UMTS, LTE, WLAN, and WiMAX) (Fig.9). Step 2: According to different applications (i.e., voice application, video application, and data application), the importance of each attribute of the criterion layer on the previous level (i.e., the target layer) is compared by two pairs. By comparing the elementxiand the element
xj, obtain the level of importancerij(Table6). Then, construct the fuzzy consistent matrix based onrij(Tables
7,8, and9). At the same time, check the consistency of the matrix according to Formula (9).
0≤rij≤1
Step 3: Calculate the subjective weight of each network attribute using Formula (10).
wsbi ¼1
In this paper, k¼n−12 in the above formula; therefore, the following is obtained:
3.4 Using the FAHP to calculate the user preference values
To calculate the preferences of different user applications for candidate networks, it is necessary to calculate the ranking of the lowest layer (i.e., scheme layer) about the highest layer (i.e., target layer). The calculation process is mainly divided into the following three steps:
Step 1: Calculate the importance ranking of the middle layer (i.e., criterion layer) with respect to the highest layer (i.e., target layer). In the previous section, the weights of each network attribute in the criterion layer are obtained with respect to the target layer. Therefore, according to the weight vector obtained in the previous section (Tables7,8, and9), the relationship matrix is Table 12Fuzzy consistent matrix and weights for delay
Delay UMTS LTE WLAN WiMAX Weight
UMTS 0.5 0.2 0.45 0.4 0.1750
LTE 0.8 0.5 0.75 0.7 0.3750
WLAN 0.55 0.25 0.5 0.45 0.2083
WiMAX 0.6 0.3 0.55 0.5 0.2417
Table 13Fuzzy consistent matrix and weights for jitter
Jitter UMTS LTE WLAN WiMAX Weight
UMTS 0.5 0.35 0.8 0.75 0.3167
LTE 0.65 0.5 0.95 0.9 0.4167
WLAN 0.2 0.05 0.5 0.45 0.1167
WiMAX 0.25 0.1 0.55 0.5 0.1499
Table 14Fuzzy consistent matrix and weights for loss
Loss UMTS LTE WLAN WiMAX Weight
UMTS 0.5 0.7 0.25 0.65 0.2667
LTE 0.3 0.5 0.05 0.45 0.1333
WLAN 0.75 0.95 0.5 0.9 0.4333
WiMAX 0.35 0.55 0.1 0.5 0.1667
Table 15Fuzzy consistent matrix and weights for price
Price UMTS LTE WLAN WiMAX Weight
UMTS 0.5 0.9 0.85 0.75 0.4167
LTE 0.1 0.5 0.45 0.35 0.1500
WLAN 0.15 0.55 0.5 0.4 0.1833
built between different applications and network attributes (Table 10).
Step 2: Based on the pairwise comparison of the importance of each candidate network at the lowest layer (i.e., scheme layer) with respect to the network attributes at the middle layer (i.e., criterion layer), a fuzzy consistent matrix is constructed, and the weights are calculated using Formula (11) (Tables11,12,13,
14, and15). Then, the relationship matrix between different netwomethods based on utility function and reputation rk attributes and candidate networks is constructed according to the weight vectors in Tables
11,12,13,14, and15(Table16).
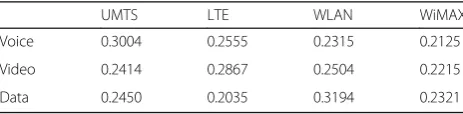
Step 3: Multiply the matrix in step 1 (Table10) by the matrix in step 2 (Table16) and calculate the ranking of the lowest layer (i.e., scheme layer) with respect to the highest layer (i.e., target layer), that is the user preference values of different applications for candidate networks (Table17).
3.5 Calculating scores of candidate networks by using SAW, MEW, and TOPSIS
In Section 3.2, the entropy method is used to calculate the objective weights of network attributes, and in Sec-tion 3.3, the FAHP is used to calculate the subjective weights of network attributes. Therefore, in this paper, the comprehensive weight of network attributes j is as follows:
wj¼αwobj þð1−αÞ wsbj ð12Þ
In the above formula, α can be dynamically adjusted. When α= 1, this means that only the objective weights of network attributes are considered. On the contrary, when α= 0, this means that only the subjective weights of network attributes are considered.
Next, this paper will discuss how to calculate the score of each candidate network using SAW, MEW, and TOP-SIS and how to calculate the comprehensive score of each candidate network based on user preference values. Due to its simplicity and high efficiency, SAW is a type of MADM algorithm that is widely used in network ac-cess selection. SAW ranks the candidate networks by calculating the sum of products of parameters and their weights, which can be expressed as follows:
SSAWi ¼X n
j¼1
uijwj ð13Þ
MEW differs from SAW in that MEW’s calculation of each parameter is not to sum up the product of each par-ameter and its weight, but to calculate it in the form of a weighted product, which can be expressed as follows:
SMEWi ¼Y n
j¼1
uijwj ð14Þ
The TOPSIS algorithm mainly evaluates the closeness of a candidate network to the best and worst access works. The most ideal situation is that the evaluated net-work is closest to the optimal access netnet-work and is farthest from the worst access network. TOPSIS can be expressed as follows:
STOPSIS
i ¼
D−i
Dþi þD−i ð15Þ
D−i andDþi represent the Euclidean distances from the current network to the worst and best reference net-works, respectively.D−i andDþi are calculated as follows:
D−i ¼ the worst and best candidate networks, respectively. As we calculated the utility value of the network attribute through the utility function in Section3.1, the following is obtained:
V−j ¼ min uij ;i¼1;2;⋯;m Vþj ¼ max uij ;i¼1;2;⋯;m
(
ð17Þ
After calculating the score of each candidate network using the SAW, MEW, or TOPSIS method, user prefer-ence values of different applications for each candidate network shown in Table 17in Section3.4are compared
Table 16Network attributes and candidate networks relationship matrix
UMTS LTE WLAN WiMAX
Bandwidth 0.1333 0.1667 0.4000 0.3000
Delay 0.1750 0.3750 0.2083 0.2417
Jitter 0.3167 0.4167 0.1167 0.1499
Loss 0.2667 0.1333 0.4333 0.1667
Price 0.4167 0.1500 0.1833 0.2500
Table 17User preferences for candidate networks for different applications
UMTS LTE WLAN WiMAX
Voice 0.3004 0.2555 0.2315 0.2125
Video 0.2414 0.2867 0.2504 0.2215
according to the types of user’s applications. Then, For-mula (18) is used to calculate the final comprehensive score of each candidate network, which is as follows:
Sifinal¼βSattributesi þð1−βÞ Spreferencei ð18Þ
In the above formula, β can be dynamically adjusted. When β= 1, this means that only the network score value calculated from the network attribute is considered without any consideration of the user preference value.
In addition, due to user mobility, changes in wireless channel performance, etc., the network attribute values received by the user will change, and each candidate net-work score also needs to be recalculated, which may cause user handover between different networks. In order to avoid frequent handover between different net-works due to slight changes in score, we add handover threshold parameter ΔThreshold, as shown in Formula (19); the handover operation is performed when the dif-ference between the maximum score of the other net-work and the score of the currently connected netnet-work is greater than the handover threshold; otherwise, the existing network connection is maintained, which can further reduce the ping-pong effect.
Smax−Scurrent >ΔThreshold ð19Þ
4 Evaluation of the proposed algorithm 4.1 Verification method
This section will test and discuss the algorithm proposed in this paper. MATLAB is used as a platform to simulate and conduct experiments. The network attribute param-eters in the experiment are set as shown in Table18[22, 36]. The first parameter indicates the default value of the network attribute, and the parameters in parentheses
indicate the lowest value and the highest value of the network attribute when it changes dynamically.
The experiment includes two parts: the first part is to conduct an experiment under the default values of the static network attributes and mainly evaluate the rank-ings of candidate network scores obtained using differ-ent algorithms. Under the static network attribute values and according to the utility function defined in Section 3.1, the utility value of each network attribute can be calculated and obtained for different applications (Tables 19,20, and21). The second part of the experiment is to conduct an experiment under dynamic network attribute values, mainly evaluating the number of candidate net-work selections and the number of netnet-work handover calculated by various algorithms. The change range of each network attribute is shown as numerical values in parentheses (Table18).
In this experiment, the value of the parameter α, which is used to adjust the ratio between the subjective weight and the objective weight of the network attribute in Formula (12), is set to 0.5, the value of the parameter
β, which is used to adjust the ratio between the network score calculated for the network attribute and the user preference value in Formula (18), is also set to 0.5, and the handover threshold parameter ΔThreshold in For-mula (19), is set to 0.03.
In addition, for a comparative analysis, three other al-gorithms are used (Utility & SAW, Utility & MEW, and Utility & TOPSIS), which are compared with the three algorithms in this paper (Utility, Entropy, FAHP, SAW, and User Preference; Utility, Entropy, FAHP, MEW, and User Preference; and Utility, Entropy, FAHP, TOPSIS, and User Preference), and these six algorithms are here-inafter referred to as Algorithms 1–6, respectively. The definition of the utility function in Algorithms 1–3 is the same as that in the proposed algorithm, and the weight
Table 18Network attribute parameter value settings
Bandwidth (Kbps) Delay (ms) Jitter (ms) Loss (%) Price
UMTS 1100 (700–2000) 60 (30–200) 15 (10–30) 4 (2–10) 20 (5–40)
LTE 2500 (800–4000) 45 (20–150) 20 (15–40) 10 (6–20) 30 (10–45)
WLAN 7200 (1000–8000) 120 (80–300) 60 (30–80) 6 (4–15) 10 (0–35)
WiMAX 4300 (900–6000) 80 (50–250) 30 (20–50) 15 (8–20) 40 (15–50)
Table 19Utility values of attributes for voice application in default parameter settings
Voice UMTS LTE WLAN WiMAX
Bandwidth 0.7217 0.9999 1.0000 1.0000
Delay 0.3254 0.6038 0.0293 0.1324
Jitter 0.7360 0.6645 0.2546 0.5392
Loss 0.8667 0.6667 0.8000 0.5000
Price 0.8333 0.6667 1.0000 0.5000
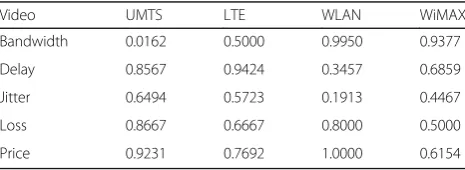
Table 20Utility values of attributes for video application in default parameter settings
Video UMTS LTE WLAN WiMAX
Bandwidth 0.0162 0.5000 0.9950 0.9377
Delay 0.8567 0.9424 0.3457 0.6859
Jitter 0.6494 0.5723 0.1913 0.4467
Loss 0.8667 0.6667 0.8000 0.5000
values of all attributes in Algorithms 1–3 are set to be the same (that is, the weight values are all equal to 0.2).
4.2 Network ranking in static network attribute value environment
In the simulation experiment environment with static de-fault network attribute parameter values (Fig. 10), when the user terminal runs a voice application, the ranking of the candidate networks is as follows: LTE > UMTS > WLAN > WiMAX with Algorithm 1 and Algorithm 3; the ranking of the candidate networks is LTE > UMTS > WiMAX > WLAN with Algorithm 2, and all these three algorithms choose the LTE network as the final access net-work. For voice applications, as there is no need for the network to provide a large bandwidth to operate properly, such applications expect to have lower delay jitter and price (Table19in Section4.1). In addition, Algorithms 4– 6 all consider the ranking of the importance of network attributes in different application situations and the pref-erences of different applications for candidate networks (Table 17), despite LTE, WLAN, and WiMAX networks having larger bandwidth utility values. Therefore, the can-didate networks obtained with Algorithm 4 and Algo-rithm 6 are ranked as UMTS > LTE > WLAN > WiMAX. With Algorithm 5, they are ranked as UMTS > LTE > WiMAX. At the same time, Algorithms 4–6 select UMTS as the final access network.
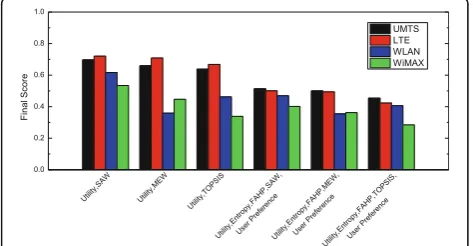
In the case where the user terminal runs video applica-tions, all algorithms except Algorithm 3 provide the highest scores for the LTE network (Fig. 11). The candidate
networks with Algorithm 2, Algorithm 5, and Algorithm 6 are as follows: LTE > WiMAX > WLAN > UMTS, but for Algorithm 1 and Algorithm 4, there is no significant differ-ence between the scores of UMTS and WiMAX. In addition, as delay, jitter, and bandwidth are more important than the packet loss ratio and price in video applications, when the utility value of some important attributes is close to zero (for example, the bandwidth utility value of the UMTS network as shown in Table 20 is 0.0162), Algo-rithm 5 makes the UMTS network have a lower score than other algorithms. Thus, it is easier to identify candidate networks that are not suitable for application requirements. For data applications (Fig. 12), the candidate networks with Algorithm 1 are as follows: UMTS > LTE > WLAN > WiMAX. Those with Algorithm 2 are ranked as LTE > UMTS > WLAN > WiMAX, and those with Algorithm 3 are ranked as LTE > WLAN > UMTS > WiMAX. There are great differences among the ranking results of these three algorithms. Although the UMTS network has higher price utility value and delay utility value and the LTE network has higher delay utility value and jitter util-ity value (Table21), Algorithms 1–3 do not consider the importance of bandwidth and packet loss ratio for data applications, so UMTS, LTE, and UMTS are respectively selected as access networks in this case. Furthermore, al-though the delay utility value and jitter utility value of
Table 21Utility values of attributes for data application in default parameter settings
Data UMTS LTE WLAN WiMAX
Bandwidth 0.2811 0.5276 0.8847 0.7247
Delay 0.8621 0.9174 0.6098 0.7785
Jitter 0.8500 0.8000 0.4000 0.7000
Loss 0.8667 0.6667 0.8000 0.5000
Price 1.0000 0.8571 1.0000 0.7143
Fig. 10Final scores of candidate networks for different algorithms for voice application
Fig. 11Final scores of candidate networks for different algorithms for video application
the WLAN network are relatively low, the WLAN net-work provides relatively high bandwidth utility value and packet loss ratio utility value (Table21). As Algorithms 4– 6 considered the importance of different attributes and calculated the final scores of candidate networks in ac-cordance with user preferences, Fig. 12 shows that the candidate networks with Algorithms 4–6 are ranked as WLAN > UMTS > LTE > WiMAX, and the data applica-tion was connected to the WLAN network in the environ-ment of the default static network attribute values set for the experiment.
4.3 Network ranking in dynamic network attribute value environment
In this section, we will evaluate and make statistics of the network selection with the above six algorithms in context of the dynamically changing network attribute values. As shown in Table18in Section4.1, each network attribute
value will dynamically change between the lowest value and the highest value with the rank in the bracket. In addition, the number of attribute value changes in the ex-periment is 1000 times.
For voice applications (Fig. 13), UMTS and LTE are the networks most selected by the six algorithms, while WLAN and WiMAX are selected less frequently. For video applications (Fig. 14), the network with the most selections by these six algorithms is LTE, with WLAN and WiMAX selected a certain number of times. For data applications (Fig. 15), the networks most selected with Algorithms 1–3 are UMTS and LTE, and WLAN is the network most selected by Algorithms 4–6. Mean-while, the LTE and WiMAX networks are relatively less selected. The average scores of candidate networks for different algorithms for different applications in the case of 1000 dynamic changes of network attributes are shown in Table22.
The number of network handovers for various algo-rithms under different application types is shown (Fig.16). The calculation method of switching times is that in two consecutive network attribute changes, if different net-works are selected, the number of handovers will be in-creased by one time. Here, a comparison between the same MADM methods in different applications is mainly observed (i.e., a comparison between Algorithm 1 and Al-gorithm 4, a comparison between AlAl-gorithm 2 and Algo-rithm 5, and a comparison between AlgoAlgo-rithm 3 and Algorithm 6).
For voice applications, UMTS and LTE are the most selected networks by the six algorithms, and WLAN and WiMAX are the least selected by these six algorithms, with switching mainly occurring between UMTS and LTE. Therefore, the total number of handovers of these six algorithms in voice applications is less than that in video applications and data applications.
Fig. 13Number of network selection of candidate networks for different algorithms for voice application
Fig. 14Number of network selection of candidate networks for different algorithms for video application
For video applications, LTE is the most selected by the six algorithms; however, the other three networks (i.e., UMTS, WLAN, and WiMAX) are selected by these algo-rithms on average, resulting in a higher number of hand-overs. The total number of handovers of these six algorithms in video applications is the highest among the three applications. In addition, as Algorithms 4–6 in this paper reduce the selection times of UMTS and increase the selection times of LTE when considering the prefer-ences, the number of handovers are reduced to some ex-tent compared with Algorithms 1–3, respectively.
For data applications, the numbers of selections of UMTS and LTE by Algorithms 1–3 are relatively close, and they also choose WLAN and WiMAX for a certain number of times, thus causing more handovers. The network most selected by Algorithms 4–6 is WLAN, followed by UMTS, with the number of selections of LTE and WiMAX being very small. Therefore, in a data appli-cation, Algorithms 4–6 reduce more switching times for Algorithms 1–3, respectively.
5 Conclusions
This paper proposes a selection algorithm for HWNs based on service characteristics and user preferences. This algorithm integrates several methods, such as the utility
function, the entropy method, the FAHP, and MADM. It also takes into account the utility values of network attri-butes for different applications, as well as the subjective and objective weights of network attributes, and ranks the comprehensive scores of candidate networks with refer-ence to user preferrefer-ences. The simulation results show that the proposed algorithm allows users to select the most suitable network to access according to different service characteristics and can reduce the number of network handovers.
The main shortcomings of this paper include the setting of utility function parameter values, parameter values of the parameterα(used to adjust the ratio between subject-ive and objectsubject-ive weights of network attributes), and par-ameterβ(used to adjust the ratio between network scores calculated for network attributes and user preference values), which require further adjustment and optimization in order to obtain a more accurate ranking of the compre-hensive scores for candidate network comprecompre-hensive scores. In addition, such factors as handover triggering be-tween networks and network load should be considered in future studies as to obtain better QoS support and a better user experience.
6 Methods
In order to choose the most suitable network connection for users, the methods proposed in this paper mainly in-clude the following steps:
Firstly, user services are divided into three types. Based on the characteristics of these different services, utility functions are designed for network attributes, and the utility value of each network attribute for such services is calculated by using those utility functions.
Secondly, the entropy method is used to calculate the objective weights of network attributes.
Thirdly, the fuzzy-analytic hierarchy process is used to calculate the subjective weights of network attributes, and α as an adjustment coefficient to integrate the objective weights and subjective weights of network tributes. Afterwards, the combined weight of network at-tributes is obtained.
Table 22Average scores of candidate networks for different algorithms for different applications
Voice Video Data
UMTS LTE WLAN WiMAX UMTS LTE WLAN WiMAX UMTS LTE WLAN WiMAX
Algorithm1 0.6356 0.6133 0.568 0.5367 0.5593 0.5889 0.5555 0.5243 0.7014 0.6846 0.6397 0.6270
Algorithm2 0.4442 0.4932 0.2601 0.3128 0.3623 0.5155 0.3967 0.4316 0.6531 0.6602 0.5914 0.6026
Algorithm3 0.6188 0.5681 0.4682 0.4017 0.4297 0.5537 0.5133 0.4783 0.5594 0.5707 0.4666 0.4581
Algorithm4 0.4692 0.448 0.417 0.3872 0.3865 0.4492 0.4114 0.3791 0.4883 0.4542 0.5167 0.4473
Algorithm5 0.3698 0.3827 0.2511 0.2658 0.2807 0.4076 0.3237 0.3256 0.4626 0.4407 0.4936 0.4347
Algorithm6 0.4393 0.4193 0.3701 0.3097 0.3099 0.4320 0.3864 0.3541 0.3952 0.3604 0.4448 0.3396
Fourthly, the fuzzy-analytic hierarchy process is used to calculate the user preference values of the user service for the candidate networks.
Fifthly, simple additive weighting, multiplicative expo-nent weighting, and technique for order preference by similarity to ideal solution methods are used to calculate the scores of the candidate networks according to the utility values of different network attributes and their combined weights.
Finally, based on the network scores obtained from the network attributes, as well as user preference values, the comprehensive scores of candidate networks are syn-thesized, and the most suitable network is selected for access based on the comprehensive scores of the candi-date networks.
The experiment is conducted under static network at-tribute values and dynamic network atat-tribute values. The simulation code was written in Matlab.
Abbreviations
FAHP:Fuzzy-analytic hierarchy process; HWNs: Heterogeneous wireless networks; LTE: Long Term Evolution; MADM: Multi-attribute decision-making; MEW: Multiplicative exponent weighting; QoS: Quality of service; RSS: Received signal strength; SAW: Simple additive weighting; TOPSIS: Technique for order preference by similarity to ideal solution; UMTS: Universal Mobile Telecommunications System; WiMAX: Worldwide interoperability for microwave access; WLAN: Wireless local area network
Funding
This work was supported by Natural Science Foundation of Guangdong Province (No. 2017A030307035), Innovative Research Project of the Education Department of Guangdong Province (No. 2017KTSCX127), Guangdong Science and Technology Project (No. 2013B010401006), and Key Collaborative Innovation Project among Industry, University and Institute of Guangzhou (No. 201604010001).
Availability of data and materials
The simulation data can be downloaded athttps://pan.baidu.com/s/ 1ZNbLazGblrIcixm03rIY6w.
Authors’contributions
The authors have equal contributions. All authors read and approved the final manuscript.
Competing interests
The authors declare that they have no competing interests.
Publisher’s Note
Springer Nature remains neutral with regard to jurisdictional claims in published maps and institutional affiliations.
Received: 19 June 2018 Accepted: 1 October 2018
References
1. M. Jo, T. Maksymyuk, R.L. Batista, T.F. Maciel, A.L.F. de Almeida, M. Klymash, A survey of converging solutions for heterogeneous mobile networks. IEEE Wirel. Commun.21(6), 54–62 (2014).https://doi.org/10.1109/MWC. 2014.7000972
2. M. Zekri, B. Jouaber, D. Zeghlache, A review on mobility management and vertical handover solutions over heterogeneous wireless networks. Comput. Commun.35(17), 2055–2068 (2012).https://doi.org/10.1016/j. comcom.2012.07.011
3. X. Wang, D. Qu, K. Li, H. Cheng, S.K. Das, M. Huang, R. Wang, S. Chen, A flexible and generalized framework for access network selection in
heterogeneous wireless networks. Pervasive Mob Comput40, 556–576 (2017).https://doi.org/10.1016/j.pmcj.2017.01.001
4. X. Feng, X. Gan, H. Zheng, Z. Chen, Distributed cell selection in heterogeneous wireless networks. Comput. Commun.109, 13–23 (2017).
https://doi.org/10.1016/j.comcom.2017.05.005
5. K. Ahuja, B. Singh, R. Khanna, Network selection algorithm based on link quality parameters for heterogeneous wireless networks. OPTIK125(14), 3657–3662 (2014).https://doi.org/10.1016/j.ijleo.2014.01.082
6. E. Gustafsson, A. Jonsson, Always best connected. IEEE Wirel. Commun.
10(1), 49–55 (2003).https://doi.org/10.1109/MWC.2003.1182111
7. E. Obayiuwana, O.E. Falowo, Network selection in heterogeneous wireless networks using multi-criteria decision-making algorithms: a review. Wirel. Netw23(8), 2617–2649 (2017).https://doi.org/10.1007/ s11276-016-1301-4
8. R. Trestian, O. Ormond, G. Muntean, Performance evaluation of MADM-based methods for network selection in a multimedia wireless environment. Wirel. Netw21(5), 1745–1763 (2015).https://doi.org/10. 1007/s11276-014-0882-z
9. L. Wang, G.G.S. Kuo, Mathematical modeling for network selection in heterogeneous wireless networks - a tutorial. IEEE Commun Surv Tut15(1), 271–292 (2013).https://doi.org/10.1109/SURV.2012.010912.00044
10. D. Niyato, E. Hossain, Dynamics of network selection in heterogeneous wireless networks: an evolutionary game approach. IEEE T Veh Technol
58(4), 2008–2017 (2009).https://doi.org/10.1109/TVT.2008.2004588
11. R. Trestian, O. Ormond, G. Muntean, Game theory-based network selection: solutions and challenges. IEEE Commun Surv Tut14(4), 1212–1231 (2012).
https://doi.org/10.1109/SURV.2012.010912.00081
12. Y.K. Salih, O.H. See, R.W. Ibrahim, An intelligent selection method based on game theory in heterogeneous wireless networks. T Emerg Telecommun T
27(12), 1641–1652 (2016).https://doi.org/10.1002/ett.3102
13. S. Goudarzi, W.H. Hassan, M.H. Anisi, S.A. Soleymani, MDP-based network selection scheme by genetic algorithm and simulated annealing for vertical-handover in heterogeneous wireless networks. Wireless Pers Commun92(2), 399–436 (2017).https://doi.org/10.1007/s11277-016-3549-5
14. X. Gelabert, J. Perez-Romero, O. Sallent, R. Agusti, A Markovian approach to radio access technology selection in heterogeneous multiaccess/ multiservice wireless networks. IEEE T Mobile Comput7(10), 1257–1270 (2008).https://doi.org/10.1109/TMC.2008.50
15. E. Khloussy, X. Gelabert, Y. Jiang, Investigation on MDP-based radio access technology selection in heterogeneous wireless networks. Comput. Netw.
91, 57–67 (2015).https://doi.org/10.1016/j.comnet.2015.08.005
16. X. Yan, Y.A. Sekercioglu, S. Narayanan, A survey of vertical handover decision algorithms in Fourth Generation heterogeneous wireless networks. Comput. Netw.54(11), 1848–1863 (2010).https://doi.org/10.1016/j. comnet.2010.02.006
17. K.R. Rao, Z.S. Bojkovic, B.M. Bakmaz, inInternational Conference on Telecommunications in Modern Satellite Cable and Broadcasting Services TELSIKS83-92, ed. by B. D. Milovanovic. Network selection in heterogeneous environment: a step toward always best connected and served (IEEE, NEW YORK, 2013).https://doi.org/10.1109/TELSKS.2013.6704898
18. Y.K. Salih, O.H. See, R.W. Ibrahim, S. Yussof, A. Iqbal, An overview of intelligent selection and prediction method in heterogeneous wireless networks. J. Cent. South Univ.21(8), 3138–3154 (2014).https://doi.org/10. 1007/s11771-014-2286-8
19. X. Yan, P. Dong, T. Zheng, H. Zhang, inWIREL COMMUN Mob Com (4967438). Fuzzy and utility based network selection for heterogeneous networks in high-speed railway (2017).https://doi.org/10.1155/2017/4967438
20. K. Ahuja, B. Singh, R. Khanna, Network selection in wireless heterogeneous environment by C-P-F hybrid algorithm. Wireless Pers Commun98(3), 2733–2751 (2018).https://doi.org/10.1007/s11277-017-4998-1
21. M. Lahby, A. Attioui, A. Sekkaki,An improved policy for network selection decision based on enhanced-TOPSIS and utility function, International Wireless Communications and Mobile Computing Conference (IEEE, NEW YORK, 2017), pp. 2175–2180.https://doi.org/10.1109/IWCMC.2017.7986620
22. R.K. Goyal, S. Kaushal, A.K. Sangaiah, The utility based non-linear fuzzy AHP optimization model for network selection in heterogeneous wireless networks. Appl. Soft Comput.67, 800–811 (2018).https://doi.org/10.1016/j. asoc.2017.05.026
23. X. Wu, Q. Du, Utility-function-based radio-access-technology selection for heterogeneous wireless networks. Comput. Electr. Eng.52, 171–182 (2016).
24. K. Ahuja, B. Singh, R. Khanna, Network selection based on weight estimation of QoS parameters in heterogeneous wireless multimedia networks. Wireless Pers Commun77(4), 3027–3040 (2014).https://doi.org/10.1007/ s11277-014-1692-4
25. M.A. Senouci, S. Hoceini, A. Mellouk,Utility function-based TOPSIS for network interface selection in heterogeneous wireless networks(IEEE International Conference on Communications. IEEE, NEW YORK, 2016).https://doi.org/10. 1109/ICC.2016.7511563
26. X. Song, W.M. Liu, M.L. Zhang, F. Liu,A network selection algorithm based on FAHP/GRA in heterogeneous wireless networks(IEEE, NEW YORK, 2016), pp. 1445–1449.https://doi.org/10.1109/CompComm.2016.7924942
27. M. Kassar, B. Kervella, G. Pujolle, An overview of vertical handover decision strategies in heterogeneous wireless networks. Comput. Commun.31(10), 2607–2620 (2008).https://doi.org/10.1016/j.comcom.2008.01.044
28. S. Radouche, C. Leghris, A. Adib, inMADM methods based on utility function and reputation for access network selection in a multi-access mobile network environment, ed. by A. Kobbane, K. Ibrahimi, M. Y. Hadi. (IEEE, NEW YORK, 2017), pp. 197–202.https://doi.org/10.1109/WINCOM.2017.8238177
29. P. Kosmides, A. Rouskas, M. Anagnostou, Utility-based RAT selection optimization in heterogeneous wireless networks. Pervasive Mob Comput
12, 92–111 (2014).https://doi.org/10.1016/j.pmcj.2013.03.007
30. A. Ahmed, L.M. Boulahia, D. Gaiti, Enabling vertical handover decisions in heterogeneous wireless networks: a state-of-the-art and a classification. IEEE Commun Surv Tut16(2), 776–811 (2014).https://doi.org/10.1109/ SURV.2013.082713.00141
31. R. Trestian, O. Ormond, G. Muntean, Enhanced power-friendly access network selection strategy for multimedia delivery over heterogeneous wireless networks. IEEE T Broadcast60(1), 85–101 (2014).https://doi.org/10. 1109/TBC.2014.2301282
32. V. Rakocevic, J. Griffiths, G. Cope, Performance analysis of bandwidth allocation schemes in multiservice IP networks using utility functions. Tel Sci Eng4, 233–243 (2001).https://doi.org/10.1016/S1388-3437(01)80125-6
33. Y.J. Zhang, Y.Z. Wang, J.P. Wang, Objective attributes weights determining based on Shannon information entropy in hesitant fuzzy multiple attribute decision making. Math. Probl. Eng.2014, 1–7 (2014).https://doi.org/10.1155/ 2014/463930
34. Y.J. Zhang, P.H. Li, Y.Z. Wang, P.J. Ma, X.H. Su, Multiattribute decision making based on entropy under interval-valued intuitionistic fuzzy environment. Math. Probl. Eng. (2013).https://doi.org/10.1155/2013/526871
35. S. Kubler, J. Robert, W. Derigent, A. Voisin, Y. Le Traon, A state-of the-art survey & testbed of fuzzy AHP (FAHP) applications. Expert Syst. Appl.65, 398–422 (2016).https://doi.org/10.1016/j.eswa.2016.08.064
36. Ajay, D. Gurjar, N. Purohit,An Optimized Network Selection Scheme for
Heterogeneous Wireless Networks(2013 SIXTH INTERNATIONAL CONFERENCE