Open Access
Proceedings
Impact of marker density on the accuracy of association mapping
Weihua Zhang*
†1,4, Winston Lau
†2, Cheng Hu
3and Tai-Yue Kuo
2Address: 1Section of Cancer Genetics, The Institute of Cancer Research, 15 Cotswold Road, Belmont, Sutton, Surrey SM2 5NG, UK, 2Human
Genetics Division, Duthie Building (Mailpoint 808), Southampton General Hospital, University of Southampton, School of Medicine, Tremona Road, Southampton, SO16 6YD, UK, 3Shanghai Diabetes Institute, Shanghai Jiaotong University, 600 Yishan Road, Shanghai 200233, People's
Republic of China and 4Department of Cardiology, Ealing Hospital NHS Trust, Uxbridge Road, Southall, Middlesex, UB1 3HW, UK
Email: Weihua Zhang* - [email protected]; Winston Lau - [email protected]; Cheng Hu - [email protected]; Tai-Yue Kuo - [email protected]
* Corresponding author †Equal contributors
Abstract
We studied the impact of marker density on the accuracy of association mapping using Genetic Analysis Workshop 15 simulated dense single-nucleotide polymorphism (SNP) data on chromosome 6. A total of 1500 cases and 2000 unaffected controls genotyped for 17,820 SNPs were analyzed. We applied the approach that combines information from multiple SNPs under the framework of the Malecot model and composite likelihood to non-overlapping regions of the chromosome. We successfully detected the associations with disease Loci C and D and predicted their locations as small as zero distance to Locus C when it was "typed" and 112 kb from the untyped rare Locus D. Reducing marker density decreased the accuracy of location estimates. However, the predicted locations were robust to variations in the number of SNPs. Generally, the linkage disequilibrium (LD) map reflecting distances between markers in relation to LD produced higher accuracy than the physical map. We also demonstrated that SNP selection based on equal LD distance outperforms that based on equal physical distance or SNP tagging. Furthermore, ignoring rare SNPs diminished the ability to detect rare causal variants.
from Genetic Analysis Workshop 15
St. Pete Beach, Florida, USA. 11–15 November 2006
Published: 18 December 2007
BMC Proceedings 2007, 1(Suppl 1):S166
<supplement> <title> <p>Genetic Analysis Workshop 15: Gene Expression Analysis and Approaches to Detecting Multiple Functional Loci</p> </title> <editor>Heather J Cordell, Mariza de Andrade, Marie-Claude Babron, Christopher W Bartlett, Joseph Beyene, Heike Bickeböller, Robert Culverhouse, Adrienne Cupples, E Warwick Daw, Josée Dupuis, Catherine T Falk, Saurabh Ghosh, Katrina A Goddard, Ellen L Goode, Elizabeth R Hauser, Lisa J Martin, Maria Martinez, Kari E North, Nancy L Saccone, Silke Schmidt, William Tapper, Duncan Thomas, David Tritchler, Veronica J Vieland, Ellen M Wijsman, Marsha A Wilcox, John S Witte, Qiong Yang, Andreas Ziegler, Laura Almasy and Jean W MacCluer</editor> <note>Proceedings</note> <url>http://www.biomedcentral.com/content/pdf/1753-6561-1-S1-info.pdf</url> </supplement>
This article is available from: http://www.biomedcentral.com/1753-6561/1/S1/S166
© 2007 Zhang et al; licensee BioMed Central Ltd.
Background
As the cost of genotyping decreases, genome-wide associ-ation (GWA) mapping of the predisposition genes for complex diseases is becoming a common study design in genetic epidemiology. As the huge number of single-nucleotide polymorphisms (SNPs) in the human genome is still prohibitive for exhaustive investigation, subsets of SNPs have often been selected for large scale studies. Mor-ton et al. developed a novel GWA mapping approach based on the Malecot model and composite likelihood combining multiple marker information from non-over-lapping genomic regions to predict the locations of dis-ease variants [1]. We applied this approach to the Genetic Analysis Workshop (GAW) 15 Problem 3 simulated dense chromosome 6 data with the knowledge of the answers and we studied the effect of SNP density on the accuracy of association mapping.
Methods
Data
The simulated data set contained 1500 families with a sib pair affected with rheumatoid arthritis (RA) and a random sample of 2000 unrelated and unaffected individuals. To form a case-control study, we selected the first sibling per family as a case. A total of 1500 cases and 2000 controls from Replicate 1 were analyzed. There are three simulated disease loci. HLA-DR is at the same location of 32484.648 kb as Locus C, where a SNP denseSNP6_3437 lies, so we considered this SNP the disease variant C. Locus D is at 37233.784 kb, in very weak linkage disequilibrium (LD) with Locus C. The minor allele frequency (MAF) for the C allele was 0.4055 in control samples. The D allele has a population frequency of 0.0083, but the variant was not typed.
Genotype data were composed of 17,820 SNPs on chro-mosome 6, mimicking a 300 K GWA scan with no missing values. Fifty-eight SNPs showing departure from Hardy-Weinberg equilibrium (HWE) in control samples (χ2
1 ≥
10 for either Pearson's or likelihood ratio chi-square tests) were discarded [2]. Following convention, 2061 rare SNPs with MAF < 5% were further removed except when other-wise indicated. The main data set (1) was thus composed of a total number of 15,701 SNPs. In another experiment we retained all SNPs but removed 26 SNPs showing departure from HWE by the likelihood-ratio test and this generated 17,794 SNPs (data set 2).
LD map
The physical map length was 170,813 kb. LD maps expressed in LD units (LDUs) were constructed based on pair-wise LD for multiple markers in control samples [3]. LDU is the product of ε and kb distance for an interval of two adjacent SNPs and is additive, where ε represents the exponential decline of LD with distance for that interval.
We used the LDMAP-cluster, a parallel version of LDMAP program that rapidly constructs the maps of equally divided chromosome segments http:www.som.soton.ac.uk/research/geneticsdiv/
epidemiol ogy/ldmap/[3]. For each segment, an overall ε value was also estimated. The LD map length was 1311.225 LDUs for the main data set and 1237.923 LDUs for data set 2. SNPs can have the same LDU if they are in an LD block. Therefore, we also made tilted LD maps by reassigning LDU locations for the SNPs with the same LDU by linear interpolation.
Association mapping
A chromosome is divided into non-overlapping consecu-tive regions of a minimum number of 30 SNPs and a min-imum length of 10 LDUs by default without breaking LD blocks. Each genomic region was then analyzed sepa-rately. Association between SNP alleles and disease status in the Malecot model is a function of several parameters. Composite likelihood combines information of all marker-disease association in a genomic region. The parameters were estimated through fitting the model to the data with a map in LDU or kilobases and by minimiz-ing -2 natural log composite likelihood (denoted as Λ) [1]. The estimated location S of the disease locus is con-verted to a kilobase scale. The significance test is per-formed by contrasting two hierarchical models. Model A assumes no association with the disease, therefore S is not estimated. Model D assumes an association with the dis-ease and S and two other parameters are estimated and ε is specified. The difference in Λ between models A and D (ΛA - ΛD) is monotonic to the magnitude of chi-square with three degrees of freedom (χ2
3). Permutation by
shuf-fling case-control status for each region was performed to obtain empirical p-values [1]. The algorithms were imple-mented in the CHROMSCAN program. A parallel version, CHROMSCAN-cluster, deployed on a local Beowulf clus-ter http://www.som.soton.ac.uk/research/geneticsdiv/epi demiology/chromscan/ was used for computing 1000 replicates.
The values of ε were obtained by averaging over eight seg-ments in LD map construction, which were 1.14472 and 0.00568 for LD and kilobase maps, respectively, for the main data set, and 1.14386 and 0.00544 over nine seg-ments for data set 2. Theoretically, a more accurate ε may be obtained by fitting the maps to the whole chromosome data, but the extensive computing power required for the task is impractical to implement and beyond the current computing resource. Also, slightly altered ε values did not appear to have an appreciable effect (data not shown).
For comparison, a single SNP χ2
1 was obtained by the 2 ×
2 allelic count table and the most significant SNP (msSNP) showing maximal χ2
identi-fied. Location error (in kilobases) was defined as the dif-ference between S or the location of the msSNP and the true location of disease variant. Accuracy refers to the pre-cision of the predicted location S. The smaller the error, the higher the accuracy.
SNP density
To generate different SNP density, we selected every ith
SNP (i = 2, 3, ..., 20, 25, 30) in the order of their physical locations from the full data set, representing 1/i the number of SNPs in the original set. For a candidate region spanning Loci C and D with rare SNPs included, we used Tagger implemented in the Haploview software to select tagging SNPs that optimally capture allelic variation among SNPs at a given r2 threshold based on pairwise LD
in control samples [4]. For comparison, we selected the same number of SNPs as Tagger but in equal LDU or kilo-base distance. To do this we used the tilted LD map in which every SNP had a unique LDU location. We also studied the impact of region length and sample size.
Results and discussion
Association mapping of disease loci in full data set
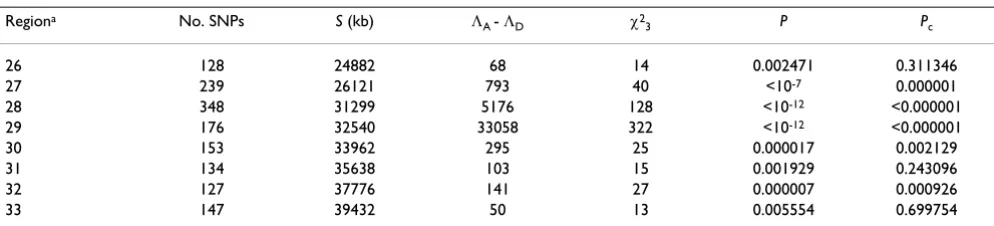
Fourteen out of 126 regions showed nominal significant association with RA (p < 0.05), among which eight con-secutive regions spanned Loci C and D (Table 1). Five regions remained significant after Bonferroni correction, among which four surrounded or spanned Locus C, and one covered Locus D (Table 1). Locus C was inside the most significant region 29. Therefore, the three regions surrounding Locus C with less significance levels must be the result of LD between variant C and other SNPs. The discontinuity of significance surrounding region 32 indi-cated that this region harbored another disease locus and indeed, this was where Locus D lies. Therefore, we success-fully detected Loci C and D in the initial analysis. The low-est p for the rest of the regions was 0.0064. Given that there were no other disease loci, the approach had a right type I error rate (6/118 = 0.05). A lesson learned was that when there was long-range LD, consecutive regions
show-ing association may reflect one instead of several disease loci. As an alternative to merging regions, we studied the impact of region length on accuracy (see below).
S for Locus C was reasonably accurate (55 kb apart from true location using LD map). However, the location error was 542 kb for Locus D and the 95% confidence interval did not include Locus D. Removing 10 SNPs showing sig-nificant LD with variant C did not change the results. We then divided region 32 into two or three sub-regions. Again, we did not detect significant association in the middle part where Locus D lies, although we detected the associations in the first and third sub-regions where two clusters of highly significant SNPs lay. Because Locus D is rare, the removal of rare SNPs may have had an effect. We then added rare SNPs and used the corresponding LD map and ε values, and the location accuracy was markedly improved for Locus D (Table 2). Among the added rare SNPs, three were highly associated with the disease: denseSNP6_3931, _3933, and SNP6_162 (χ2
1 = 118, 116,
and 116, respectively). It is therefore a mistake to remove rare SNPs (MAF < 0.05) in association analysis. This was in contrast to the HapMap project in which the focus was on common SNPs. However, inclusion of rare SNPs resulted in higher location error for common disease Locus C (Table 2).
Occasionally or under high marker density, the kilobase map performed better than the LD map, presumably because every SNP has a unique physical location, whereas several SNPs could have the same LDU location in LD blocks. The tilted LD map improved the location accuracy for Locus C, although not for Locus D (Table 2).
In practice, the phenomenon in this simulated data set may be too extreme. On the other hand, it is possible that several disease loci can be closely located. To distinguish such loci is a challenge to genetic epidemiologists. Under this circumstance, single SNP association plus a gene functional study may be useful.
Table 1: Association mapping of disease Loci C and D on chromosome 6
Regiona No. SNPs S (kb) Λ
A - ΛD χ23 P Pc
26 128 24882 68 14 0.002471 0.311346
27 239 26121 793 40 <10-7 0.000001
28 348 31299 5176 128 <10-12 <0.000001
29 176 32540 33058 322 <10-12 <0.000001
30 153 33962 295 25 0.000017 0.002129
31 134 35638 103 15 0.001929 0.243096
32 127 37776 141 27 0.000007 0.000926
33 147 39432 50 13 0.005554 0.699754
aA segment of consecutive regions of 10 LDUs showing nominal significant association with RA (p < 0.05). See Methods for the meaning of other
symbols. Loci C and D were in regions 29 and 32 at locations of 32485 and 37234 kb, respectively.
bP
SNP density based on the order
As density decreases, location error increases whether using single or multi-SNP approaches when the disease variant was not "typed" (Table 3). There was an improve-ment in accuracy when the disease variant was included. In most cases, using the LD map resulted in greater accu-racy than using the kilobase map, especially when the marker density was low. We also selected SNPs on the scale of one to the hundredth or even the thousandth. As long as there was one SNP highly associated with the dis-ease (e.g., χ2
1 = 27), the association was detectable, but
much compromised by precision as a result of low SNP density. These data are unusual in that the association of Locus C is extremely significant and probably would not be observed in the real data.
Although mapping accuracy decreases with marker den-sity, even with 1/30 the number of SNPs, corresponding to a 10 K GWA scan, we could still detect Locus C (Table 3). Single SNP tests depend heavily on whether the dis-ease variant is typed. It has less predictive value for accu-racy because the SNP with maximal χ2 is not necessarily
the closest SNP to the disease variant. In contrast,
meth-ods that combine information from multiple markers pre-dict the location of the disease variant better than single SNP tests because the location is less influenced by any single SNP effects. A multi-marker approach may there-fore be more robust to genotyping errors.
We expect that the mapping accuracy will be improved further in maps with higher marker density than that assessed in this paper, such as the commercially available 500 K or more genotyping platforms for GWA studies.
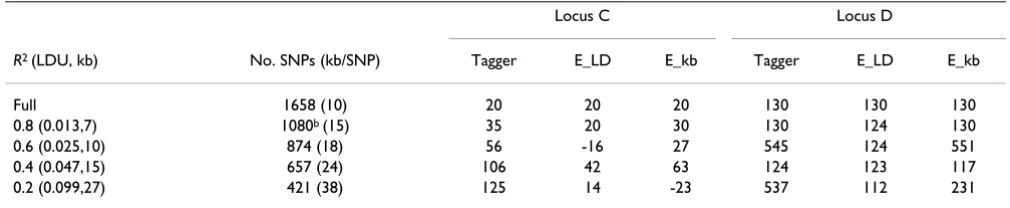
SNP density based on tagging or equidistance
For the 15,805.710 kb candidate region spanning both Loci C and D, we compared location accuracy using SNPs selected with Tagger or by equidistance of LDU or kilo-bases (Table 4). SNPs based on equal LDU provided higher location accuracy than those based on equal kilo-base distance. Equidistance generally provided higher accuracy than tagging SNP selection. Again, reducing SNP density decreases the prediction accuracy of disease Loci C and D, but this was minimally affected by selection based on equal LD distance (Table 4).
Table 3: Density and accuracy for Locus C – SNP selection by order
msSNP Location error by the composite likelihood approach
Causal SNP out Causal SNP in
SNP density (kb/SNP) No. SNPs No. regions χ2
1 Location error LD kb LD kb
Full (11) 15701 126 2324 153 57 13 55 14
1/2 (22) 7850 125 1762 -2 5 -19 5 -20
1/3 (33) 5233 118 2324 153 153 40 6 40
1/4 (44) 3925 106 1762 -2 -65 -56 -57 -53
1/5 (54) 3140 94 2274 42 -24 -35 -15 -36
1/6 (65) 2616 82 1285 20 20 20 10 15
1/8 (87) 1962 64 1601 65 -58 -64 -47 -58
1/10 (109) 1570 52 726 -106 -55 -59 -24 -46
1/15 (163) 1046 34 486 -887 294 26 0 3
1/20 (217) 785 26 726 -106 -97 -160 -26 -43
1/25 (272) 628 20 348 -9 69 -120 60 -79
1/30 (326) 523 17 229 188 362 -25 0 -25
Disease variant C (χ2
1 = 1916) was not present except in the full data set or specified. Table 2: Candidate regions of disease Loci C and D with rare SNPs included
Location error with rare SNPs
Locus Map S (kb) ΛA - ΛD χ23 p Included Removed
C LD 32557 30693 360 <10-12 72 55
LD, tilt 32518 30799 197 <10-12 34 21
kb 32506 28632 496 <10-12 22 14
D LD 37358 154 22 0.000017 124 542
LD, tilt 37368 156 28 0.000003 130 546
Sample size and region length
We analyzed different sample sizes based on the combina-tion of 500, 1000, 1500, and 2000 cases or controls. Despite variations in location errors for Locus C, there was no clear trend to draw any meaningful conclusion. For Locus D, however, a high degree of accuracy appeared to be maintained when the data sets had over 1000 cases and 1500 controls. Therefore, large samples are needed for detecting rare disease loci.
With Locus C being centred, we studied region lengths from 0.2 up to 30 LDUs, with the latter starting in region 27 and ending in region 30. The location error was rela-tively stable but extremely small or large LDU lengths resulted in increased error. The region lengths in LDUs (location errors in kilobases) were 0.2 (107), 1 (5), 2 (82), 4 (5), 6 (5), 8 (5), 10 (5), 12 (-10), 14 (-10), 16 (-13), 18 (-14), 20 (-14), and 30 (-68). We therefore recommend 10-LDU for the maximal length while maintaining mini-mal error. Increasing the number of SNPs also linearly increases the computing load [3].
Fixing region length had no appreciable impact on loca-tion accuracy at high density, but the errors were greater than let-the-program-decide regions at low density (data not shown).
Conclusion
We successfully detected disease Loci C and D in the sim-ulated dense chromosome 6 data using the Malecot model and composite likelihood approach. Decreasing SNP density compromises accuracy of association map-ping. This multi-marker approach has many advantages. Firstly, it markedly decreases the number of tests in GWA studies, avoiding heavy penalty for multiple testing. Sec-ondly, it predicts the disease loci more accurately than sin-gle SNP association tests. We also demonstrated that SNP selection by equal LD distance outperforms that by tag-ging or equal kilobase distance in the accuracy of associa-tion mapping. Finally, we conclude that excluding rare
SNPs significantly decreases the power and accuracy in mapping rare disease loci.
Competing interests
The author(s) declare that they have no competing inter-ests.
Acknowledgements
WZ was supported by the Institute of Cancer Research, Sutton, Surrey, UK. WL, CH, and T-YK were supported by Ph.D. studentships funded by the University of Southampton, Shanghai Jiaotong University, and the Tai-wan Ministry of Education, respectively.
This article has been published as part of BMC Proceedings Volume 1 Sup-plement 1, 2007: Genetic Analysis Workshop 15: Gene Expression Analysis and Approaches to Detecting Multiple Functional Loci. The full contents of the supplement are available online at http://www.biomedcentral.com/ 1753-6561/1?issue=S1.
References
1. Morton NE, Maniatis N, Zhang W, Ennis S, Collins A: Genome scan-ning by composite likelihood. Am J Hum Genet 2007, 80:19-28. 2. Gomes I, Collins A, Lonjou C, Thomas NS, Wilkinson J, Watson M,
Morton N: Hardy-Weinberg quality control. Ann Hum Genet
1999, 3:535-538.
3. Lau W, Kuo TY, Tapper W, Cox S, Collins A: Exploiting large scale computing to construct high resolution linkage disequi-librium maps of the human genome. Bioinformatics 2007, 23:517-519.
4. Carlson CS, Eberle MA, Rieder MJ, Yi Q, Kruglyak L, Nickerson DA: Selecting a maximally informative set of single-nucleotide polymorphisms for association analyses using linkage dise-quilibrium. Am J Hum Genet 2004, 74:106-120.
Table 4: Density and accuracy – SNP selection by tagging or equidistancea
Locus C Locus D
R2 (LDU, kb) No. SNPs (kb/SNP) Tagger E_LD E_kb Tagger E_LD E_kb
Full 1658 (10) 20 20 20 130 130 130
0.8 (0.013,7) 1080b (15) 35 20 30 130 124 130
0.6 (0.025,10) 874 (18) 56 -16 27 545 124 551
0.4 (0.047,15) 657 (24) 106 42 63 124 123 117
0.2 (0.099,27) 421 (38) 125 14 -23 537 112 231
aLocation error for SNPs selected by Tagger or equal LDU (E_LD) or kb (E_kb) distance in a candidate region of 15805.710 kb with rare SNPs
included. Regions were fixed at 10 LDUs for Loci C (30997–33398 kb) and D (36784–37792 kb). Disease variant C was not present except in the full data set. Tilted LD map.