P R O C E E D I N G S
Open Access
Comparing strategies for combined testing
of rare and common variants in whole
sequence and genome-wide genotype data
Dörthe Malzahn
*, Stefanie Friedrichs and Heike Bickeböller
FromGenetic Analysis Workshop 19 Vienna, Austria. 24-26 August 2014
Abstract
We used our extension of the kernel score test to family data to analyze real and simulated baseline systolic blood pressure in extended pedigrees. We compared the power for different kernels and for different weightings of genetic markers. Moreover, we compared the power of rare and common markers with 3 strategies for joint testing and on marker panels with different densities. Marker weights had much greater influence on power than the kernel chosen. Inverse minor allele frequency weights often increased power on common markers but could decrease power on rare markers. Furthermore, defining the gene region based on linkage disequilibrium blocks often yielded robust power of joint tests of rare and common markers.
Background
The kernel score test is a global covariate-adjusted mul-tilocus procedure that tests for overall association of sets of markers (see Schaid [1] for a review). This reduces the multiple-testing burden. Tested marker sets can, for example, belong to a pathway or candidate gene. The kernel score test can be applied to common and rare variants alike, as well as to data of genome-wide associ-ation studies (GWAS) or sequence data where it is named SKAT (sequence kernel association test). The kernel score test was developed for independent subjects [1]. Recent contributions by others and ourselves [2–6] extended the kernel score test to family data.
The kernel is chosen to describe genetic correlation among subjects. Different kernels have been suggested for genetic epidemiological applications. These kernels differ in whether marker–marker interactions are mod-eled and how complex the interaction effects may be. A frequent choice is to apply the kernel function on weighted minor allele dosage data (thus using an
additive coding of minor allele effects). The dosage weights increase with decreasing minor allele frequency corresponding to the a priori assumption that less-frequent variants may have larger effects. Weighting al-lows rarer variants to contribute more to the overall test despite of their low frequencies.
With appropriate weighting, rare and common vari-ants may be entered together into the kernel for joint testing. Recently however, Ionita-Laza et al. [7] proposed alternatives that can be more powerful. We explored these alternative joint tests on rare and common variants in the Genetic Analysis Workshop 19 (GAW19) family data. Moreover, we compared the power of different marker weights and kernels on sequence and GWAS panels. As we focused on genes, we also explored how size or positioning of a flanking region affects the test power.
Methods Data
We analyzed baseline systolic blood pressure (SBP) and dosage data in the extended Mexican American pedi-grees of the GAW19 family data, which are identical to the Genetic Analysis Workshop 18 data [8]. As before
* Correspondence:dmalzah@gwdg.de
Department of Genetic Epidemiology, University Medical Center, Georg-August University Göttingen, Humboldtallee 32, 37073 Göttingen, Germany
[6], we considered subjects with known baseline SBP and baseline diastolic blood pressure, sex, and age, who were not on blood pressure medication (real SBP: 706 subjects, excluding the first listed monozygotic twin of 2 observed twin pairs; simulated SBP: 740 to 781 subjects, numbers vary for 200 simulated study replicates because of inclusion criteria). For real SBP, we considered candi-date geneAGTR1 [9] on chromosome (chr) 3 that tends to associate with SBP in the present family sample [6]. For simulated SBP, we selected from the simulation an-swers 5 strongly associated genes with various linkage
disequilibrium (LD) structures: MAP4 (very
homoge-neous LD, chr3) and, in the order of increasing variabil-ity of LD,TNN (chr1), FLT3 (chr13), LEPR (chr1), and
GSN (chr9). We used NCBI build 37, International
Haplotype Map Project (HapMap) [10] reference data for Mexican Americans and the default algorithm in Haploview 4.2 [11] with a required fraction of strong LD of 0.7 and confidence interval limits of 0.5 and 0.8 to de-termine LD-blocks based on the D’ measure. Gene re-gions were defined as the LD-block(s) that contained the gene. For AGTR1, we also considered the region from the first to the last exonic position and flanking regions of 30 kb or 500 kb. For the same subjects, we used 2 single-nucleotide polymorphism (SNP) panels: sequence (allele dosage data) and GWAS (allele dosage data re-duced to GWAS SNPs). Biallelic SNPs were included for testing if their Hardy-Weinberg equilibrium testpvalues were equal to or greater than 10−5 (rounding imputed dosages for this purpose only) and if at least 7 observa-tions of the minor allele were present in the sample. The latter parallels minimum data requirements in paramet-ric regression.
Kernel score test for family data
Here we briefly summarize our method introduced in [6], denoting vectors and matrices by bold letters. Base-line SBP is right-skewed distributed and was therefore rank-normalized by Blom transformation [12] to stand-ard normally distributed target variablesY= (Y1,…,Yn).Y
depend on fixed covariate effectsb(intercept, age, sex, age × sex interaction), random effectsc that adjust for familial polygenic background, a semiparametric model
h(G) of genetic markersG, and regression residualse~
N(0,s2I) with residual variance s2.
Y¼XbTþZcTþh Gð Þ þe ð1Þ
X, Zare the design matrices for fixed covariate effects and random family effects.h(G) =KaTdepends on an×n dimensional kernel matrix K of genetic similarities be-tweennsubjects on markersG, and multivariate normally distributed random effectsa~N(0,τK) [1]. One tests for a genetic covariance componentτ.
The kernel score test is computed from restricted maximum likelihood parameter estimates of the genetic null model (where h(G) =0). Thus, the null model esti-mates fixed covariate effectsbo, random pedigree effects co, the variance s2famof the polygenic familial component,
and the residual variance s2o. The null model was
ad-justed for polygenic familial background based on the kinship coefficient matrix Φkin=ZZT using R-packages
kinship2 and coxme with R-function lmekin. The kernel score test statistic is.
Q ¼RTMR ð2Þ
R=Po1/2Y are standard normally distributed residuals
and matrix M =(Po1/2K Po1/2)/2 incorporates the kernel
[6].Po= Vo−1–Vo−1X(XTVo−1X)−1XTVo−1is the null
projec-tion matrix withVo= s2oI+ s2famZZT. Thepvalues for test
statistic (2) were calculated by Davies’exact method [13] with the R package CompQuadForm from sample esti-mates Q and all eigenvalues of matrixM.
Kernels and single-nucleotide polymorphism weights We applied all kernel functions on allele dosage datagi,gj
(for pairs of subjects i, j) on NSNPbiallelic SNP markers.
The kernel matrix entries are
Linear kernel Kij¼giTWgj ð3Þ
Radial basis function RBFð Þkernel Kij
¼ exp −μ−1 gi−gj
T
W g i−gj
ð4Þ
with diagonal weight matrix W. The linear kernel (3) does not allow for SNP interactions opposed to the RBF kernel (4), which yields polynomial models. Dosage weights are normed Wmm= f(νm)/∑mf(νm) for any
chosen SNP set m = 1,…,NSNPand depend on the minor
allele frequency (MAF)νof the respective SNP. We con-sidered: f(νm) = 1 (treating SNPs alike), f(νm) = 1/νm, as
well as f(νm) =Beta(νm,1,25) forνmequal to or less than
5 % and f(νm) =Beta(νm,0.5,0.5) for νm greater than 5 %
as suggested earlier [7].Beta-density weights distinguish MAFs more moderately than 1/ν-weights. For the RBF kernel (4), the scale parameter μ was the average weighted squared genetic difference between subjects Σi,j((gi-gj)TW(gi-gj))/n2multiplied by the effective
num-ber of independent SNPs in the tested set [14].
Strategies for combined testing of common and rare variants
By default, the kernel score test, Eq. (2), is performed with a kernel matrixKallcomputed on all dosages with a
weighting of common and rare SNPs.
and for common SNPs (Kcommon), respectively, in a region
of interest. Analogous to Eq. (2), this yields matricesMrare, Mcommon, test statistics Qrare, Qcommon, andpvaluesprare, pcommon. The null model,PoandRwere always the same.
The weighted sum test (WS) on common and rare vari-ants has test statistic [7].
QWS¼ ð1–φÞ⋅Qrareþ φ⋅Qcommon ð5Þ
Weight φ= (tr(Mrare∙Mrare)/(tr(Mrare∙Mrare) + tr
(Mcommon∙Mcommon)))1/2 may be chosen such that (1−φ)∙
Qrareand φ∙Qcommonhave the same variance.P values are
obtained by Davies’ exact method from sample esti-mates QWSand all eigenvalues of matrix ((1−φ)∙Mrare+ φ∙Mcommon). Alternatively, Fisherspvalue pooling can be
applied.
QFISHER¼−2lnðprareÞ−2lnðpcommonÞ ð6Þ
Under H0, QFISHER/(1 + 0.25∙cov) is chi-square distributed
with 16/(4 +cov) degrees of freedom [7]. With r = tr(Mrare∙ Mcommon)/(tr(Mrare∙Mrare)∙tr(Mcommon∙Mcommon))1/2, the
co-variance betweenprareandpcommoniscov≈r∙(3.25 + 0.75∙r)
for 0≤r≤1 andcov≈r∙(3.27 + 0.71∙r) for−0.5≤r≤0. Only test statistic (6) yields approximate p values; all
other p values are obtained with Davies’ method and are exact.
Results and discussion
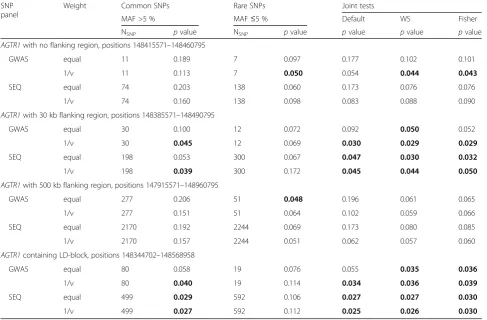
Our test extension to families holds the nominal signifi-cance level and correctly adjusts for a polygenic familial variance component (as demonstrated in [6]). Table 1 lists thepvalues obtained for association testing ofAGTR1on real SBP, considering common SNPs (MAF >5 %) and rare SNPs (MAF≤5 %) as well as 3 joint tests (default testKall,
WS, Fisher). Beta-weights (not shown) performed be-tween equal weights and 1/ν-weights. The 1/ν-weight
low-ered p values particularly on common SNPs. AGTR1
association is suggested by common as well as rare SNPs. Joint testing of rare and common SNPs was beneficial. In particular, WS and Fisher testpvalues were often smaller (and otherwise close to) the smallestpvalue of the separ-ate rare and common SNP tests. When using ad hoc defi-nitions of the AGTR1 flanking region, Fisher and WS p values remained relatively stable and were also smaller compared to the default testKall. However, on theAGTR1
containing LD-block all joint tests performed highly simi-lar,pvalues were the smallest and also relatively stable re-gardless of SNP weights and SNP density.
Table 1Analysis of real data: real SBP and candidate geneAGTR1
SNP panel
Weight Common SNPs Rare SNPs Joint tests
MAF >5 % MAF≤5 % Default WS Fisher
NSNP pvalue NSNP pvalue pvalue pvalue pvalue
AGTR1with no flanking region, positions 148415571–148460795
GWAS equal 11 0.189 7 0.097 0.177 0.102 0.101
1/ν 11 0.113 7 0.050 0.054 0.044 0.043
SEQ equal 74 0.203 138 0.060 0.173 0.076 0.076
1/ν 74 0.160 138 0.098 0.083 0.088 0.090
AGTR1with 30 kb flanking region, positions 148385571–148490795
GWAS equal 30 0.100 12 0.072 0.092 0.050 0.052
1/ν 30 0.045 12 0.069 0.030 0.029 0.029
SEQ equal 198 0.053 300 0.067 0.047 0.030 0.032
1/ν 198 0.039 300 0.172 0.045 0.044 0.050
AGTR1with 500 kb flanking region, positions 147915571–148960795
GWAS equal 277 0.206 51 0.048 0.196 0.061 0.065
1/ν 277 0.151 51 0.064 0.102 0.059 0.066
SEQ equal 2170 0.192 2244 0.069 0.173 0.080 0.085
1/ν 2170 0.157 2244 0.051 0.062 0.057 0.060
AGTR1containing LD-block, positions 148344702–148568958
GWAS equal 80 0.058 19 0.076 0.055 0.035 0.036
1/ν 80 0.040 19 0.114 0.034 0.036 0.039
SEQ equal 499 0.029 592 0.106 0.027 0.027 0.030
1/ν 499 0.027 592 0.112 0.025 0.026 0.030
Association ofAGTR1with real SBP was tested with a linear kernel on minor allele dosage data for GWAS and sequence (SEQ);p≤0.05 bold. NSNPcommon and
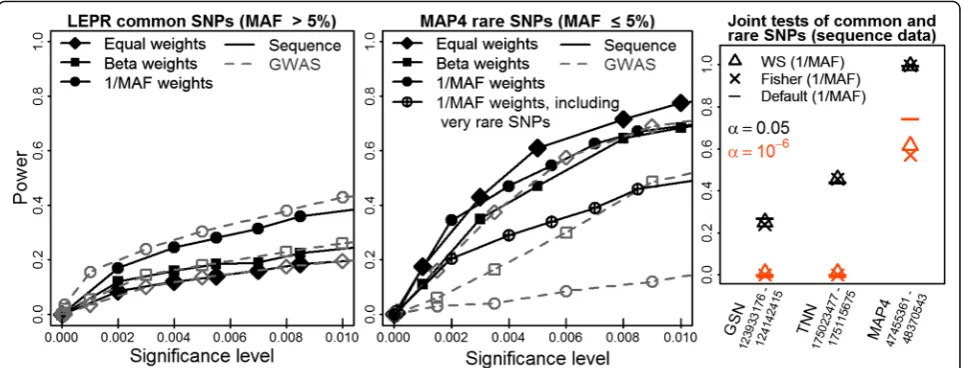
Next, we analyzed LD-blocks that contain the genes
MAP4,TNN, LEPR, GSN, orFLT3. Figure 1 displays the average test power on 200 data replicates of simulated SBP. Sequence-derived variants were often more powerful than GWAS with some exceptions (Fig. 1 left and middle panels, black solid lines vs. gray dashed lines). The best were often 1/ν-weights (circle), otherwise equal weights (diamond) were favored. Particularly 1/ν-weights may be beneficial on common SNPs(LEPR)and occasionally det-rimental on rare SNPs (MAP4). The latter is an excep-tional finding but consistent with Table 1 on candidate gene AGTR1. On rare MAP4 SNPs, 1/ν-weights lowered the power, especially when testing also extremely rare SNPs (encircled plus), but less so when testing only MAF equal to or less than 5 % SNPs that had at least 7 observa-tions of the minor allele (filled circle; sequence data). On gene-containing LD-blocks, all joint tests (default testKall,
WS, Fisher) often had similar power (Fig. 1, right panel:
LEPR, FLT3,TNNwith highly similar results [only TNN shown];GSNsequence). However, default testKallwas the
most powerful test on the gene with homogeneous strong
LD (MAP4: sequence [Fig. 1, right] and GWAS [not
shown]) and on the gene with the most variable LD struc-ture (GSN: when using GWAS SNPs, not shown). Then,
Kall likely exploited SNP correlations better. When
LD-blocks were enlarged by flanking regions, WS and Fisher often were slightly more powerful than Kall (results not
shown). The linear kernel had always similar or better power than the RBF kernel (results not shown).
Conclusions
As the power of kernel methods increases through the exploitation of SNP correlations [2], this ability should
be utilized fully by analyzing LD-blocks. SNP weights have a far greater impact on test power than the kernel chosen. Currently, the benefit of 1/ν-weights may be underesti-mated for common SNPs. On rare SNPs, 1/ν-weights often improve power, but can also be detrimental. Findings are consistent with both real and simulated data. Our results suggest using 1/ν-weights on all SNPs in a single kernel
Kalltesting LD-blocks and only SNPs with sufficient minor
allele observations. Alternatively, one may use WS with 1/ν-weights on common SNPs and equal weights on rare SNPs in the kernels. WS upweights the rare variant contri-bution globally; see Eq. (5).
Acknowledgements
This work was supported by the Deutsche Forschungsgemeinschaft DFG (grant Klinische Forschergruppe [KFO] 241: TP5, BI 576/5-1; grant Research Training Group“Scaling Problems in Statistics”RTG 1644).
Declarations
This article has been published as part ofBMC ProceedingsVolume 10 Supplement 7, 2016: Genetic Analysis Workshop 19: Sequence, Blood Pressure and Expression Data. Summary articles. The full contents of the supplement are available online at http://bmcproc.biomedcentral.com/articles/supplements/ volume-10-supplement-7. Publication of the proceedings of Genetic Analysis Workshop 19 was supported by National Institutes of Health grant R01 GM031575.
Authors’contributions
Authors contributed as follows: study concept, DM and HB; data extraction and analysis, DM and SF; SNP mapping with NCBI build 37 and LD calculations, SF; and writing of the manuscript, DM. All authors read and approved the final manuscript.
Competing interests
The authors declare that they have no competing interests.
Published: 18 October 2016
Fig. 1Test power on simulated SBP may greatly depend on SNP weights.Leftandmiddle panels:Power of the kernel score test over 200 study replicates of simulated SBP as function of the significance level for different SNP weights and SNP panels.Right panel:Power of joint tests of rare and common SNPs at 2 significance levelsα= 0.05, 10−6when using 1/
References
1. Schaid DJ. Genomic similarity and kernel methods I: advancements by building on mathematical and statistical foundations. Hum Hered. 2010;70(2):109–31.
2. Schifano ED, Epstein MP, Bielak LF, Jhun MA, Kardia SL, Peyser P, Lin X. SNP set association analysis for familial data. Genet Epidemiol. 2012;36(8):797–810.
3. Chen H, Meigs JB, Dupuis J. Sequence kernel association test for quantitative traits in family samples. Genet Epidemiol. 2013;37(2):196–204. 4. Oualkacha K, Dastani Z, Li R, Cingolani PE, Spector TD, Hammond CJ,
Richards JB, Ciampi A, Greenwood CM. Adjusted sequence kernel association test for rare variants controlling for cryptic and family relatedness. Genet Epidemiol. 2013;37(4):366–76.
5. Huang J, Chen Y, Swartz MD, Ionita-Laza I. Comparing the power of family-based association test for sequence data with applications in the GAW18 simulated data. BMC Proc. 2014;8 Suppl 1:S27.
6. Malzahn D, Friedrichs S, Rosenberger A, Bickeböller H. Kernel score statistic for dependent data. BMC Proc. 2014;8 Suppl 1:S41.
7. Ionita-Laza I, Lee S, Makarov V, Buxbaum JD, Lin X. Sequence kernel association tests for the combined effect of rare and common variants. Am J Hum Genet. 2013;92(6):841–53.
8. Almasy L, Dyer TD, Peralta JM, Jun G, Wood AR, Fuchsberger C, Almeida MA, Kent Jr JW, Fowler S, Blackwell TW, et al. Data for Genetic Analysis Workshop 18: human whole genome sequence, blood pressure, and simulated phenotypes in extended pedigrees. BMC Proc. 2014;8 Suppl 1:S2. 9. Baudin B. Polymorphism in angiotensin II receptor genes and hypertension.
Exp Physiol. 2005;90(3):277–82.
10. The International HapMap Consortium. The International HapMap project. Nature. 2003;426(6968):789–96.
11. Barrett JC, Fry B, Maller J, Daly MJ. Haploview: analysis and visualization of LD and haplotype maps. Bioinformatics. 2005;21(2):263–5.
12. Blom G. Statistical estimates and transformed beta variables. New York: John Wiley & Sons; 1958.
13. Davies RB. Algorithm AS 155: the distribution of a linear combination of chi-2 random variables. J R Stat Soc: Ser C: Appl Stat. 1980;29(3):323–33. 14. Cheverud JM. A simple correction for multiple comparisons in interval
mapping genome scans. Heredity (Edinb). 2001;87(Pt 1):52–8.
• We accept pre-submission inquiries
• Our selector tool helps you to find the most relevant journal
• We provide round the clock customer support • Convenient online submission
• Thorough peer review
• Inclusion in PubMed and all major indexing services
• Maximum visibility for your research
Submit your manuscript at www.biomedcentral.com/submit