Journal of Pain Research
Pain point system scale (PPSS): a method
for postoperative pain estimation in retrospective
studies
Anastasia Gkotsi1
Dimosthenis Petsas2
Vasilios Sakalis3
Asterios Fotas3
Argyrios Triantafyllidis3
Ioannis Vouros3
Evangelos Saridakis2
Georgios Salpiggidis3
Athanasios Papathanasiou3 1Department of Experimental
Physiology, Aristotle University of Thessaloniki, Thessaloniki, Greece;
2Department of Anesthesiology, 3Department of Urology,
Hippokration General Hospital, Thessaloniki, Greece
Correspondence: Dimosthenis Petsas Karavaggeli 49, Pilaia, Thessaloniki 55535, Greece
Tel +30 231 035 1416 Mobile +30 694 993 8952
Email dpets_anesthesia@hotmail.com
Purpose: Pain rating scales are widely used for pain assessment. Nevertheless, a new tool is required for pain assessment needs in retrospective studies.
Methods: The postoperative pain episodes, during the first postoperative day, of three patient groups were analyzed. Each pain episode was assessed by a visual analog scale, numerical rating scale, verbal rating scale, and a new tool – pain point system scale (PPSS) – based on the analgesics administered. The type of analgesic was defined based on the authors’ clinic protocol, patient comorbidities, pain assessment tool scores, and preadministered medications by an artificial neural network system. At each pain episode, each patient was asked to fill the three pain scales. Bartlett’s test and Kaiser–Meyer–Olkin criterion were used to evaluate sample sufficiency. The proper scoring system was defined by varimax rotation. Spearman’s and Pearson’s coefficients assessed PPSS correlation to the known pain scales.
Results: A total of 262 pain episodes were evaluated in 124 patients. The PPSS scored one point for each dose of paracetamol, three points for each nonsteroidal antiinflammatory drug or codeine, and seven points for each dose of opioids. The correlation between the visual analog scale and PPSS was found to be strong and linear (rho: 0.715; P , 0.001 and Pearson: 0.631;
P , 0.001).
Conclusion: PPSS correlated well with the known pain scale and could be used safely in the evaluation of postoperative pain in retrospective studies.
Keywords: pain scale, retrospective studies, pain point system scale
Introduction
Pain is a common symptom of any illness, and is defined by the International Asso-ciation for the Study of Pain as “an unpleasant sensory and emotional experience associated with either actual or potential tissue damage, or described in terms of such
damage.”1,2 The alerting function of pain evokes protective responses and is intended
to keep tissue damage to a minimum.3 Postoperative pain is an expected and inevitable
symptom in a surgical patient associated with surgical tissue damage, the presence of drains and tubes, postoperative complications, or a combination of the above
mentioned.2,4,5 The physiological consequences comprise the activation of the “stress
response,”2 evoking respiratory, cardiovascular, thromboembolic, gastrointestinal,
musculoskeletal, and psychological complications.2,6–12 To ease recovery, functional
ability, and to reduce postoperative morbidity, pain should be treated as adequately as possible. Careful monitoring by the surgeon or anesthesiologist can result in more
effective control of postoperative pain.13 Pain is a subjective sensation that can be
described according to several relevant features or attributes such as quality, location,
Dove
press
O R I G I n A L R E S E A R C H
open access to scientific and medical research
Open Access Full Text Article
Journal of Pain Research downloaded from https://www.dovepress.com/ by 118.70.13.36 on 24-Aug-2020
For personal use only.
Number of times this article has been viewed
This article was published in the following Dove Press journal: Journal of Pain Research
intensity, aversiveness, emotional impact, and frequency.13 Among these attributes, intensity is recognized as one of the relevant clinical dimensions of the pain experience.14 Various rating scales have been described to measure pain intensity that are partially subjective, with difficulties in administra-tion to patients with special needs.15 Such scales include the visual analog scale (VAS), numerical rating scale (NRS), and verbal rating scale (VRS).
The pain point system scale (PPSS) was introduced to overcome the drawbacks involved in postoperative pain intensity assessment and when objective pain assessment is desired for study purposes but there is no available data (due to lack of communication with patient or patient’s inability to recall). The PPSS inputs the type of analgesics administered and scores each given dose separately. The total postopera-tive pain score or the score of each pain episode can be used for evaluation. The scoring system is based on the analgesic ladder proposed by the World Health Organization as a step approach to pain management.16 It classifies analgesics into three groups. The first group comprises nonnarcotic weak analgesics (paracetamol/acetaminophen), the second group comprises nonnarcotic nonsteroidal antiinflammatory drugs and weak narcotics (codeine), and the third group comprises strong narcotic analgesics (Table 1). Specifically, one dose of paracetamol 600 mg equals 1 point; a dose of paracetamol 500 mg plus 10 mg codeine equals 3 points; each dose of a nonsteroidal antiinflammatory drug (diclofenac 75 mg, pare-coxib 40 mg, or lornoxicam 8 mg) equals 3 points; and each dose of an opioid (tramadol 50 mg or dextropropoxyphene hydrochloride 75 mg or pethidine hydrochloride 50 mg) equals 7 points.
This study was designed to detect the correlation between the PPSS and the commonly used pain scales
(VAS, NRS, and VRS), and to determine its validity for use in retrospective studies.
Patients and methods
This prospective cross-sectional study was performed on postoperative patients admitted to the Urology Department of Hippokration General Hospital (Thessaloniki, Greece) for a scheduled operation from March to October 2011.The patients underwent a variety of procedures (Table 2). This research was approved by the local ethics committee accord-ing to the principles of the Declaration of Helsinki on ethical principles of medical research.
Participants
Patients were randomly selected and recruited. Preoperative exclusion criteria were the inability to read or speak Greek, impaired cognitive function, performance status of at least
two according to the Zubrod scale,17 emergency procedures,
chronic administration of analgesics, and chronic opioid or substance abuse. Postoperatively, all patients with continuous epidural or intravenous analgesia or a drop in hemoglobin level to ,7 g/dL, patients who were temporally or spatially disoriented or unable to recognize familiar persons, as well as those with pain episodes that were encountered without medications (eg, bladder flushing or fixing catheter’s bal-loon), were excluded. To eliminate recall bias, patients were allocated into three groups according to the method of anesthetic administration (ie, local infiltration, spinal, or general anesthesia).
Measures
VASThe VAS is presented as a 10 cm horizontal line, anchored by verbal descriptors labeled with “no pain” at point zero (0 cm) and “worst imaginable pain” at point ten (10 cm). The patient marks the line at the point corresponding to the intensity of the pain currently experienced. Using a 1 cm-per-point scale to measure the patient’s score, the VAS provides ten levels of pain intensity.18 Although line orientation is important, the horizontal VAS was chosen for the current study, as the reading and writing tradition for Greek people is horizontal, from left to right.18,19
nRS
The NRS is an applied pain scale describing zero as “no pain” and ten as “worst imaginable pain.” The NRS is a horizontal line marked with numbers from zero to ten. The patient is asked to circle the currently experienced intensity of pain.
Table 1 Scoring algorithm of pain point system scale based on administered drugs in the early postoperative period
Drug PPSS score
(points/dose)
Paracetamol (acetaminophen) 600 mg 1 Paracetamol 500 mg + codeine 10 mg 3 nSAIDs
Diclofenac 75 mg Parecoxib 40 mg Lornoxicam 8 mg
3
Opioids
Tramadol 50 mg
Dextropropoxyphene hydrochloride 75 mg Pethidine hydrochloride 50 mg
7
Abbreviations: NSAIDs, nonsteroidal antiinflammatory drugs; PPSS, pain point system scale.
Dovepress
Gkotsi et al
Journal of Pain Research downloaded from https://www.dovepress.com/ by 118.70.13.36 on 24-Aug-2020
VRS
VRS comprises a list of adjectives used to denote increasing pain intensities. The most common words used are no pain, mild pain, moderate pain, and severe/excruciating pain. For
ease of recording, these adjectives are assigned numbers.18
PPSS
PPSS is the proposed scale system for the assessment of post-operative pain in retrospective studies. The score is obtained as a summation of points for each analgesic administered (via the intravenous route in the current study). The proposed scale is to be used in a clearly comparative manner, compar-ing pain intensity scores in retrospective studies to extract conclusions regarding factors affecting pain. It does not offer specific correlation of a score with a given level of pain.
A wide-edge writing pen, 3 mm thick, was provided to accommodate writing difficulties and any sensory impair-ment related to anesthetic recovery (minimizing patients’ effort to be precise). Each questionnaire was given on a separate A4 size paper with Times New Roman, size 20 font. Nonetheless, the VAS line was always exactly 10 cm long. The scales were completed in the presence of the research
assistant, who gave all necessary instructions. The scale was removed from the patient’s view after rating their pain intensity to exclude memory recall from the patient before the next scale was presented. The exact technique described by Gagliese et al was followed.20
Postoperative pain management
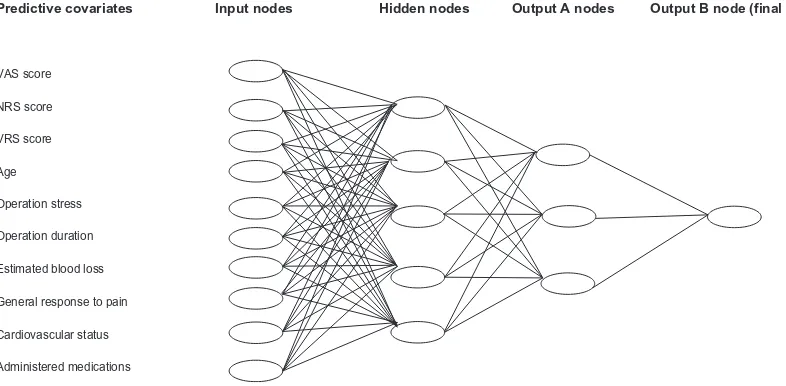
An artificial neural network was developed for drug administration decision-making purposes in the current study, according to the perioperative care guidelines of the authors’ hospital (Figure 1).21 The artificial neural network was developed in MATLAB R2009b (The MathWorks, Inc, Natick, MA).
The output was divided in two groups of nodes. Output A represented the three basic categories of analgesics: weak nonnarcotic analgesics, strong nonnarcotic nonsteroidal anti-inflammatory drugs or weak narcotics, and strong narcotics. Output B represented the final decision.
Procedure
At the time of admission, prior to the informed consent, the recruited patients were informed and each pain scale was
Table 2 Demographic and baseline characteristics of the patient groups
First group:
local infiltration anesthesia
Second group: spinal anesthesia
Third group: general anesthesia
Patient data number Sex Male Female
12
12 0
70
52 18
42
34 8 Age (years)
Mean ± SD Median (range)
59.25 ± 5.3 54 (22–84)
65.0 ± 12.1 66 (19–86)
54.89 ± 17.9 56 (18–81) BMI (kg/m2)
Mean ± SD 27.58 ± 3.8 26.18 ± 3.7 25.17 ± 3.8
Education level, n (%) Elementary school High school University
5 (41.66) 5 (41.66) 2 (16.66)
36 (51.43) 25 (35.71) 9 (12.86)
12 (28.57) 23 (54.76) 7 (16.66) Perioperative data
Operation (n)
Mean operation time ± SD (minutes) Range (minutes)
Estimation of blood loss (g/dL)a
Mean ± SD Range
Circumcision (7) Hydrocelectomy (5)
32.58 ± 7.3 19–43
0.93 ± 0.65 0.2–2.5
TUR-P (24) TUR-BT (16) URS (16)
Open prostatectomy (10) MUS (4)
44.37 ± 19.9 11–110
2.75 ± 1.4 0.1–6.7
Varicocelectomy (13) Radical prostatectomy (13) Radical nephrectomy (12) Radical cystectomy and bricker diversion (4) 116.63 ± 62.4 26–290
2.8 ± 1.85 0.2–6.9
Note:aDifference in hemoglobin level pre- and postoperatively.
Abbreviations: BMI, body mass index; MUS, midurethral sling; SD, standard deviation; TUR-BT, transurethral excision of bladder tumor; TUR-P, transurethral prostatectomy; URS, ureteroscopic lithotripsy.
Dovepress PPSS in postoperative pain estimation
Journal of Pain Research downloaded from https://www.dovepress.com/ by 118.70.13.36 on 24-Aug-2020
completely described. During the first postoperative day, each pain episode was registered. The research assistant read the instructions to each patient. They were asked if the nature of the task was understood. If not, the instructions were repeated. The responses on the three scales and any additional comments were recorded. The patient’s mental status was assessed prior to obtaining their response. Analgesic drugs were administered intravenously and were noted in a specific study record. Thirty minutes after analgesic administration, the same patient was asked to fill in the same pain scales to evaluate the analgesic effect. Full blood count was taken immediately after returning to the surgical ward.
Statistical analysis
Data were analyzed by SPSS® version 16 (SPSS Inc,
Chicago, IL). Descriptive statistics were used to analyze the study sample and the patients’ ability to complete the different pain scales.
Evaluation sample sufficiency
To determine if the subscales were suitable for factor analysis, two statistical tests were used: (1) Bartlett’s test of sphericity, which examines the interdependency of the subscales, and (2) the Kaiser–Meyer–Olkin criterion, which
measures the sampling adequacy.22 The Kaiser–Meyer–Olkin
measure of sampling adequacy was 0.854 (patterns of cor-relations were relatively compact so factor analysis yielded distinct and reliable factors). Bartlett’s test of sphericity led
to an approximate chi-square distribution of 1080.626 with 15,000 degrees of freedom and very significant correlation (P = 0.000).
Evaluation of the most efficient pain scale in the sample
In order to acquire methodologically sound and trustworthy data, each episode of pain was assessed by the three pain scales. Assuming that each patient felt the same pain inten-sity during the completion of each pain scale before and after analgesic administration, the following formula was used for each scale to test the efficacy of the treatment and monitor the progress:23
Pretreatment score Posttreatment score Pretreatment score
− × 100 (1)
Evaluation of the most appropriate scoring system for PPSS
The main method of extracting factors and validity assess-ment was examined using a principal component exploratory factor analysis with varimax rotation. Using orthogonal (varimax) rotation, the variance between variable loads is maximized on a specific factor. This way, small loads become smaller and big loads become bigger with reduc-tion of in-between values, making it easier to interpret the results.24 The criterion of an eigenvalue of one or more (Kai-ser rule) defined the number of the factors that were kept.25
VAS score
Predictive covariates Input nodes Hidden nodes Output A nodes Output B node (final decision)
VRS score
Age
Operation stress
Operation duration
Estimated blood loss
General response to pain
Cardiovascular status
Administered medications NRS score
Figure 1 The artificial neural network schema shows the factors affecting the decision for specific drug administration.
Notes: The first column shows all the factors (predictive covariates) that influence drug administration (input nodes). Output A nodes represent the three major analgesic categories according to the World Health Organization’s “analgesic ladder.” Output B represents the final decision (developed using MATLAB R2009B; The MathWorks, Inc, natick, MA).
Abbreviations: nRS, numerical rating scale; VAS, visual analog scale; VRS, visual rating scale.
Dovepress
Gkotsi et al
Journal of Pain Research downloaded from https://www.dovepress.com/ by 118.70.13.36 on 24-Aug-2020
Cronbach’s α was used to assess the internal consistency of the PPSS scoring system.26 Cronbach’s α is the most important index since it factors in the mean correlations of
all variables and does not depend on their arrangement.27
Correlation of PPSS to the most efficient pain scale
Inferential statistics were used for the correlation of pain scales to PPSS and other variables of the study. Pearson’s and Spearman’s rho correlation coefficients were used to correlate the most appropriate scoring system for PPSS to the most efficient pain scale.
Results
In total, 150 patients were recruited. Twenty-six patients were excluded (six with postoperative confusion status and 20
with a pre/postoperative hemoglobin difference .7 g/dL).
A total of 262 postoperative pain episodes during the first postoperative day were analyzed. The mean age of the study sample was 60.8 years (standard deviation 15.41 years; range 18–86 years). The ratio of male to female patients was 3.8:1 (98 males, 26 females). The demographic and baseline characteristics of each group are shown in Table 2.
The Kaiser–Meyer–Olkin index, which compares the size of the observed correlation coefficients to the size of the partial correlation coefficients for the sum of the
analy-sis variables, was 85.4% (ie, reliable because it is .80%).
In addition, the sphericity test (Bartlett’s sign , 0.01) was rejected on a level of statistical significance (P , 0.001)
for an approximate Chi-square distribution of 1080.626. Consequently, the coefficients were not all zero and the sec-ond acceptance of factor analysis was satisfactory.
There were 1.92, 1.98, and 2.43 pain episodes during the first postoperative day per patient for the first, second, and third group, respectively. All patients were able to complete the three scales correctly. Patients of the first group did not require any help in completing the pain rat-ing scales either before or after drug administration. In the second and third groups, 18.6% (n = 13) and 47.6% (n = 20)
required further explanation on VAS and 8.6% (n = 6) and
38.1% (n = 16) required further explanation on both VAS
and NRS, respectively. There was no significant correla-tion between educacorrela-tion level and the inability to complete the scales. Postoperatively, the values for the second group
and third group were 10% (n = 7) and 30.9% (n = 13) on
VAS and 5.7% (n = 4) and 28.6% (n = 12) on both VAS
and NRS, respectively. None of the patients had difficulty in the VRS scoring.
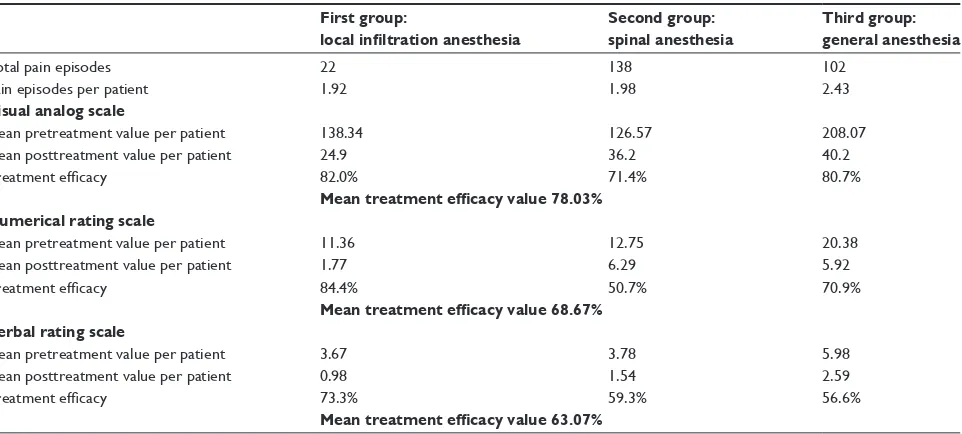
Using Equation 1, pain intensity reduction was more accurate with VAS and NRS (mean 78.03% and 68.67%, respectively) than with VRS (mean 63.07%) (Table 3). Eight different scoring combinations (factors) for PPSS were tested. The appropriate factors are represented graphically as a Cattell scree plot in Figure 2. It shows a distinct break at the fourth component and thereafter forms the linear part of the eigenvalue curve. Taking under consideration the eigenvalues greater than one, four factors satisfactorily interpret the data: component one 1–3–7; component two
Table 3 Comparison of the treatment efficacy after intravenous administration of analgesics across the three pain scales
First group:
local infiltration anesthesia
Second group: spinal anesthesia
Third group: general anesthesia
Total pain episodes 22 138 102
Pain episodes per patient 1.92 1.98 2.43
Visual analog scale
Mean pretreatment value per patient 138.34 126.57 208.07
Mean posttreatment value per patient 24.9 36.2 40.2
Treatment efficacy 82.0% 71.4% 80.7%
Mean treatment efficacy value 78.03% Numerical rating scale
Mean pretreatment value per patient 11.36 12.75 20.38
Mean posttreatment value per patient 1.77 6.29 5.92
Treatment efficacy 84.4% 50.7% 70.9%
Mean treatment efficacy value 68.67% Verbal rating scale
Mean pretreatment value per patient 3.67 3.78 5.98
Mean posttreatment value per patient 0.98 1.54 2.59
Treatment efficacy 73.3% 59.3% 56.6%
Mean treatment efficacy value 63.07%
Dovepress PPSS in postoperative pain estimation
Journal of Pain Research downloaded from https://www.dovepress.com/ by 118.70.13.36 on 24-Aug-2020
10–30–70; component three 1–2–3; and component four 0–1–2 scores for each analgesic category, respectively. The reliability coefficient, Cronbach’s α, was statistically sig-nificant and equal to 73.45%, 70.38%, 63.91%, 62.15% for the first, second, third, and fourth components, respectively. Therefore, the first component is the ideal scoring system for the PPSS.
The total number of episodes (n = 262) was used to correlate the 1–3–7 scoring system for PPSS to VAS. Pearson’s and Spearman’s rho correlation coefficients were applied. Multiple regression analysis of the remaining variables such as sex, age, body mass index, educational level, duration of operation, difference in hemoglobin, and NRS were evaluated (Table 4). A strong correlation of VAS
to PPSS (rho = 0.715; P , 0.001) and NRS (rho = 0.884;
P , 0.001) was found. The results were verified by
Pearson’s correlation (0.631 and 0.851, respectively;
P , 0.001). Less effect was found for prolonged operation
times and higher blood loss, while inconsiderable effect was found for body mass index, age, and education level. Figure 3 shows the plotted linear regression between VAS
and PPSS (r2= 0.702).
The intergroup variability was also notable, since PPSS was found to correlate well with VAS in the first group (Pearson’s = 0.847; P , 0.001 and rho = 0.828; P , 0.001) but less so in the other two groups. It is noteworthy that this decline in PPSS efficiency is accompanied by the
propor-tional decline of NRS (Pearson’s = 0.628 versus 0.620 for
NRS and 0.702 versus 0.502 for PPSS in the second and third group, respectively) (Table 5).
Discussion
This study examined the relationship between different pain scales in postoperative patients to construct the valid-ity of PPSS. This proposed tool is intended for use in the pain intensity assessment of the postoperative period in retrospective studies. Three types of unidimensional pain measurement scales were considered: VAS, NRS, and VRS. All these tools are commonly used to measure pain intensity and are validated in both acute and chronic pain settings.13,28
In the medical literature, several studies have evaluated the accuracy of each method and some have compared their results.29 For example, de Boer et al showed that VAS is a sufficient tool for use in acute pain settings.30 Failure rates of VAS are between 4%–11%, which are reduced if the tool is carefully explained to the patient.31,32 Kremer et al reported lower failure rates of 1%–2% in NRS and VRS, as they found a significant age difference between patients able to complete VAS and those who were not (mean age 75.3 versus 54.4 years; P , 0.01).23,31 Failure rates are enhanced when dealing with children, patients with cognitive dysfunction, or when language difficulties exist.32,33
In the current study, the efficiency of these tools was calculated to find the scale to compare to the PPSS. The efficacy of VAS was 78.03%. The proposed PPSS was exam-ined against VAS and it was found to be correlated strongly and linearly, but less so than NRS to VAS. Both scales seem to weaken their correlation to VAS in patients who underwent longer operations and had higher blood loss.
Table 4 Multiple regression analysis for sex, age, body mass index, educational level, operation duration, and reduction in hemoglobin level
VAS NRS PPSS Sex Age BMI Education level Operation
duration
Hemoglobin reduction
1 0.851** 0.631** 0.005 0.051 0.221** 0.052 0.398** 0.342**
P-value 0.000 0.000 0.937 0.415 0.000 0.403 0.000 0.000
Notes: **No significance; VAS pain scale used as the independent variable.
Abbreviations: BMI, body mass index; nRS, numerical rating scale; PPSS, pain point system scale; VAS, visual analog scale.
8 7 1: 1,3.7 Components of scoring system
2: 10,30,70 3: 1,2,3 4: 0,1,2 5: 5,15,25 6: 0,100,300 7: 0,10,20 8: 100,300,700
6 5
Component number Scree plot
Eigenvalue
4 3 2 1 0 2 4 6
Figure 2 Cattell scree plot for factor determination and evaluation of the proper scoring system.
Dovepress
Gkotsi et al
Journal of Pain Research downloaded from https://www.dovepress.com/ by 118.70.13.36 on 24-Aug-2020
20,00
R Sq linear = 0,702
15,00 10,00
Pain point system scale
Visual analog scale
5,00 0,00
0,00 10,00 20,00 30,00 40,00 50,00
Figure 3 The relationship between the visual analog scale and the proposed pain point system scale, showing linear and strong correlation.
Table 5 Pearson’s and Spearman’s rho correlations in the three studied groups
First group:
local infiltration anesthesia
Second group: spinal anesthesia
Third group: general anesthesia
VAS NRS PPSS VAS NRS PPSS VAS NRS PPSS
Pearson’s correlation to VAS 1.000 0.971 0.847 1.000 0.628 0.620 1.000 0.702 0.502
Significance (2-tailed) – 0.001 0.001 – 0.001 0.001 – 0.001 0.001
n 22 22 22 138 138 138 102 102 102
Spearman’s rho correlation to VAS 1.000 0.960 0.828 1.000 0.564 0.602 1.000 0.792 0.634
Significance (2-tailed) – 0.001 0.001 – 0.001 0.001 – 0.001 0.001
n 22 22 22 138 138 138 102 102 102
Abbreviations: nRS, numerical rating scale; PPSS, pain point system scale; VAS, visual analog scale. These groups (second and third) of patients underwent
spinal or general anesthesia, and this could be a masked bias to the analysis.
PPSS is correlated to the duration of operation and blood loss, indicating the need for analgesics in the early postopera-tive period. It does not correlate at all to sex, age, body mass index, and education level, indicating the true relationship to the contributing factors.
The main drawbacks of this study were the short cohort, the age distribution (59–71 years), the male to female ratio (3.8:1), and the evaluation of only urologic patients. Additionally, patients under continuous or balanced anes-thesia were excluded. More studies are required to assess the affinity of PPSS for the objective evaluation of postoperative pain and also to examine the possible deployment of this tool in cancer-related pain or in other patients with chronic pain.
Dovepress PPSS in postoperative pain estimation
Journal of Pain Research downloaded from https://www.dovepress.com/ by 118.70.13.36 on 24-Aug-2020
Journal of Pain Research
Publish your work in this journal
Submit your manuscript here: http://www.dovepress.com/journal-of-pain-research-journal The Journal of Pain Research is an international, peer-reviewed, open access, online journal that welcomes laboratory and clinical findings in the fields of pain research and the prevention and management of pain. Original research, reviews, symposium reports, hypoth-esis formation and commentaries are all considered for publication.
The manuscript management system is completely online and includes a very quick and fair peer-review system, which is all easy to use. Visit http://www.dovepress.com/testimonials.php to read real quotes from published authors.
Conclusion
Pain rating scales have a fundamental place in clinical practice. The evidence suggests that patients are able to use them to communicate their pain experience and their response to treatment. Nevertheless, pain-measuring tools cannot be used retrospectively, especially when study purposes require pain assessment. The authors believe that PPSS will be a valuable tool in defining better treatment options and comparing therapies and patient preferences.
Disclosure
The authors report no conflicts of interest in this work.
References
1. Merskey H, Bogduk N. Classification of Chronic Pain: Descriptions of Chronic Pain Syndromes and Definitions of Pain Terms, 2nd ed. Seattle, WA: IASP Press; 1994.
2. Bader P, Echtle D, Fonteyne V, et al. Post-operative pain management. In: Guidelines on Pain Management. Arnhem, The Netherlands: European Association of Urology (EAU); 2010:61–82.
3. Jacobson L, Mariano AJ. General considerations of chronic pain. In: Loeser JD, Butler SH, Chapman CR, Turk DC, editors. Bonica’s Management of Pain. Philadelphia, PA: Lippincott Williams and Wilkins; 2001:241–254.
4. American Society of Anesthesiologists Task Force on Acute Pain Management. Practice guidelines for acute pain management in the perioperative setting: an updated report by the American Society of Anesthesiologists Task Force on Acute Pain Management. Anesthesiology. 2004;100(6):1573–1581.
5. Rosenquist RW, Rosenberg J; United States Veterans Administration. Postoperative pain guidelines. Reg Anesth Pain Med. 2003;28(4): 279–288.
6. Desborough JP. The stress response to trauma and surgery. Br J Anaesth. 2000;85(1):109–117.
7. Sydow FW. The influence of anesthesia and postoperative analgesic man-agement of lung function. Acta Chir Scand Suppl. 1989;550:159–165. 8. Warltier DC, Pagel PS, Kersten JR. Approaches to the prevention of
peri-operative myocardial ischemia. Anesthesiology. 2000;92(1):253–259. 9. Rosenfeld BA. Benefits of regional anesthesia on thromboembolic
complications following surgery. Reg Anesth. 1996;21(Suppl 6):9–12. 10. Livingston EH, Passaro EP Jr. Postoperative ileus. Dig Dis Sci. 1990;
35(1):121–132.
11. Wilmore DW, Kehlet H. Management of patients in fast track surgery. BMJ. 2001;322(7284):473–476.
12. Kehlet H, Holte K. Effects of postoperative analgesia on surgical outcome. Br J Anaesth. 2001;87(1):62–72.
13. Caraceni A, Cherny N, Fainsinger R, et al. Pain measurement tools and methods in clinical research in palliative care: recommendations of an Expert Working Group of the European Association of Palliative Care. J Pain Symptom Manage. 2002;23(3):239–255.
14. Clark CW, Ferre-Brechner T, Janal MN, Carroll JD, Yang JC. The dimensions of pain: a multidimensional scaling comparison of cancer patients and healthy volunteers. Pain. 1989;37(1):23–32.
15. Jensen MP, Karoly P. Self-report scales and procedures for assessing pain in adults. In: Handbook of Pain Assessment. Turk DC, Melzack R, editors. New York, NY: Guilford Press; 1992:135–151.
16. World Health Organization. The Analgesic Ladder. Geneva: World Health Organization; 1986.
17. Oken MM, Creech RH, Tormey DC, et al. Toxicity and response criteria of the Eastern Cooperative Oncology Group. Am J Clin Oncol. 1982; 5(6):649–655.
18. Williamson A, Hoggart B. Pain: a review of three commonly used pain rating scales. J Clin Nurs. 2005;14(7):798–804.
19. Sriwatanakul K, Kelvie W, Lasagna L, Calimlin JF, Weis OF, Mehta G. Studies with different types of visual analog scales for measurement of pain. Clin Pharmacol Ther. 1983;34(2):234–239.
20. Gagliese L, Weizblit N, Ellis W, Chan VW. The measurement of postoperative pain: a comparison of intensity scales in younger and older surgical patients. Pain. 2005;117(3):412–420.
21. Anagnostou T, Remzi M, Lykourinas M, Djavan B. Artificial neural net-works for decision-making in urologic oncology. Eur Urol. 2003;43(6): 596–603.
22. Kaiser HF. An index of factorial simplicity. Psychometrika. 1974;39: 31–36.
23. Williamson A, Hoggart B. Pain: a review of three commonly used pain rating scales. J Clin Nurs. 2005;14(7):798–804.
24. Hair JF, Black WC, Badin BJ, Anderson RE, Tatham RL. Multivariate Data Analysis, 6th ed. Upper Saddle River, NJ: Prentice Hall; 2006. 25. Hair JF, Anderson RE, Tatham RL, Black WC. Multivariate Data Analysis
With Readings, 4th ed. Upper Saddle River, NJ: Prentice Hall; 1995. 26. Croanbach LJ. Essentials of Psychological Testing, 4th ed. New York,
NY: Harper and Row; 1984
27. Anastasiadou S. Factorial validity evaluation of a measurement through principal components analysis and implicative statistical analysis. In: Hatzidimou DX, Mpikos K, Stravakou PA, Hatzidimou KD, editors. [5th Greek Conference: Greek Pedagogic and Educational Research]. Thessaloniki: Kyriakidis Brothers; 2006:341–348. Greek.
28. Wallenstein SL, Houde RW. The clinical evaluation of analgesics effectiveness. In: Ehrenpreis S, Neidle A, editors. Methods of Narcotic Research. New York: Marcel Decker; 1975:127–145.
29. Fadaizadeh L, Emami H, Samii K. Comparison of visual analogue scale and faces rating scale in measuring acute postoperative pain. Arch Iran Med. 2009;12(1):73–75.
30. de Boer AG, van Lanschot JJ, Stalmeier PF, et al. Is a single-item visual analogue scale as valid, reliable and responsive as multi-item scales in measuring quality of life? Qual Life Res. 2004;13(2):311–320. 31. Kremer E, Atkison JH, Ignelzi RJ. Measurement of pain: patient
preference does not confound pain measurement. Pain. 1981;10(2): 241–248.
32. Joyce CR, Zutshi DW, Hrubes V, Mason RM. Comparison of fixed interval and visual analogue scales for rating chronic pain. Eur J Clin Pharmacol. 1975;8(6):415–420.
33. Cepeda MS, Africano JM, Polo R, Alcala R, Carr DB. Agreement between percentage pain reductions calculated from numeric rating scores of pain intensity and those reported by patients with acute or cancer pain. Pain. 2003;106(3):439–442.
Dovepress
Dove
press
Gkotsi et al
Journal of Pain Research downloaded from https://www.dovepress.com/ by 118.70.13.36 on 24-Aug-2020