514
Urban dwellers’ satisfaction on public bus passenger transport in Sri Lanka
D. P. S. Chandrakumara
Senior Lecturer; Department of Economics, University of Sri Jayewardenepura, Gangodawila Nugegoda, Sri Lanka
Abstract
The public passenger transport service in Sri Lanka is often criticized as low in quality. The quality depends on a wider range of service elements and attributes pertinent to the service. The aim of this paper is to identify the crucial service elements and attributes in determining passenger satisfaction based on perceptions of dwellers in urban Colombo. Using quantitative data and also analytical techniques, the study found that 17 service elements, majority being related to professionalism and service delivery qualities, were integral for ensuring passenger satisfaction. It emphasizes that these service elements should be given priority by policy makers and service providers when allocating their scarce resources in this service. An equal allocation of resources to improve the quality of the 33 elements is not effective and meaningful. It also shows that more than half of the significant service elements or attributes are mostly the man-related elements which can be improved by training. In addition, safety, time and information related service attributes, which have been significant, may also be indirectly and partly related to the behaviour of the frontline staff.
Keywords: Passenger satisfaction, public passenger transport, drivers of satisfaction, service quality, service elements, service attributes and Sri Lanka
Introduction
1The transportation of people in Sri Lanka can be divided into five main categories. First, the public passenger bus transport service managed by both public and private sector service providers. This category accounts for more than 68 percent of the passenger transportation in Sri Lanka with the state and private sectors owning 23 percent and 45 percent respectively. The second category is the railway transport that contributes to nearly five percent of passenger transport (Ministry of Transport, 2008). In contrast to the public passenger bus service, the railway service has remained stagnant since independence. The third category is the transport of people through privately hired vehicles, which can vary from hired buses to hired three-wheelers. This category of the passenger service is in operation especially for non-regular or special tours of individuals or small groups of people. The fourth category is the use of own vehicles such as motor cars, vans, motor cycles, etc. for travelling purposes. Finally, cycling, walking, etc., which do not involve any fuel consumption, can also be considered as another category of transport. This category has developed in line with the modernization of cities where separate paths have been provided for cycling and walking. This category of transport is important when considering health and environmental impact of fuel-based modes of transport.
Corresponding author's
Email address:chandrakumara62@gmail.com
Asian Journal of Empirical Research
515
Presently, the largest mode of public passenger transport in Sri Lanka, in urban and rural areas, is the public passenger bus transport service with both public and private sector service providers. The public sector providers of the bus service, accounts for 44 percent of bus passenger transport demand of the country, and consist of eight regional transport companies for the nine provinces. The state owns only 50 percent of the shares of these companies while the other 50 percent has been distributed among the employees (SEVANATHA, 2002). The National Transport Commission is responsible for the inter-provincial transport of the country. The private bus transport which accounts for 66 percent of the bus passenger transport of the country, consists of region-based bus companies and individual private bus owners. The Provincial Road Passenger Transport Authority (PRPTA) is the statutory body that regulates the private bus transport throughout the provinces. The officials of the entire system of bus transport management and also the political leadership are responsible for maintaining the transport service to an accessible and acceptable standard.
Despite the transformation of structures and systems governing the public passenger transport service over several decades, bus transport remains highly criticized in terms of the quality of service. Safety of passengers, customer care, attitudes of the service staff, timeliness, cleanliness, availability and frequency of buses, etc. of the public passenger bus service are the main topics of criticisms, which are communicated in printed as well as electronic media. However, quality of bus service should be accurately measured at micro level in order to understand its variations among different service elements that remain in a wider range throughout the service. Among the options available to measure service quality, customer (passenger) satisfaction is widely used in modern research since it has a direct link with the demand for the particular service. When consumer satisfaction is viewed as a proxy of welfare level of consumers, an increase in passenger satisfaction causes an increase in the welfare level of the individuals who use that service (Johnson et al., 2001). In Sri Lanka, nearly all individuals of the society are the passengers or customers of the bus transport service. Hence, the quality of passenger bus service affects the welfare level of the all members who use this service in the society.
Service quality can be defined in different ways. In traditional organizational view point quality is measured based on physical measures or criteria. However, since the customer was considered to be more important, quality was viewed based on the customer point of view (Paraskevas, 2001). Furthermore, instead of using single quality measures, it started to define and measure the quality based on a broader range of service elements or dimensions. As such, in order to take necessary policy decisions on quality, policy makers and service providers should identify the quality of a wider range of service elements and attributes of the concerned service. When the quality is viewed on customer perceptions, it is important to know which areas of the service or service elements lack in customer satisfaction. Therefore, this study focuses on the problem on how to improve the quality of the public passenger transport service based on customer caring approach.
Objectives
516
Literature review
Theoretical considerations
Traditionally, service quality was measured based on financial and other physical measures or criteria based on simple or single measure methods on the organizational point of view. However, with the passage of time, most of the service became customer-oriented (Paraskevas, 2001). With the new trend, service elements and attributes which are needed for customer attraction were included in service quality measures. As such, at present, the service quality is widely measured using multi-dimensional performance analyses based on customer point of view. In most of the studies, quality of service has been defined in terms of a user based assessment as to how well the service is being operated while it is measured based on the level of service (Caruana, 2002; Mosahab et al., 2010). This study also takes the quality of passenger bus service as the level of satisfaction measured in a likert-scale.
Passengers, being the customers of the transport services, expect to have many service elements and attributes from the transport service they use. Oliver (1980) provides a solid conceptual basis for explaining the consumer satisfaction. In the same way that individuals preconceive perceptions regarding upcoming events, they will develop perceptions with regard to the quality of goods or services that they intend to purchase. When consumers purchase goods or services, the natural psychological state dictates that individuals compare their realized perceptions with their preconceived ideas or expectations. In turn, perceived quality or performance of the goods or services purchased may confirm or contradict the preconceived ideas or expectations. Psychological satisfaction ultimately occurs when expectations are met during the transaction (i.e., expectations and perceptions of an upcoming purchase are realized once the good is purchased or the service is provided). Finally, satisfied consumers are likely to repurchase the product or service that met expectations. In the absence of substitutes, the dissatisfied consumers may continue to repurchase the same good or service even if they feel that the quality of that good or service is low.
However, when the service is directly supplied by the public sector or under the government interference in the private market, the public policy should be handled so as to protect and increase the welfare of the customers. Having adopted Oliver’s Psychological idea of gap between expected and perceived quality, Parasuraman et al. (1985) introduced the service quality gap theory and later many researchers applied it in marketing research. However, some authors argue that one does not need to get the perception-expectation gap since the perception is clearly definable, straightforward and sufficient to explain the customer’s opinion (Shahin & Samea, 2010; Teas, 1993). Practically also, it is more convenient for the respondents and also for the researcher to take only the customer perception on the quality of a good or service. This study also uses only the perception of passengers on assessing the quality of service elements.
517 Figure 1: The MORI model of customer satisfaction Source:MORI, 2004, 2010
Furthermore, MORI (2004, 2010) mentions the way of deciding the factor which should be studied regarding particular services. According to MORI, the Critical Incident Techniques (CIT) of Johnston can be used to ask service users about their satisfaction regarding a service in question. The service elements so identified can be used to analyse the survey data. This can be introduced as a very systematic and useful model which can incorporate any number of service segments or indicators under each driver of satisfaction.
Previous studies
Previous studies on the quality of passenger transport comprise of the attempts of testing SERVQUAL model and techniques of quantitative and qualitative research in both developed and developing countries. The service quality has been assessed based on five distinct service dimensions: reliability, responsiveness, assurance, empathy, and tangibles (Ramseook-Munhurrun et al., 2010). Approximately, the same service elements, which are considered under SERVQUAL model, can be included in MORI model also.
The quality of transport from the passenger point of view has been largely investigated in developed countries so that service providers and policy makers have adequate evidence that can be used in the decision making process. The literature reveals that quality is not high or low in the service as a whole. Quality of some elements of the service is high while some other elements remain low. As such, it should be understood that developing countries should give priority in allocating their limited resources only for the service elements which are lowest or low in quality. For example, in German, Le-Klahn (2012) found that passengers were highly satisfied with ‘punctuality’, ‘reliability’, ‘network connection’, and service frequency’ in public transport while they were dissatisfied with ‘staff service’, ‘comfort at bus stops, and the ticket price. Antonucci et al. (2014) in Italy found that ‘Punctuality’, ‘regularity’, ‘waiting time’,
518
service elements such as ‘courtesy of bus drivers’, ‘availability of seats’, ‘safety from crime after getting off the bus’, ‘ease of getting on/off the vehicle’, and ‘service received for the fare paid’ should be improved. This shows that developed countries can go for an evidence-based policy making with regard to service quality improvement using the limited resources for selected service elements.
Meanwhile, some of the developing countries also have evidence to a certain extent with regard to the identification of service elements where limited resources are allocated on a priority basis.
Sabir et al. (2014), investigating the quality of transport in Pakistan, reveals that ‘empathy’ of staff on customers shows the strongest correlation with customer satisfaction. Nwachukwu (2014) points out, from the evidence in Nigeria, that ‘comfort’ had the greatest impact on overall satisfaction and it was followed by ‘accessibility’. The third and fourth factors were ‘adequacy’ and bus stop facilities’. Hossain et al. (2012) reveals that ‘waiting time’ and ‘comfort level’ as the main factors that shift passengers from public bus transport to private vehicles in Dhaka. Kamaruddin et al. (2012) reveals that customer expectations on public transport services were generally based on safety in the Malaysian context. However, it could be attributed that important service elements largely deviate between countries due to the differences in social and country characteristics.
Despite the absence of scholarly articles on passenger satisfaction in Sri Lanka SEVANATHA (2002) investigated transport among the urban poor in Sri Lanka identifying several problems associated with service quality: lack of a reliable transport mode from their settlement to the nearest bus route, crowded buses during peak hours, congestions at junction centres, lack of time schedules, long journey times, etc. The purpose of this research was to find out the ways in which public transport would help improve the livelihood of the urban poor and analysis was limited to qualitative techniques. In addition, they have looked at the public transport as a means to develop livelihood. Meanwhile one foremost policy analyst and researcher in Sri Lanka has also identified that the deterioration of the quality of public passenger transport tends to increase the usage of private vehicles (Kumarage, 2004). However, in the case of Sri Lanka, it shows that there is no study that divides the transport service into small service elements or attributes purposely to distinguish low quality elements or attributes from the whole system. As a result, the service providers and policy makers are not able to make a necessary differentiation when allocating limited resources or prioritizing them among the different elements. Identifying this research gap, the literature review further reveals the importance of improving the quality of public transport. Same as Kumarage (2004), Dhingra (2011) found that in some developing cities, deteriorating quality of public transport services compels the passengers to shift from public transport to private vehicles. Govender (2014) also reveals that improving the perceived service dimensions can increase the demand for public buses and thereby reduce the use of private motor cars.
In addition, many other researchers have pointed out the importance of improving the quality of this service (Eboli & Mazzulla, 2007; Shahin & Samea, 2010; Sumaedi et al., 2012). It improves the quality of life and helps all other sectors by efficiently transporting people. Therefore, while identifying the research gap, the review of the literature confirms the importance of improving the service quality of the public passenger transport.
Methodology
519 Data collection
The data was collected from the urban dwellers in one area of the Colombo district in Sri Lanka. This process included the following steps. First, out of the 13 Divisional Secretariat Divisions (DSDs) of the Colombo district, Maharagama DSD was selected as the sampling area for the study, as a result of cost and time constraints. Nevertheless, this is a highly populated suburb in the district situated on the High Level Road, 14 kms away from the Central Bus-stand of Colombo, which is frequented by a cross-section of population. There are six main bus routes heading via Maharagama to/from Colombo including, 138 (Kottawa/Homagama), 138/2(Mattegoda), 138/3 (Rukmalgama), 138/4 (Athurugiriya), 122(Awissawella/Ratnapura) and 125(Padukka/Ingiriya).
In addition, there are 23 local bus routes terminating at Maharagama with varied regularity. There are also six long distance bus routes via the Maharagama area to and from Colombo. The starting point of the southern express way is also situated at the Maharagama bus-stand. One of the most popular bus routes starts the passenger bus service at 5.00 am and continues until 10.00 pm., running via the Maharagama town. Being one of the larger DSDs in Colombo, this area consists of a population of 200,170 across 41 Grama Niladari Divisions (DNDs) (Divisional Secretariat of Maharagama, 2011).
Second, out of 41 Grama Niladari Divisions* (GNDs) of this DSD, 527-Navinna GND where the population amounted at 6874 in 1,390 households were selected on judgmental basis since it represented the features of the entire population of Maharagama as well as most of the features of the urban population of the entire country.
Third, out of 1,390 households of the Navinna GND, 360 families, which represent 25 percent of the total households, were randomly selected for the study. Using a sampling frame of all the families, ‘systematic sampling’ was applied to select the families. Finally, any member within the age range 16 or above who was available at home at the time of visit was randomly selected for the interviewing. The collection of data was done using a questionnaire with a series of structured questions followed by an open-ended question that expected a qualitative answer. Practically, since there were some families in addition to the number that existed in the sampling frame, the sampling size of the survey was taken as 360 or 25 percent of families of the GND.
The questionnaire consisted of two main sections, A and B. Section A comprised of questions related to basic information while Section B included questions related to travel details and passenger satisfaction. The respondents had to state whether they agreed or disagreed with different service elements or attributes which come under each driver of satisfaction in the questionnaire.
Analytical methods
The model developed by MORI (2004, 2010) was specified for the Sri Lankan context and incorporated additional service elements identified from previous studies in the literature review. All the service elements incorporated in the framework are given in Table 1.
Table 1: Service elements, key drivers of satisfaction and overall satisfaction
Key Drivers Main elements/Attributes Driver satisfaction
Overall satisfaction
1. Delivery
D1 Personal safety
Satisfaction on delivery D2 Quality of driving
D3 Quality of conductor behaviour
520
D6 Ease of getting on and off the bus
D7 Time taken to explain D8 Cleanliness of vehicle interior D9 Safety on crime while in the
bus
D10 Price/ cost charged D11 The manner of loading
2. Timeliness
T1 Starting time
Satisfaction on timeliness T2 Journey time
T3 Destination time T4 Regularity of service T5 Frequency of service
3. Information
I1 Information on transport routes and timetables
Satisfaction on information I2 Information about service
delays/disruptions
I3 Display name of driver in bus I4 Display name of conductor in
bus
I5 Answer to customer inquiries I6 Display sectional bus-fares I7 Accuracy of information
4. Professionalism
P1 Obey road laws
Satisfaction on professionalism P2 Well-mannered conductor
P3 Driver wears uniforms P4 Conductor wears uniforms P5 Issue tickets
P6 Return the balanced money to customer
P7 Customer care
5. Staff attitudes
A1 Friendliness
Satisfaction on staff attitudes A2 Politeness
A3 Sympathetic
The satisfaction levels of respondents on each service element or attribute was obtained using a likert-scale of five points, -2, -1, 0, 1 and 2. According to the levels of satisfaction, -2 indicated a very low level of satisfaction. The other levels, -1, 0, 1 and 2 respectively indicated ‘Low’, ‘Neutral’, ‘High’ and ‘Very high’ levels of satisfaction. This way of inferencing on passenger satisfaction levels was based on the Teas’ view that the perception is sufficient for knowing the user satisfaction (Shahin & Samea, 2010: Teas, 1993).
521
Analysis and results
Basic descriptive statistics of the sample
The sample consisted of 52 percent of females and 48 percent of males. The respondents from all families of the sample, 342, have been randomly distributed between female and male as 181 and 161 respectively. The education of respondents is such that 60 percent of them are G.C.E (O/L) and below that while the remaining 40 percent had received an education above G.C.E. (O/L). The significance of families according to income levels; below Rs. 15000 (Very low), 15001-30000 (Low), 30001-60000 (Average) and above 60000 (High) were respectively 23 percent, 16 percent, 36 percent and 25 percent.
In addition to the above statistics, the respondents’ transport-related statistics are also important to taken into consideration. It shows that 53 percent of the respondents of the sample were regular passengers while the other 47 were not regular in their behaviour. Only 37 percent of respondents had used mainly public buses during the previous week while it was 63 percent in the case of private buses. Moreover, about 62 percent of respondents were peak hour passengers while the only 38 percent had travelled in non-peak hours or occasionally. It shows that the percentage of regular passengers is very close to the percentage of peak hour passengers.
Results of the factor analysis
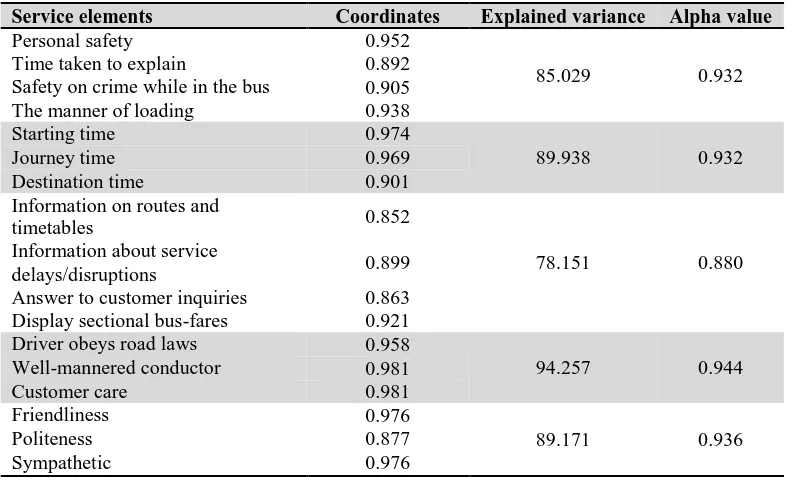
The factor analysis could identify 17 service elements out of 33 which best describe the passenger satisfaction under all drivers of satisfaction (Table 2). The Eigen value ≥ 1.0 rule was used to determine the numbers of factors to retain. After taking the factor loadings, the internal reliability of the factor was also identified through Cronbach’s coefficient alpha.
Table 2: Coordinates under each driver of satisfaction
Service elements Coordinates Explained variance Alpha value
Personal safety 0.952
85.029 0.932
Time taken to explain 0.892
Safety on crime while in the bus 0.905
The manner of loading 0.938
Starting time 0.974
89.938 0.932
Journey time 0.969
Destination time 0.901
Information on routes and
timetables 0.852
78.151 0.880
Information about service
delays/disruptions 0.899
Answer to customer inquiries 0.863 Display sectional bus-fares 0.921
Driver obeys road laws 0.958
94.257 0.944
Well-mannered conductor 0.981
Customer care 0.981
Friendliness 0.976
89.171 0.936
Politeness 0.877
Sympathetic 0.976
522
principle component accounting for78.151 percent of the variance. The three service elements under the ‘professional’ have been concentrated into the first principle component contributing to 94.257 percent of the variance. Finally, it shows that the three service elements, which come under the ‘staff attitudes’ were concentrated into the first principle component contributing to 89.171 percent of the variance.
The results show that the factor analysis is appropriate when it is tested with Bartlett’s test of sphericity and Kaise-Meyer-Olkin (KMO) statistical test. The KMO test result for the factors related to ‘delivery’ was .805 while Bartlett’s test was highly significant (p<0.001, approximate chi-square=1.686E3, degrees of freedom=10). The KMO test result for the factors related to ‘timeliness’ was .684 while Bartlett’s test was highly significant (p<0.001, approximate chi-square=919.000, degrees of freedom=6). The result of the KMO for the factors related to ‘information’ was .822 while Bartlett’s test was highly significant (p<0.001, approximate chi-square=1.686E3, degrees of freedom=10).
In order to assess the internal reliability of the factors identified, Cronbach’s coefficient alpha was calculated. The results of this reliability test for the factors identified for ‘delivery’, ‘timeliness’, ‘information’, ‘professional’ and ‘attitudes’ are .932, 932, 880, 944 and .936 respectively. Therefore, the service elements concentrated into each drive well represent the satisfaction of passengers.
Box-plot diagram
Mean, Standard deviation, minimum and maximum values related to the service elements of each of above drivers are shown in Table 3. It shows that mean and median of all satisfaction drivers are negative. The satisfaction falls up to the minimum level for three of the drivers while the maximum satisfaction level does not reach ‘very high’ level for any aspect of the service. It is special that in the case of ‘professionalism’ the maximum value also remains negative at -.20. This means that the overall and section-wise satisfaction of passengers on the public transport remains unsatisfactory. The same statistics has been used in constructing the Box-plot diagram shown in Figure 2.
Table 3: Descriptive statistics related to service aspects (drivers)
Delivery Timeliness Information Professionalism Staff attitudes
N valid 342 342 342 342 342
Mean -0.81 -0.37 -0.18 -1.36 -0.88
Median -1.00 -0.67 -0.18 -1.60 -1.00
Std. deviation 0.75 0.64 0.43 0.68 0.95
Minimum -1.75 -2.00 -0.75 -2.00 -2.00
Maximum 1.00 0.33 1.00 -.20 1.00
523
Figure 2: Passenger satisfaction by service aspects (drivers)
The lowest range and the inter-quartile range can be found in passenger level of satisfaction for information regardless of the two outliers. Meanwhile, in contrary to the other key drivers, the majority of passengers fall in the satisfactory region.
Conclusions and suggestions
Conclusions
The study revealed that out of 33 service elements, 17 elements are significant in determining the passenger satisfaction for the public passenger transport service. This means that equal allocation of resources to improve the quality of the 33 elements is not meaningful and scarce resources should be allocated for the 17 elements identified by the study on a priority basis. It is also important to notice here that the satisfaction of the above service elements can be increased with no large involvement of financial cost. Moreover, it also shows that more than half of the significant service elements or attributes are mostly man-related elements which can be improved by training. In addition, safety, time and information related service attributes, which have been significant, may also be indirectly and partly related to the behaviour of the frontline staff.
The study also revealed that some service elements which were found to be significant in some countries in the literature review have not been significant in the Sri Lanka. As such, it seems that the passenger satisfaction can be changed depending on the socio-economic and cultural setting.
The study also reveals that the conceptual model suggested by MORI, Social Research Institute, for the office of public service reform is valid for the Sri Lankan context as far as the 17 service elements are concerned.
Policy implications
The findings of the study, further validating the model of satisfaction of MORI, help draw the following policy implications:
524
cost involvement i.e. by providing a professional training to the front-line staff, etc. However, when allocating additional resources to the passenger bus transport industry, the special elements and attributes identified from the study are important to be taken into consideration.
The quality of the service delivery, information to passengers, and attitudes of the staff should also be improved. However, the quality cannot be increased without an increase in the bus fare. Furthermore, it is not practical to increase the price for all passengers under the prevailing situation, diversification of the service based on the quality of the service with the application of price discrimination would be appropriate for increasing the satisfaction of all levels of passengers with different purchasing powers. A part of the private vehicle users also can be diverted to public passenger buses if the service is diversified this way. However, it should be taken into consideration that only an improvement of the passenger bus service will not eliminate all the problems regarding passenger transport. This service is linked with other services such as road related infrastructure, town and country planning, decentralization of public sector offices, structural change in the passenger bus service, development of other transport services such as railways etc. Furthermore, a comprehensive concessionary pre-paid card system that covers public, private and also railway can be introduced for the benefit of the daily and frequent travellers.
Acknowledgement
The author wishes to acknowledge that this paper was made possible through the support and guidance provided by the 'Australia Awards Fellowship Program for Sri Lanka - 2014', funded by the Department of Foreign Affairs and Trade, Australia, and co-hosted by Monash University, Australia and the Sri Lanka Institute of Development Administration.
References
Antonucci, L., Crocetta, C., d’Ovidio, F. D., & Toma, E. (2014). Passenger satisfaction: A multi-group analysis. Qual & Quant, 48, 337-345.
Barabino, B., Deiana, E., & Tilocca, P. (2012). Measuring service quality in urban bus transport: a modified SERVQUAL approach. International Journal of Quality and Service, 4(3), 238-252.
Caruana, A. (2002). Service quality. the effects of service quality and the mediating role of customer satisfaction. European Journal of Marketing, 36(7/8), 811-828.
Divisional Secretariat of Maharagama, (2011). Resource profile (in Sinhala), Colombo.
Dhingra, C. (2011). Measuring public transport performance: Lessons for developing cities. In Sustainable urban transport technical document # 9, Eschborn: International Zusammenarbeit (GIZ) GmbH.
Eboli, L., & Mazzulla, G. (2007). Service quality attributes affecting customer satisfaction for bus transit. Journal of Public Transportation, 10(3), 21-34.
Govender, K. K. (2014). Public transport service quality in South Africa: A case study of bus and mini-bus services in Johannesburg. African Journal of Business
Management, 8(10), 317-326.
Hossain, M. R., Ayon, B. D., Haque, A. M., & Roni, A. T. (2012). Evaluation of facts behind low-quality public bus services in a developing country: A case study of Dhaka city. Bangladesh Research Publications Journal, 7(1), 21-28.
Johnson, M. D., Gustafsson, A., Andreasson, T. W., Cha, J., & Lervick, (2001). The evolution and future of national customer satisfaction index Models. Journal of Economic
Psychology, 22, 217-245.
525
Kostakis, A., & Pandelis, I. (2009). Measuring customer satisfaction in public transportation:
An empirical study based in urban buses in the city of Larissa. The MUSA methodology.
NIBES,pp. 260-275.
Kumarage, A. S. (2004). Regulatory impediments in the land transport sector of Sri Lanka,
Paper presented at workshop on regulatory impact assessment. Colombo: Institute of
policy studies of Sri Lanka/Centre on regulation and competition/institute for development policy and management/university of Manchester.
Le-Klahn, D. (2012). Measuring tourists’ satisfaction with public transport in Munich.
International Journal of Business Tourism and Applied Sciences, 1(1), 74-83.
Ministry of Transport (2008). National policy on transport in Sri Lanka, Colombo. MORI (2004). The drivers of satisfaction with public services. In research study conducted
for the office of public services reforms, Available from http://www.g4sassessmentservices.com/Standards/Customer%20Service%20Excelle nce/Do cument%20Library/Key%20Drivers.pdf.
MORI (2010). Public sector service satisfaction index: A report for customer focus. Available from http://www.consumerfocus.org.uk/files/2011/10/Public-sector-service-satis faction-index.pdf.
Mosahab, R., Mahamad, O., Ramayah, T. (2010). Service quality, customer satisfaction and loyalty: A test of mediation. International Business Research, 3(4), 73-80. Nwachukwu, A. A. (2014). Assessment of passenger satisfaction with intra-city public bus
transport service. Journal of Public Transportation, 17(1), 99-119.
Oliver, R. (1980). A cognitive model of the antecedents and consequences of satisfaction decisions. Journal of Marketing Research, 17, 460-469.
Paraskevas, A. (2001). Exploring hotel internal service chains: a theoretical approach.
International Journal of Contemporary Hospitality Management, 13(5), 251-258.
Parasuraman, A., Zeithaml, V. A., & Berry, L. L. (1985). A conceptual model of service quality and its implications of future research. Journal of Marketing, 49(4), 45-50.
Ramseook-Munhurrun, P., Lukea-Bhiwajee, S. D., & Naidoo, P. (2010). Service quality in the public service. International Journal of Management and Marketing Research, 3(1), 37-50.
Sabir, R. I., Javed, S., Ahmed, W., Noor, N., & Munir, H. M. (2014). Assessing customer satisfaction level of transport services using servqual: A case of Daewoo express, Pakistan. Journal of Basic and Applied Scientific Research, 4(2), 207-213.
SEVANATHA (2002). Partnership to improve access and quality of public transport-case
of Colombo: Sri Lanka country report. DFID Assisted, Institute of development
engineering, Colombo: WEDC Executed Research.
Shahin, A., & Samea, M. (2010). Developing the models of service quality gaps: A critical discussion. Business Management and Strategy, 1(1), 1-11.
Sumaedi, S., Mahatma, G., Bakti, I. G. M. Y., & Yarmen, M. (2012). The empirical study of public transport passengers’ behavioural intentions: The roles of service quality. Perceived sacrifice, perceived value, and satisfaction (Case study: Para-transit passengers in Jakarta, Indonesia). International Journal for Traffic and Transport Engineering, 2(1), 83-97.
Teas, K. R. (1993). Expectations, performance evaluation and customer’s Perceptions of quality.
Journal of Marketing, 57(9), 18-34.
Transportation Research Board (1995). Customer satisfaction index for the mass transit
industry: Final report for transit IDEA project 1. Available from,