Sonia Cecilia Nobre de Sousa Morais Pereira
University College London
All rights reserved
INFORMATION TO ALL USERS
The quality of this reproduction is dependent upon the quality of the copy submitted.
In the unlikely event that the author did not send a complete manuscript and there are missing pages, these will be noted. Also, if material had to be removed,
a note will indicate the deletion.
uest.
ProQuest U642230
Published by ProQuest LLC(2015). Copyright of the Dissertation is held by the Author.
All rights reserved.
This work is protected against unauthorized copying under Title 17, United States Code. Microform Edition © ProQuest LLC.
ProQuest LLC
789 East Eisenhower Parkway P.O. Box 1346
Portugal, the United Kingdom and Germany to examine four topical aspects of
employment, careers and productivity in these countries’ labour markets.
The second chapter studies the impact that a 49.3% change in the legal
minimum wage for workers aged 18 and 19 in Portugal had on the wages and
employment of this age group o f workers. It uses firm-level micro data to compare the
employment growth of 18-19 year old workers with employment growth of older
workers. It also looks separately at firms more and less likely to be affected by the
minimum wage shock.
The third chapter studies the impact of foreign direct investment (FDI) on the
productivity of domestic firms in the UK. It uses a plant-level panel covering UK
manufacturing to find evidence of FDI spillovers. It does so by investigating the
correlation between a domestic plant’s TFP and the foreign-affiliate share of
employment in that plant’s industry and, independently, in that plant’s region. A
number of different specifications are estimated in order to minimise potential
endogeneity bias.
The fourth chapter estimates returns to job tenure and labour market
experience in the United Kingdom and Germany using various methods to correct for
heterogeneity and endogeneity biases. It also estimates the returns to tenure and
experience by qualification group. Results are interpreted in light of the differences
between the two labour markets’ institutions.
The fifth chapter compares returns to tenure and experience in union and non
When you set out on your journey to Ithaca, pray that the road is long,
full o f adventure, full of knowledge. The Lestrygonians and the Cyclops, the angry Poseidon — do not fear them:
You will never find such as these on your path, if your thoughts remain lofty, if a fine
emotion touches your spirit and your body. The Lestrygonians and the Cyclops,
the fierce Poseidon you will never encounter, if you do not carry them within your soul, if your soul does not set them up before you. Pray that the road is long.
That the summer mornings are many, when, with such pleasure, with such joy
you will enter ports seen for the first time; stop at Phoenician markets,
and purchase fine merchandise,
mother-of-pearl and coral, amber and ebony, and sensual perfumes of all kinds,
as many sensual perfumes as you can; visit many Egyptian cities,
to learn and learn from scholars. Always keep Ithaca in your mind. To arrive there is your ultimate goal. But do not hurry die voyage at all. It is better to let it last for many years; and to anchor at the island when you are old, rich with all you have gained on the way, not expecting that Ithaca will offer you riches. Ithaca has given you the beautiful voyage.
Without her you would have never set out on the road. She has nothing more to give you.
And if you find her poor, Ithaca has not deceived you. Wise as you have become, with so much experience, you must already have understood what Ithacas mean.
I would like to thank my supervisors Christian Dustmann and Steve Machin
for their scientific support, guidance, enthusiasm and trust. This thesis would not
have been possible without them. I would also like to thank Jonathan Thomas for his
excellent supervision in the earlier part of this work, which will always be
remembered. I thank my co-authors Jonathan Haskel and Matthew Slaughter for all I
leamt with them, and for the experience of a truly joyful joint work. I am also
grateful to my PhD examiners Jonathan Wadsworth and Bob Elliot for their
comments and suggestions. I also thank all the staff in the Economics Department of
the University College London for the friendly work environment and the thought
provoking seminar discussions.
I thank all others whose comments, questions and suggestions have
contributed to the improvement of the four pieces of work I present in this Thesis.
Among those, I ought to mention Andrew Bernard, Bruce Blonigen, Margherita
Borella, François Bourguignon, Rob Euwals, Miguel Gouveia, Nina Pavcnik, Eduarda
Ribeiro, Dave Richardson, Joel Slemrod, Scott Stem and two anonymous referees.
Financial assistance from Fundaçâo para a Ciência e Tecnologia (PRAXIS
XXI/BD/5716/95), Fundaçâo Calouste Gulbenkien, the British Council, and the
Economic and Social Research Council (grant #R000223239) are gratefully
acknowledged. Thanks are also due to the Statistics Department of the Portuguese
Ministry of Qualification and Employment and in particular to Luis Silva for
Borghesi, Martina Chidiak, Chiara Criscuolo, Francesca Fabbri, Eric Gould, Iftykhar
Houssain, Astrid Kunze, Ralf Martin, Susarme Rohwedder and Rob Sauer.
I would also like to express my deep gratitude to those who shared with me
the dream of accomplishing this work. I specially thank them the uplifting words,
thoughts and prayers in the difficult times. Special thanks are due to Patricia Akester,
Ana Maria Costa, Joao Costa, Rosarinho Araujo, Cecilia da Penha Girao, Maria
Guiomar de Oliveira, Angelina Mano, Maria Amelia Brites Moita, Luis Moura, Rita
Nunes, Madalena Resende, Fernanda Rodrigues, Isabel Sanroque, Courtney Sheets,
Viana family, and Susana Welsh.
Isabel Neto was there to help me in all possible ways in the final steps of this
long marathon. She helped me as if this was her own Thesis and I am extremely
grateful to her for this.
I thank my brother who calls me an academic (intended as a criticism, but
taken as a compliment). I thank all my friends who have nurtured my soul
throughout the good and the bad moments. I thank those in Portugal who showed
me that Üiere are no distances in friendship. I thank those in London whose
friendship more than compensated for the Sun shortages. I thank those around the
globe for making me feel at home in many "homes".
I thank Nuno for the love.
I thank God for the inspiration, the knowledge and the light.
Finally, I thank my parents, to whom I owe not only my material existence,
Acknowledgements...5
Table of Contents...7
List of Figures... 10
List of Tables... 10
Preface... 12
Data Sources... 12
Chapter 1. Introduction...13
Chapter 2. The impact o f minimum wages on youth employment in Portugal... 17
2.1 Introduction... 17
2.2 “The Quasi-Experiment” ...20
2.3 The data...23
2.4 Minimum wages and wage changes... 24
2.5 Estimates of employment effects...30
2.6 Second experimental design...35
2.7 Firms’ entries and exits...38
2.8 Conclusions...41
Appendix 2.A 42 Chapter 3. Does inward foreign direct investment boost the productivity of domestic firms?... 43
3.1 Introduction...43
3.2 Multinationals and theories of productivity spillovers... 48
3.3 Data, measurement, and econometrics...51
3.3.1 Overview of the ARD data set... 51
3.3.2 Specification, measurement, and estimation issues... 55
1.4 Estimation results...68
1.5 Public-finance implications: how much should governments pay to attract FDI?... 79
1.6 Conclusions... 84
Appendix l.A Variable definitions and sources...86
2.1 Introduction... 97
2.2 Methods... 101
2.2.1 The empirical model... 101
2.2.2 Altonji and Shakotko (A+S) Instrumental Variable procedure...105
2.2.3 Finnie’s extension of Altonji and Shakotko Instrumental Variable procedure 106 2.2.4 Topel 2-stage estimation procedure... 106
2.3 The D ata... 109
2.3.1 The British Household Panel Survey... 109
2.3.2 The German Socio-Economic Panel... 112
2.3.3 Sample statistics... 113
2.4 Descriptive statistics... 114
2.4.1 Wage growth: total, within jobs and between jobs... 114
2.4.2 Reasons for job separation, education and experience...117
2.5 Results... 119
2.5.1 Returns to tenure and experience... 119
2.5.2 Cumulative returns to tenure and experience by skill group...123
2.5.3 Negative selection of job movers... 124
2.6 Discussion o f results... 126
2.7 Conclusions... 129
Appendix 2.A Figures...131
Appendix 2.B Tables 137 Appendix 2.C Coefficients of regressions by qualification... 145
Appendix 2.D Data N otes...147
Chapter 3. Returns to seniority and experience in union and non-union jobs in Britain in the 80’s and 90s... 152
3.1 Introduction... 152
3.2 The model...155
3.4.2 Seniority pay scales and returns to experience... 172
3.5 Concluding remarks...176
Appendix 3.A Tables 178
Appendix 3.B Data N otes...186
Chapter 4. Summary o f findings...188
20-25 year old workers; (c) 30-35 year old workers...26
Figure 4 -1 ...131
Figure 4 -2 ...132
Figure 4 -3 ...132
Figure 4 -4 ...133
Figure 4 -5 ...133
Figure 4 -6 ...134
Figure 4 -7 ...134
Figure 4 -8 ...135
Figure 4 -9 ...136
Figure 5-1: Returns to tenure in union jobs...168
Figure 5-2: Returns to tenure in non-union jobs...168
Figure 5-3: Returns to experience in union jobs...169
Figure 5-4: Returns to experience in non-union jo b s... 169
Figure 5-5: Mean sample wage growth by years of tenure - union and non-union jo b s 170 Figure 5-6: Mean sample wage growth by years of tenure - union jobs with and without pay scales... 173
Figure 5-7: Mean sample wage growth by years of tenure - non-union jobs with and without pay scales... 174
List of Tables
Table 2-1: Differences in the proportional hourly wage growth...28Table 2-2: Differences in the number of workers and the number of hours...31
Table 2-3: Impact on the number of workers according to firm type...36
Table 2-4: Impact on the Number of workers: panel of firms and representative samples’ results compared...40
Table 2-5: Summary statistics for the panel of firms sampled in 1986...42
Specifications of Equation (3.2)... 93
Table 3-4: The Effect of Foreign-Affiliate Presence on Productivity Specifications of Equation (3.2) By Absorptive Capacity... 94
Table 3-5: The Effect o f Foreign-Affiliate Presence on Productivity Specifications of Equation (3.2) By Different Source Countries... 95
Table 3-6: The Effect o f Foreign-Affiliate Presence on Productivity Specifications of Equation (3.2) With Various Robustness Checks... 96
Table 4-1 : Summary Statistics - Mean sample characteristics for white males...114
Table 4-2: Returns to tenure and experience - OLS, IV and 2-Stage method... 137
Table 4-3: Returns to tenure and experience - other specifications... 139
Table 4-4: Cumulative returns to tenure and experience by qualification - UK...141
Table 4-5: Cumulative returns to tenure and experience by qualification - Germany...142
Table 4-6: Wages and job number in the United Kingdom... 143
i Table 4-7: Wages and job number in Germany... 144
Table 4-8: Coefficients of tenure and experience by qualification - UK... 145
Table 4-9: Coefficients of tenure and experience by qualification - Germany... 146
Table 5-1 : Summary Statistics for white males in the British Household Panel Survey...178
Table 5-2 A. and B.: OLS and Instrumental Variables Returns to Tenure and Experience...179
Table 5-3: Evolution o f returns to tenure in the union and non-union sectors (OLS)...181
Table 5-4: Evolution of returns to experience in the union and non-union sectors (OLS)...182
Table 5-5: Evolution o f returns to experience in the union and non-union sectors: least squares’ coefficients...183
Table 5-6: Cumulative returns in jobs with and without pay scales in the union sector...184
Chapters 2 “The impact of minimum wages on youth employment in Portugal”
and 5 “Returns to seniority and experience in union and non-union jobs in Britain in
the 80’s and 90s” are single authored. Chapter 3 “Does inward foreign direct
investment boost the productivity of domestic firms?” is joint work with Jonathan
Haskel and Mathew Slaughter. Chapter 4 “An illustration of the role of job mobility in
the estimation of returns to job seniority and labour market experience: a comparison
of the U.K. and Germany” is joint work with Christian Dustmann.
^
Data Sources
Data from Quadros de Pessoal in Chapter 2, was kindly provided by the
Statistics Department of the Portuguese Ministry o f Qualification and Employment.
The Annual Census o f Production Respondents Database was used in chapter 3 as
part o f the U.K. Office of National Statistics business-data-linking project. The British
Household Panel Study and the Labour Force Survey have been provided by the UK
Data Archive. The data for Germany was made available by the German Socio-
Economic Panel Study (SOEP) at the German Institute for Economic Research
Chapter 1. Introduction
This thesis is composed of four empirical studies which use data from
Portugal, the United Kingdom and Germany to examine four topical aspects of
employment, careers and productivity in these countries’ labour markets. The second
chapter studies the impact that a 49.3% change in the legal minimum wage (MW) for
workers aged 18 and 19 in Portugal had on the wages and employment of this age
group o f workers. It uses firm-level micro data to compare the employment growth of
18-19 year old workers with employment growth o f older workers. In addition, it
compares employment outcomes in firms more likely to be affected by the MW
change with firms less likely to be affected, where a firm is more likely to be affected
if it was paying wages below the adult MW to workers aged 18 and 19 in 1986. The
main findings are that the increase in the minimum wage significantly reduced
employment of 18 and 19 year-olds, but increased employment o f 20-25 year-olds.
The third chapter aims at providing an answer to the following question: are
there productivity spillovers from foreign direct investment (FDI) to domestic firms,
and, if so, how much should host countries be willing to pay to attract FDI? To
examine these questions we use a plant-level panel covering U.K. manufacturing from
1973 through 1992. For empirical purposes, we distinguish two main channels
Productivity spillovers along industry lines would take place if domestic firms learn
from affiliates in the same industry. This can happen via trade shows,
supplier/distributor discussions, exposure to affiliate products, marketing, and patents,
technical support from affiliates, reverse engineering, etc. Spillover mechanisms along
regional lines would be empirically observed if spillovers happened as a result of
labour turnover. If at least some of the knowledge particular to foreign affiliates is
embodied in their labour force, and if inter-regional labour mobility within a country
is low, then these spillovers are likely to be concentrated within regions where the
affiliates operate rather than dispersed country-wide. Across a wide range of
specifications, estimates show a significantly positive correlation between a domestic
plant’s TFP and the foreign-affiliate share of activity in that plant’s industry. This is
consistent with positive FDI spillovers along industry lines. Typical estimates suggest
that a 10 percentage-point increase in foreign presence in a U.K. industry raises the
TFP of that industry’s domestic plants by about 0.5 percent. We do not generally find
significant effects on plant TFP o f the foreign-affiliate share of activity in that plant’s
region. Calculations based on our estimates show that per-job incentives governments
have granted in recent high-profile cases appear to be higher than the per-job value of
these spillovers.
The fourth chapter estimates the returns to tenure and experience in the United
Kingdom and Germany using various methods to correct for heterogeneity and
endogeneity biases. We show evidence that job mobility is higher in the UK than in
Germany, and that job movers are negatively selected in Germany and not in the UK.
In our discussion o f the results we point out that these results can be driven by
as well as by adverse selection of job movers in Germany due to low mobility in a
context of asymmetric information between current and prospective employers about
workers’ ability. After correcting for most bias associated with job and individual
heterogeneity, our findings suggest that returns to tenure are close to zero in both
countries and returns to experience are substantially higher in the UK than in
Germany. According to our estimates, ten years of labour market experience are
associated with average wage returns o f between 60 and 70 percent in the UK and
between 30 and 40 percent in Germany. Separate estimates for different qualification
groups show that in Germany, it is the group of workers with apprenticeship training
that is driving the low returns to labour market experience. The underlying reason can
be that the German Apprenticeship system may provide workers with general skills
which accrue already at the starting of the post-apprenticeship wage, resulting in
lower wage growth with labour market experience.
The fifth chapter compares returns to tenure and experience in the union and
non-union sectors in the United Kingdom in the 90s. Our results show that returns to
tenure are only insignificantly different firom zero in union jobs and when estimated
with least squares. When instrumental variables are used to correct for individual and
job match heterogeneity returns to tenure are insignificantly different from zero in
both sectors. While there is no evidence of heterogeneity bias in the non-union sector,
results suggest positive heterogeneity bias in the union sector. This would seem
unconvincing under the usual interpretation of ability and job-match induced biases.
However, it is consistent with a plausible hypothesis of union wage mark-up
heterogeneity affecting duration of jobs. Returns to experience are lower in union jobs
result is nevertheless rather robust, since it holds for all the period analysed, and with
all estimation methods. Finally, contrary to previous evidence and unlike in non-union
jobs, we find no evidence that returns to experience are higher in union jobs with pay
Chapter 2. The impact of minimum wages on youth employment
in Portugal
2.1 Introduction
This chapter evaluates the employment impact of an increase in the minimum
wage of teenagers that took place in Portugal on the 1®* of January 1987. At that date,
workers aged 18 and 19 became entitled to the full minimum wage, instead of 75% of
the adult wage as had previously been the case. Thus, the legal minimum wage for this
specific age group increased 49.3% between 1986 and 1987 (a 35.5% increase in real
terms). Since between 1986 and 1987 the minimum wage for workers aged 20 or more
increased by 12% (1.6% in real terms), the wage increase of workers aged 18 and 19
relative to the one o f the older workers was 37.3% (33.9% in real terms). The
occurrence of such a large shock in the minimum wage potentially offers a “natural
experiment” in which the employment of 18 and 19 year olds can be compared with
that of older workers.
This methodology is not new in evaluating the impact of the minimum wage
(MW) on employment. Earlier studies on the MW by Richard Lester (1946) and
minimum wage in the US’. This approach has more recently been revived by Card
(1992a), Card and Krueger (1994) using MW cross state variations in the US and by
Card (1992b), Katz and Krueger (1992) and Bernstein and Schmitt (1998) to look at
the effect of changes in the US federal law.
The “natural experiment” approach has a clear advantage over other most
common methodologies since it makes use of well identified exogenous variation in
the minimum wage. In many time-series and cross-section studies, which use the ratio
of the MW to average wages or the Kaitz index (H. Kaitz, 1970), there is typically
little variation. Moreover, MW variation may be endogenous, to the extent it depends
on political decisions which may be based on employment expectations. This
potentially biases estimates of employment effects.
The existing evidence fails to give a clear-cut answer about the employment
effects o f minimum wage policies. In their thorough survey. Brown, Gilroy and
Kohen (1982) concluded (mainly based on time-series studies using US data before
the 1980s) that a 10% increase in the minimum wage reduces teenage employment by
1 to 3%, though with no identifiable effect on the adult labour market. This apparent
consensus has been challenged by subsequent research well represented in Card and
Krueger (1995). By using different datasets and methodologies as well as
reinterpreting and re-examining previous studies they concluded that “the new
evidence points towards a positive effect of the minimum wage on employment; most
shows no effect at all” (page 1).
Their work has been a source of controversy (see the reviews of Card and
Krueger in the Industrial and Labor Relations Review, 1995; papers on the minimum
wage in the American Economic Review, 1995; Neumark and Washer, 1995) and has
been followed by a resurgence of work on this topic. In his recent re-evaluation of the
minimum wages empirical literature using US data, Brown (1999) concluded that “the
short-term effect of the minimum wage on teenage employment is small [...] (and
zero is often hard to reject)” (page 2154).^
The Portuguese MW change is of particular interest since it is so large and
aimed directly at teenagers. Most theoretical frameworks predicting non-negative
employment elasticities do not apply to “large enough” minimum wage increases.
Also, it is generally accepted that youths are more likely to have larger minimum
wage employment elasticities (Brown et al., 1982, Dolado et al., 1996, Abowd et al.,
1997, OECD, 1998). In addition, employment effects o f minimum wage changes may
depend strongly on the particular context in which they are implemented. In the period
from 1984 to 1986 the average ratio of minimum wages to average wages in Portugal
was still 56%. In the US this ratio was already below 50% during the 70’s, and went
well below 40% during the 80s^. In addition, the share of workers under 20 paid close
to the minimum in that period is considerably higher (see Section 3.4 below). Finally,
the fact that Portugal is a small open economy with little possibility of adjusting to
such a shock via product price increases adds to the reasons for a potentially strong
negative employment impact. In fact, Portugal was already part of the European
Union and the secondary sector was still strong relative to the services sector. It is
well known that services sector industries, many o f which are not traded across
international borders, have a much better chance of insulating themselves from shocks
due to less international competition.
This study finds that in Portugal the 1987 abolishment of the sub-minimum
wage for teenagers had a negative impact on their employment. The estimated
employment elasticity is in the range between -0.2 and -0.4. For the factors set out
above, these values are at the top o f the range (in absolute terms) of values usually
found in the MW literature. There is also evidence of some substitution towards older
workers (i.e. young adults’ relative employment seems to have risen with this MW
policy).
The structure of this chapter is as follows. The next section summarises the
conditions under which the change in the law took place. Section 2.3 describes the
data used. Section 2.4 inspects the wages of the various age groups of workers before
and after the MW change. Section 2.5 presents the difference in differences analysis
which is extended by using firms as control groups in section 2.6 and by including
firm entrants and exitors in section 2.7. Section 2.8 concludes.
2.2 “The Quasi-Experiment”
Monthly statutory minimum wages were introduced in Portugal in 1974
following the democratic revolution in the same year. Up until 31^^ December 1986,
workers aged 20 years or older were entitled to the full statutory minimum wage,
while 18 and 19 year old workers were entitled to 75% of the adult minimum wage.
Changes in MW levels were then expected to occur every January, as since 1983 this
had been the common practice'*. In August 1986 there was for the first time news in
the Portuguese press about changing the starting age for full MW entitlement. The
change to the law was announced in the daily papers on the last day of that year. Thus,
from 1®^ January 1987, workers became entitled the full minimum wage from the age
of 18\ The minimum wage change was remarkably large. Between December 1986
and January 1987, the younger workers saw their MW increase by 49.3%, while
workers aged 20 or more had an increase in their MW of only 12%. The
corresponding percent increases in real terms are 35.5% for the former group and
1.6% for the latter one. This implied that workers aged 18 and 19 experienced a wage
increase relative to the older workers of 37.3% (33.9% in real terms).
The MW change under analysis is likely to have been exogenous with respect
to employment. The logic behind the new law had to do with legal rights and
citizenship. In the past, an individual had been considered an adult for legal matters at
the age of 21. During the eighties it had been already established that 18 would be the
age at which an individual would be entitled to full rights and duties in the legal
system. This law generalised this principle to the statutory minimum wage.
This study looks at the short and medium term impacts of this change, using a
five year panel o f firms, from 1985 to 1989. The information collected at each wave
refers to March of each year. Thus, the 1986 wave corresponds to a point in time 9
months before the change, the 1987 wave to 3 months after, and the 1988 wave to 15
months after. The analysis mostly uses data for 1986 and 1988. The time elapsed
* The minimum wage levels were revised on a year basis to take into account the evolution of
inflation and average wages.
between March 1986 and the change in the law is long enough to ensure that no
anticipated adjustments were made.
To identify the employment effects of the MW shock, the employment of
workers aged 18 and 19 is compared with that o f older workers. This procedure hinges
on the assumption that in the absence of this shock, employment growth during the
period under analysis would not differ with age. In other words, the employment
impact will be measured as the difference between the change in the 18 and 19 year
olds’ employment stock and the change in the older workers’ employment stock.
Since we had to formulate a parsimonious firm-level data request, we chose two age
bands of older workers: 20 to 25 and 30 to 35.
Given the specific context of this quasi-experiment, a distinction must be
made between employment flows and stocks. The data used contains the stock of
employment of different ages in firms at a given time. It does not have information at
the individual level nor on how individuals’ employment varies as they age. Thus,
because we use a random sample of 30% of the Portuguese firms®, it is as if we
conduct a comparative static analysis of the three age groups’ employment in the
entire working population. In summary, this experimental design will provide an
answer to the following question: did the Portuguese firms change on average the age
structure of their workforce in response to the increase in the relative cost of the
young workers?
In comparing the employment evolution of the three groups of workers it is
important to note that only the relative employment effect on the younger group can
ranges as well as the few number of firms employing these workers, the analysis focus only on 18 and 19 year olds.
be identified. Thus the measured employment effect understates the true employment
effect if firms reduce production and therefore reduce employment at all age levels.
But the impact on teenagers could overstate the overall MW effect if firms substitute
away from employing teenagers, while favouring the recruitment of older and
therefore more experienced or qualified workers. In order to identify the employment
impact on the younger group, we assume that while firms might substitute teenagers
for 20 to 25 year olds, the substitutability between 18 and 19 year olds and 30 to 35
year olds is negligible, as these workers are much more likely to differ in terms of
individual and job characteristics. As the older workers’ employment is a reference
measure against which employment of both younger groups is compared, both direct
employment effect on the 18 and 19 year olds and substitution effect towards workers
aged 20 to 25 can be identified.
2.3 The data
The data used in this work was computed from Quadros de Pessoal (QP), an
extensive data source produced by the Statistics Department of the Portuguese
Ministry o f Qualification and Employment^. All firms established in Portugal with
paid workers are legally required to report to this database*. A random sample of 30%
of the Portuguese firms in 1986* was drawn. The panel was then constructed by
^ The data was kindly supplied by the Statistics Department o f the Portuguese Ministry o f Qualification and Enployment.
* See Cardoso (1997) for more details.
following these firms up to 1989. Entrants and exiting firms were added to the panel
to ensure representativeness
For each of the age groups, the following firm level variables were collected:
number of workers on the payroll of the firm, average monthly hours, average
overtime hours, total wages for normal hours and total wages for overtime. The
following set of firm characteristics" was also collected: size, district and industry.
2.4 Minimum wages and wage changes
This section investigates the minimum wage impact on average wages and wage
distributions of the three age groups. Figure 2-1 depicts the monthly wage’^
distributions in 1986 and 1987". For the workers aged 18 and 19 (Figure 2-la) there
are two spikes in 1986: one at the interval 16-18 and another one at the interval 22-24
thousand escudos. The former is at the minimum wage for this age group (16875
escudos)'^. The latter is at the general compulsory minimum wage for non-agricultural
workers aged 20 or older (22500 escudos). Since the wage distributions include part
time workers, the “true” spike at the minimum wage should be even higher than the
one depicted. As the minimum wage is set monthly, the relationship between these
"a random sample o f 30 percent o f the firms that started activity in 1987 was drawn and these firms
were followed until 1988. Additionally, random sangles o f 30 percent o f the firms that started activity in 1988 and o f 30% o f the firms that ceased or started activity from 1985 to 1986 were collected.
" For the panel, this information refers to the year o f 1986; for entries and exits, refers to the relevant years. Date o f creation o f the firm was not available in the survey in those years, and other financial and ownership indicators were information not disclosed because o f confidentiality concerns.
" These are the gross monthly wages for normal hours.
" The statistics in these distributions were ordered from the Statistics department o f the Ministry o f Qualification and Employment, and are therefore conq)uted directly from the Universe o f Portuguese workers for the three age groups. This was the most desegregated wage data possible by age group, since the wage intervals depicted were the ones made available by the Statistics department o f the Ministry of Qualification and Employment, and not the ones chosen by the author.
workers’ wages and the minimum wage is lost. This helps explain the existence of
workers paid below the 18-19 year old minimum. Other possible explanations are
partial minimum wage exemptions for handicapped workers, apprentices and very
small firms'^ and non-compliance (the distributions shown include all these). 15% of
the workers lie in the 16-18 interval, while 20% lie in the 22-24 interval. This
indicates that the sub-minimum for 18-19 year olds imposes a binding restriction on
their wage distribution, although part of these workers are already paid at least the full
MW. Efficiency wages, insider-outsider theories, and internal markets may all help
explain why a considerable number of 18-19 year old workers are paid above their
minimum wage. Employers may find it advantageous to pay their 18 and 19 year old
workers the full minimum wage if it enhances their morale, increases productivity or
reduces turnover. In addition, employers may encounter difficulties in implementing
pay discrimination based on age among workers performing similar tasks, which
would explain the spike at the full MW.
(a)
(b)
20000
I 15000
i 0 10000
1
I
5000o «N <N
m ^ ^ ^ 8
□ 1986 ■ 1987
Thousand escudos
60000
g 50000
I 40000
0 30000
1 20000
^ 10000
0
*
1 1 :
■ \
rl
n
f i j j , ,
- l-'t—
f1
j
□ 1986 ■ 1987
9 ^ 3
Thousand escudos
30000
25000
20000 ' à - '• n
,
-1.
0 15000
« 1 10000
^ 5000
J ' l
o 0 0 ^ o
Thousand escudos
PTI
I #
Î
□ 1986 ■ 1987
(c)
Source: Quadros de pessoal, DEMQE.
Figure 2-l(a-c): Wage distributions in 1986 and 1987. (a) 18-19 year old workers; (b) 20-25 year old workers; (c) 30-35 year old workers.
In 1987 however, a very sharp spike can be observed at the 24-26 interval,
olds received wages within this interval*®. Looking at the wage distributions for the
20-25 year olds in 1986 (Figure 2-lb) it is clear that the compulsory minimum wage
cuts the wage distribution. The minimum wage spike in 1987 is somewhat smaller
than the one in 1986 so, if anything, the minimum wage lost some of its bite between
1986 and 1987. Moreover, the wage distribution shows some signs of having moved
up independently of the minimum wage change. The same applies to the evolution of
30-35 year old workers wage distributions (Figure 2-lc).
To examine this visual impression more formally the following equation is
estimated:
(2.1)
The dependent variable is the proportional change in the real hourly wage of
workers of age group i in firm j between 86 (the year before the MW change) and year
r, after the MW change, where t may be 87, 88 or 89. is a dummy variable equal to
1 for the 20-25 year old group, and is 1 for workers aged 30 to 35. Xj is a vector
with the firm characteristics at time /=0. pi and P2 are the difference in difference
estimators: they measure the difference in the proportional wage change between each
of the older groups and the omitted younger group of workers.
As the new law was enforced firom January 1987, the average wage of the 18-
20 group is expected to rise markedly between March 1986 and March 1987. pi and P2
are therefore expected to be negative, given the lower wage growth of the 20-25 and
30-35 year olds.
Table 2-1: Differences in the proportional hourly wage growth
1986 and 1987 1986 and 1988 1986 and 1989
Dummy = 1 if age is [20-25] -0.074** -0.059** -0.057**
(0.005) (0.012) (0.010)
Dummy = 1 if age is [30-35] -0.067** -0.059** -0.044**
(0.005) (0.012) (0.010)
Constant 0.112** 0.122** 0.256**
(0.012) (0.019) (0.038)
Number o f firms 15258 13286 11952
Number o f observations 25388 22084 19937
Note: The dependent variable is the time difference in the average hourly w age divided by the hourly wage in 1986. Hourly wage used is for normal time, but the results remain unchanged i f overtime pay is included. Robust standard errors in parenthesis. Other regressors are: size, 19 industry dummies and 7 region dummies. The number o f observations is less than three times the number o f firms because not all firms employ workers o f all age groups, thus the w age variable has m issing values.
* - Significant at 5% level., - Significant at 1% level.
Table 2-1, column 1 shows that between 1986 and 1987 the proportional wage
growth o f workers aged 20 to 25 was 7.4% below the wage growth of workers aged
18 and 19 and that the wage growth of workers aged 30 to 35 was 6.7% below that of
teenagers. The other columns show that wage growth of the older groups was also
significantly negative for 1986-88 and 1986-89 but by less than in the 1986-87
interval‘s, giving evidence that the differences in the wage growth took place between
1986 and 1987 only.
How can the wage growth o f 18 and 19 year olds be only around 7% higher
than the wage growth of older workers, if they experienced a relative minimum wage
increase of 33.9 percent? A possible explanation could be the presence of ripple
effects, i.e., the wages of older workers could have increased with the 18 and 19 year
olds’ wage increase as an indirect effect of the minimum wage shock. Ripple effects
could occur due to internal markets, with relative wages inside the firm playing an
important role in wage determination. By comparing the wage growth rates of older
workers in 1986-87 with the other years for which there is data available, we find
evidence o f what can be interpreted as a mild ripple effect. Table 2-6 in the appendix
shows the real hourly wage growth for the panel of firms sampled in 1986 by age
group. The real hourly wage growth for the 20-25 year olds is 3.7 percent between
1995 and 1996, 4.5 between 1996 and 1997, 0.8 between 1997 and 1998, and 2.4
between 1998 and 1999. For the 30-35 year olds the corresponding wage growth rates
are 3.5, 5.2, 0.9 and 4.9 percent. The hourly wage growth rates for the 20-25 and 30-
35 year olds seems to have been slightly higher between 1986-87 than in the
remaining available years, which could be a consequence of the minimum wage
shock.
It seems plausible therefore that the major explanation for the difference found
between relative minimum and average wage increases o f the 18 and 19 year olds in
1986-87 is the fact that in 1986 a considerable proportion of these workers were
already paid at least the full minimum wage. In any case, both the wage distributions
in figure 2.1 (a-c) and the wage regressions in table 2.1 give evidence that the
abolishment o f the wage reduction for teenagers in 1987 had a significant impact on
their relative wage increase.
2.5 Estimates of employment effects
The formulation used to estimate the employment effects is similar to the one
for the wages, where now the dependent variable, ÆVÿf, is the change in the number of
workers of age group i in firm j between 86 (the year before the MW change) and year
t, after the MW change, where t may be 87, 88 or 89:
A N y , = a + A D '' + A D '" + rXj + Sy, ( 2.2)
Xj is a vector of the firm characteristics in 1986. is a dummy variable equal
to 1 for the 20-25 year old group, and is 1 for workers aged 30 to 35. pi and A are
the difference in difference estimators: they measure the difference in the employment
change between each of the older groups and the omitted younger group of workers.
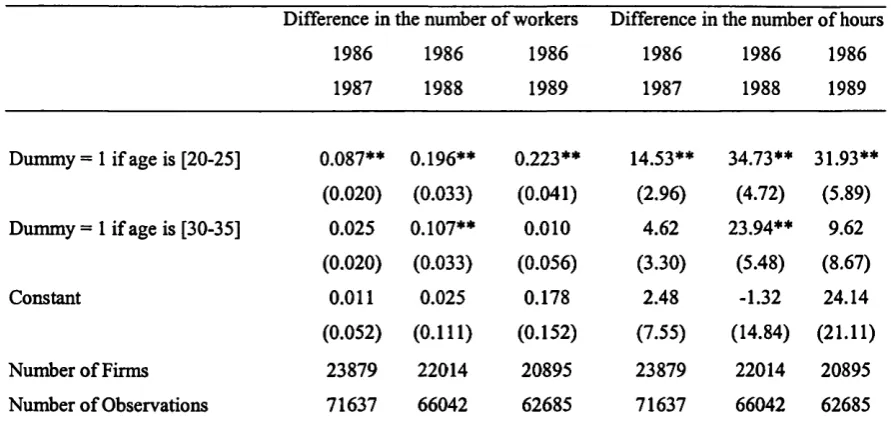
The results of estimating (2.2) are set out in the first 3 columns of Table 2-2. Each
column estimates (2.2) for different year intervals. Looking at the first row, sign and
standard errors of the coefficients show that employment of 20-25 year olds rose
significantly relative to teenagers in every period. Looking at the second row, the
coefficients for the older workers are also positive but smaller and only significant for
the difference between 1986 and 1988. This suggests a negative impact on the 18-20
year olds employment and a substitution effect between 18-20 year olds and 20-25
Table 2-2: Differences in the number of workers and the number of hours
Difference in the number o f workers Difference in the number o f hours
1986 1986 1986 1986 1986 1986
1987 1988 1989 1987 1988 1989
Dummy = 1 if age is [20-25] 0.087** 0.196** 0.223** 14.53** 34.73** 31.93**
(0.020) (0.033) (0.041) (2.96) (4.72) (5.89)
Dummy = 1 if age is [30-35] 0.025 0.107** 0.010 4.62 23.94** 9.62
(0.020) (0.033) (0.056) (3.30) (5.48) (8.67)
Constant 0.011 0.025 0.178 2.48 -1.32 24.14
(0.052) (0.111) (0.152) (7.55) (14.84) (21.11)
Number o f Firms 23879 22014 20895 23879 22014 20895
Number o f Observations 71637 66042 62685 71637 66042 62685
Note: The dependent variable in columns 1 to 3 is the difference in the total number o f workers in the payroll o f the firm and in colum ns 4 to 6 is the difference in the total number o f hours worked (normal hours and overtime). Robust standard errors in parenthesis (random effects). Other regressors are: size, 19 industry dummies and 7 region dummies. Region dummies are in m ost cases not significant, while other controls are significant. Firm controls just reduce slightly standard errors, not affecting the coefficients. * - Significant at 5% level, ** - Significant at 1% level.
The above results point to an employment-minimum wage elasticity of -0.4
for the 18-19 year olds in the period 1986-88. This elasticity is computed based on the
differences-in-differences estimation with the 30-35 year olds for the period
1986-1988. The elasticity’s numerator is the percent relative employment change, i.e.,
the ratio between -0.107 and the 18-19 year olds average employment in 1986 in the
firms used in the regression, 0.785**. The elasticity’s denominator is the percent
variation in the real minimum wage for the same group of workers relative to older
workers (35.5-1.6)*’. The gross elasticity of substitution between 20-25 year olds and
teenagers can be calculated in a similar way. The elasticity’s numerator is the percent
employment change of 20-25 year olds net of employment change of 30-35 year olds.
This elasticity uses the difference between the difference-in-differences estimation
** 0.785 is the ratio between the total number o f 18-19 year olds in 1986 in the firms surviving until 1988 (row 6, column 3 o f table 2.5 in the appendix) 17,291, and the total number o f firms present in 1986 and 1988 (row 1, column 3 o f table 2.5 in the appendix) 22,014 .
with the 20-25 year olds (0.196) and with the 30-35 year olds (0.107) for the period
1986-1988. For the numerator this difference, 0.089, is divided by the 20-25 year olds
average employment in 1986 in the firms used in the regression, 2.798“ . The
denominator is again the percent variation in the real minimum wage for the 18-19
year olds relative to that of older workers (35.5-1.6). The gross elasticity of
substitution between 20-25 year olds and teenagers is 0.09^'. Similar calculations for
the interval 1986-89 would yield a negligible 'direct' elasticity for the 18-19 year olds
and a somewhat larger gross substitution elasticity between the 20-25 year olds and
the younger workers. This will be discussed in section 6 where additional results will
help shed some light on this apparent puzzle. It is worth noting that although we
favour a specification which uses employment levels instead of logarithms^, when
differences in log-employment are used as dependent variable, and
coefficients are positive and significantly different from zero for all year intervals.
The impact of a minimum wage shock on wages and employment depends on
the initial distribution of wages. One may for this reason be interested in calculating
the average wage-employment elasticities in addition to the minimum wage-
employment elasticities. Similar calculations to the ones described above apply, where
now the denominator is the difference between the 18-19 year olds and the older
groups’ proportional hourly wage growth for the period 1986-88, i.e. minus the
“ 2.798 is the ratio between the total number o f 20-25 year olds in 1986 in the firms surviving until 1988 (row 7, column 3 o f table 2.5 in the appendix) 61,615, and the total number o f firms present in 1986 and 1988 (row 1, column 3 o f table 2.5 in the appendix) 22,014 .
0.0009 = (0.089/2.798)/(35.5-1.6).
“ Using Aln(Nijt) is consistent with assuming that in the absence o f the MW change firms would
vary the employment o f all age groups in similar percentages and using A(Nÿ^ is consistent with
estimated coefficients of the older groups’ dummies shown in Table 2-1. The
employment-average wage elasticity for the 18-19 year olds based on differences-in-
differences estimation with the 30-35 year olds for the period 1986-88 is 23^^ percent
and the gross elasticity of substitution between the 20-25 year olds employment and
teenagers average wage is 5.4^'* percent.
Finally, the key identifying assumption of the difference-in-differences
estimator is that in the absence of the minimum wage shock, the average employment
change in all groups would be the same:
P g = 0 , g = l , 2 or e[s,j\d^ ,D ^ ^ = Q.
Any other labour market shock that took place between 1986 and 1989 and
that affected the three age groups’ employment growth in a similar way, is differenced
out by the difference-in-differences estimator and does not bias the results. However,
if there were other shocks with different impacts on the three age groups’ employment
growth, these would violate this estimator identifying assumption and would bias the
estimates. We are not aware of other demand side shocks that could have had an
asymmetric affect in any o f the three age groups. On the supply side, during the 80s
Portugal saw an increase in the number of university vacancies. This would be more
likely to affect employment and wages in the absence of unemployment. This was not
the case, however. 1986 is only the beginning of the economic expansion following
the harsh times that took place in Portugal during the first half of the decade. Still,
even in the presence o f youth unemployment, the increase in the number of university
vacancies could have affected the composition and quality o f the labour supply of 18
and 19 year olds and could potentially bias the above results. As a robustness check.
we extend the difference-in-difference estimator, by adopting a different experimental
design, which hinges on different assumptions in the next section.
Columns 4 to 6 of Table 2-2 show the coefficients for the impact on the
number of hours worked by the relevant age groups. The results mirror those for
employment. From the comparison of the coefficients for the two measures of labour
input (number of workers and number of hours worked) one can infer whether firms
adjust mainly through firing and (not) hiring or through adjusting their workforce’s
working time. Between 1986 and 1988 the average growth of the number of teenagers
per firm was 0.196 workers lower than the growth of young adults. These workers
would have to be working on average 177 hours per month to generate an average loss
of 34.73 in the number of hours if all employment adjustment had been made through
hiring and firing. For the results obtained with the 30-35 year olds this number is i
considerably higher (223.7 hours a month). In the sample, workers aged 18 and 19
work on average 165 hours per week in 1986, so the employment impact is not
completely captured by changes in the number of people working, but also through
the reduction of individuals’ working time.
It is worth noting that since hours of work are reported by the employer, they
may understate actual hours. For our analysis this could affect the above findings if,
for example, following the minimum wage rise workers faced increased pressure to
work longer hours. This could lead to a stronger understatement of the number of
hours worked after the minimum wage shock. The above findings of a negative
impact of the minimum wage change on the working hours would then be downward
biased. However, the reported hours of work for teenagers’ are on average very high
when compared to older groups at the time of the MW change. For the years 1986-
1988 18-19 year olds average monthly hours are between 165 to 169, while older
individuals work on average 153 to 158 hours. This goes against the possibility of a
large understatement of the hours variable.
2.6 Second experimental design
One difficulty with the previous results is that different trends could be
affecting the different age groups, thus accounting for different employment paths,
rather than employment paths being a consequence of the MW. To investigate this we
adopt a second experimental design which groups firms according to their likelihood
of being affected by the MW change. A firm is more likely to be affected if the
average wage paid to teenagers in 1986 is at or above the MW due to teenagers in
1986 (the firm is complying with the minimum wage law) and not higher than the
MW for adults in 1986. A dummy variable Aj is introduced which takes the value 1
for firms more likely to be affected by the MW and 0 otherwise. The regression also
requires the interaction dummies AjxD^^ and AjxD^^:
ANy, =«0 + a,Aj+ J3,AjxD ^^+ /32Aj xD^'^ ^-yXj+Sy, (2.3)
The parameters of interest. Pi and P2 test whether the difference in differences
done in (2.2) are different between firms more likely to be affected by the MW change
and firms less likely to be affected by the MW change. The identifying assumption is
that if the difference between the employment changes of teenagers and older workers
certain firms are more likely to be affected by the change in the law than others, then
employment effects suggested by the previous results should be stronger among those
firms. Œ] captures the average difference in employment changes common to all age
groups between firms more likely to be affected by the minimum wage shock and
firms less likely to be affected. ai captures the average difference between the 20-25
year olds’ and the 18 and 19 year olds’ employment change that is common to the two
“types” of firms. a2 is similar to a , but for the difference between the 30-35 year olds
and the 18 and 19 year olds’.
Table 2-3: Impact on the number of workers according to firm type
1986 1986 1986
Dummy variables: 1987 1988 1989
^20 -0.004 0.053 0.087*
(0.020) (0.032) (0.040)
jÿO
-0.023 0.017 -0.082
(0.021) (0.036) (0.062)
Aj -0.495** -0.762** -0.854**
(0.051) (0.080) (0.114)
AjxD^'^ 0.830** 1.256** 1.192**
(0.086) (0.140) (0.179)
AjxD^^ 0.427** 0.795** 0.821**
(0.069) (0.098) (0.125)
Constant 0.062 0.108 0.267
(0.052) (0.110) (0.149)
Number o f Firms 23879 22014 20895
Number o f observations 71637 66042 62685
Number o f observations with Aj=l 7887 7515 7098
Number o f observations from
Firms enploying teenagers in 1986 20118 19026 18093
Table 2-3 shows the results of estimating (2.3). With the inclusion of the
interaction dummies, the coefficients of and became insignificant (only one
out of six is significant at the 5 percent level). In contrast, the interaction dummies’
coefficients are large and positive, and the coefficients of the interaction dummies
with are significantly larger than the ones of the interaction with These
results show that both the negative employment effect among teenagers and the
substitution effect towards 20-25 year olds is concentrated in the firms more likely to
be affected by the minimum wage change. Among those firms, the employment
effects persist until 1989 for the two older groups of workers. This partially solves the
previous puzzle in section 2.5, Table 2-2 in which the employment growth of 30 to 35
year olds exceeded the one of teenagers for the 1986-88 interval only. What is behind
the previous insignificant coefficients for the intervals 1986-87 and 1986-89 is a lower
growth (though the difference is not significantly different fi*om zero) of the 30 to 35
year olds’ employment compared to that of teenagers in firms less likely to be affected
by the MW change^\
Finally, the Aj coefficient is negative, significantly different firom zero and its
absolute value is increasing with the length of the year interval considered. This
implies that firms more likely to be affected by the minimum wage shock have
significantly lower employment growth of all age groups than firms less likely to be
affected. This can be a consequence of the minimum wage shock, since the minimum
wage increase has a negative effect on the overall resources of the firms employing
affected workers (income effect). Alternatively, it can also be that the unobservables
that lead some firms pay only 75 percent of the full minimum wage to their 18 and 19
year olds are also related to their lower overall employment growth. The crucial
assumption for our analysis is that these unobservables do not lead to asymmetric
employment growth of the three age groups.
2.7 Firms’ entries and exits
The fact that difference in differences are entirely based on firms that were
observed before and after the change in the MW may be a source of possible bias, as it
excludes from the analysis firms that died or were bom after 1986. Entry and exit of
firms is an important phenomenon in the Portuguese economy during the 80’s“ and
new firms are likely to absorb a disproportionately high share of younger workers, as
there are no tenure gains associated with its workforce. In addition, because the
workforce in a panel of firms is likely to age, the employment o f 18-19 year olds
could fall relatively to that of older workers, independently of the MW, and the
estimated employment effect of this age group would be biased downwards^^.
In order to deal with this difficulty, the previous analysis is extended to using
representative samples of firms before and after the MW change. As new firms are not
teenagers and young adults labour markets. Worker-level data would be required to investigate this issue further.
During the 80’s the share of entrants at any given year varied between 10 and 20 percent, while the share o f firms exiting at any given year was around 10 percent.
observed before 1987, neither are exitors observed after 1986, as the difference-in-
differences estimator would require, a 2-stage method is used to proxy the “missing”
employment values. This procedure takes firms that exit before the MW change (i.e.
between 1985 and 1986) and regresses the employment of each of the age groups on
the firms’ characteristics, size, region^* and industry^^. The resulting estimates are used
to predict the values of the various age groups’ employment of firms that exit between
1986 and subsequent years, given their characteristics. The idea is to produce a
counterfactual for what would have been the distribution of the age groups of the
exiting firms before the MW change. With this procedure, if for example firms that
exit when the minimum wage shock takes place have a higher firaction of 18-19 year
olds than the predicted share for firms with similar characteristics, that would be
measured as a negative employment effect.
The same is done with firms bom before the MW change (1986) to produce a
counterfactual for what would have been the age groups’ employment of entrants
before the MW change. If, for example entrants that enter after the minimum wage
change have a lower fraction of 18-19 year olds than that predicted by their
characteristics, that will be measured as a negative employment effect. The two stage
procedure aims at reducing the effect of firm and/or group specific unobserved
variables. An alternative simpler method is to input zeros on the “missing”
employment values of entrants and exitors.
change. Unfortunately, it will not be possible to correct for these biases as there is no suitable instrumental variable to provide identifying restrictions to model attrition.
The regional index at the distrito level divides Inland Portugal in 18 area locations. We’ve however
Table 2-4: Impact on the Number of workers: panel of firms and representative samples’ results compared
Age Groups original
results zeros for counterfactual 2-stage Procedure 1986 1987 1986 1988 1986 1987 1986 1988 1986 1987 1986 1988
Dummy = 1 if age is [20-25] 0.087** 0.196** 0.083** 0.204** 0.075** 0.144**
(0.020) (0.033) 0.016 0.022 (0.016) (0.021)
Dummy = 1 if age is [30-35] 0.025 0.107** -0.013 0.036 0.012 0.056**
(0.020) (0.033) (0.016) 0.022 (0.016) (0.022)
Constant 0.011 0.025 -0.018 0.066 0.030 0.044
(0.052) (0.111) (0.043) (0.071) (0.042) (0.064)
Number o f Firms 23879 22014 32871 37461 32871 37461
Number o f exiting firms 0 0 4063 5881 4063 5881
Number o f entrant firms 0 0 4929 9566 4929 9566
Number o f Observations 71637 66042 98613 112383 98613 112383
Note: The dependent variable is the difference in the total number o f workers in the payroll o f the firm. Robust standard errors in parenthesis. Other regressors are: 8 size dummies, 19 industry dummies and 7 region dummies.
• - Significant at 5% level, ** - Significant at 1% level.
Table 2-4 compares these two methods’ results with the ones obtained when
only the observations belonging to the panel were used. The coefficients are lower
when entrants and exiting firms are included. This suggests that excluding exitors and
entrants fi*om the analysis tends to overstate the employment effects. Representative
sample results provide the upper boundaries for teenagers’ employment elasticity^®
which is now -0.2 for the period 1986-88 when zeros are used as counterfactual and
Firms’ economic activity classification (CAE 6Digit) was rearranged into 18 broader groups, defined according to National Institute o f Statistics (INE) criteria.
-0.26 with the 2-step methodology. Given the possibility o f selective attrition, the true
employment elasticity is expected to lie somewhere in the interval between -0.2 and
the original value, -0.4.
2.8 Conclusions
This chapter estimates the wage and employment effects of a 35.5% increase
in the real MW of workers aged 18 and 19 that took place in Portugal on the 1®^ of
January of 1987. The main findings are the following. First, wages of workers aged
18-19 rose approximately 7% more than that of older workers. Second, employment
of workers aged 18-19 fell relatively to that o f older workers with an estimated
employment-MW elasticity in the range of -0.2 to -0.4. Third, there was a
substitution effect towards workers aged 20 to 25. Fourth, firms’ adjusted their
teenagers’ employment both through reducing the number of individuals employed,
Appendix 2.A
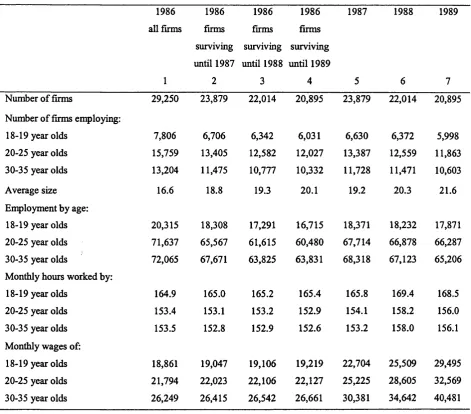
Table 2-5: Summary statistics for the panel of firms sampled in 1986
1986 1986 1986 1986 1987 1988 1989
all firms firms firms firms
surviving surviving surviving
until 1987 until 1988 until 1989
1 2 3 4 5 6 7
1 Number o f firms 29,250 23,879 22,014 20,895 23,879 22,014 20,895
Number o f firms employing:
2 18-19 year olds 7,806 6,706 6,342 6,031 6,630 6,372 5,998
3 20-25 year olds 15,759 13,405 12,582 12,027 13,387 12,559 11,863
4 30-35 year olds 13,204 11,475 10,777 10,332 11,728 11,471 10,603
5 Average size 16.6 18.8 19.3 20.1 19.2 20.3 21.6
En^loym ent by age:
6 18-19 year olds 20,315 18,308 17,291 16,715 18,371 18,232 17,871
7 20-25 year olds 71,637 65,567 61,615 60,480 67,714 66,878 66,287
8 30-35 year olds 72,065 67,671 63,825 63,831 68,318 67,123 65,206
Monthly hours worked by:
9 18-19 year olds 164.9 165.0 165.2 165.4 165.8 169.4 168.5
10 20-25 year olds 153.4 153.1 153.2 152.9 154.1 158.2 156.0
11 30-35 year olds 153.5 152.8 152.9 152.6 153.2 158.0 156.1
Monthly wages of:
12 18-19 year olds 18,861 19,047 19,106 19,219 22,704 25,509 29,495
13 20-25 year olds 21,794 22,023 22,106 22,127 25,225 28,605 32,569
14 30-35 year olds 26,249 26,415 26,542 26,661 30,381 34,642 40,481
Table 2-6: Real hourly wage growth for the panel of firms sampled in 1986
Age group 85-86 86-87 87-88 88-89
18-19 year olds 0.0344 0.0857 0.0037 0.0310
20-25 year olds 0.0368 0.0452 0.0084 0.0240
30-35 year olds 0.0352 0.0518 0.0087 0.0490
Chapter 3. Does inward foreign direct investment boost the
productivity of domestic firms?
3.1 Introduction
An important part of globalisation in recent years has been the ongoing rise in
foreign direct investment (FDI). UNCTAD (2000) reports that from 1979 to 1999, the
ratio of world FDI stock to world gross domestic product rose from 5% to 16% and
the ratio of world FDI inflows to global gross domestic capital formation rose from
2% to 14%. One consequence is that an increasing share of countries’ output is
accounted for by foreign affiliates of multinational firms. The foreign-affiliate share
of world production is now 15% in manufacturing and other tradables (Lipsey, et al,
1998).
An obvious policy issue for governments is whether incentives should be
offered to multinational firms to induce local affiliate production. In recent decades
dozens of countries have altered laws to at least grant multinationals national
(UNCTAD, 2000)/' Policy promotion of FDI is now common not just in developing
countries but in many developed countries as well. The exact values of FDI incentive
packages are typically hard to know, but the values of many well-known FDI
packages appear very high. In the late 1980s the U.S. state of Kentucky offered
Toyota an incentive package worth (in present value) $125-$ 147 million for a plant
planning to employ 3,000 workers (Black and Hoyt, 1989). In 1994 the state of
Alabama offered Mercedes an incentive package of approximately $230 million for a
new plant planning to employ 1,500 workers (Head, 1998). In 1991 Motorola was
paid £50.75 million to locate a mobile-phone plant in Scotland, employing 3,000
workers. The factory closed in 2001, and Motorola paid back £16.75 million in grants.
Siemens was offered £50 million in 1996 to locate a 1000-worker semiconductor plant
in Tyneside, in Northeast England. The factory closed 18 months later, at which point
Siemens had to repay £18 million in grants.
Is there economic justification for this kind of policy promotion? There would
be if the social returns to FDI exceed the private returns. One often-claimed
possibility is that inward FDI raises the productivity of domestic plants by bringing
new knowledge into the host country that is, at least partly, a public good.
There are thus two empirical questions that we seek to shed light on in this
chapter. First, are there productivity spillovers fi*om FDI to domestic firms? Second, if
so, how much should host countries be willing to pay to attract FDI? Despite the
public interest and policy importance of these two questions, there is very little
empirical evidence offering answers.