ABSTRACT
FRIED, ANDREW JOSEPH. Impact of Crack Sealant on Pavement Skid Resistance (Under the direction of Dr. Cassandra Castorena).
Crack sealant is a cost-effective form of preventive maintenance that is commonly used in North
Carolina due to its speed and ease of application as well as its ability to extend the service life of
a pavement. Crack sealing is typically ineffective at sealing pavements that experience high
levels of cracking. In addition, crack sealing of highly cracked pavements, while relatively
common in practice, can lead to a dangerous loss of skid resistance. This study examines the
impact of crack sealant application on pavement skid resistance for six different projects within
North Carolina. The Locked-Wheel Skid Tester (LWST) was used to collect the skid numbers on
several projects in North Carolina with varying amounts of sealant applied. The overband crack
sealant configuration was used in all projects evaluated. Photographs of the locations of LWST
measurements were obtained to determine the percentage of the pavement surface area covered
by crack sealant. A linear relationship between the percentage of crack sealant within the wheel
path and the skid number was observed for each project. The relationship between the percentage
of the wheel path covered by crack sealant and the skid number was found to depend on
pavement’s skid resistance prior to crack sealing. The results show that the application to
pavements with extensive alligator cracking can lead to pavement conditions with unsafe skid
resistance. The results of this study highlight the need for the inclusion of provisions in future
© Copyright 2018 by Andrew Joseph Fried
Impact of Crack Sealant on Pavement Skid Resistance
by
Andrew Joseph Fried
A thesis submitted to the Graduate Faculty of North Carolina State University
in partial fulfillment of the requirements for the degree of
Master of Science
Civil Engineering
Raleigh, North Carolina 2018
APPROVED BY:
_______________________________ _______________________________ Dr. Benjamin Underwood Dr. Brina Montoya
_______________________________ Dr. Cassandra Castorena
ii DEDICATION
I dedicate this thesis to my family and to my friends. Throughout my entire college career they
have been there offering me constant encouragement and assistance. To my parents, Curtis and
Carol, you helped me when I was struggling in school and refused to give up on me when I did not
believe in myself. Whenever I needed guidance on making a decision you were always there to
offer your support regardless of what I chose. To my friends, you kept me sane and laughing
iii BIOGRAPHY
Andrew Joseph Fried was born in Charlotte, North Carolina and grew up in Concord, North
Carolina. He is the son of Curtis and Carol Fried who moved to North Carolina from Florida
after deciding to start a family. He has a twin sister, Chelsea, and a younger sister Kayla who
now attends North Carolina State with him. He attended Jay M. Robinson High School and
participated in the North Carolina School of Science and Mathematics, where he decided that he
wanted to pursue a degree in engineering and eventually decided to go to North Carolina State
University for Engineering. Originally, he pursued an undergraduate degree in Nuclear
Engineering before eventually switching to Civil Engineering. While pursuing an undergraduate
degree he began assisting in the pavement lab while taking a materials of transportation class
with Dr. Cassie Castorena. While working in undergrad he assisted with projects in both
transportation materials and geotechnical engineering. This is how he became interested in
transportation materials and eventually applied to graduate school for a masters in transportation
materials. He finished his undergraduate degree in Civil Engineering in Fall of 2016 with a
concentration in structures. His interests include transportation materials and geotechnical
engineering and he took classes in both areas. His greatest joy in graduate school has been times
iv ACKNOWLEDGEMENTS
I would like to thank my parents, family, friends, and colleagues for their help throughout my
entire academic career. My parents encouraged me to switch majors in undergrad and were
incredibly understanding of needing more time to finish my undergraduate career as a result.
They encouraged me to continually better myself in school and pushed hard for me to continue
my education further than I initially planned and I am so grateful that they did. To all my friends,
you kept me going through graduate school when I thought it would be too much. Thank you
Casey for all of the lunch and coffee breaks and for reminding me to keep going even when we
are not 100% sure of where the final destination will take us. I would also like to thank Matthew
Hilderbran and Anthony Prelozny at NCDOT. Your help was essential for conducting LWST
tests and your assistance with the coordination of the field experiments and technical insights
was invaluable for this process. I also sincerely appreciate the experience and support from and
Pranav Hosangadi for his expertise and assistance with improving the MATLAB® image
processing algorithm. I would like to acknowledge and thank Farhad, Michael, and Arash. You
were the people who I worked the most with during my time in undergrad and were always open
to teaching me the more specific details of your work as well as other projects of interest. You
encouraged me to search for unique solutions to problems and to expand my knowledge around
pavements. To Dr. Montoya, thank you for widening my view in the civil department by giving
me the chance to work on a geotechnical project and for agreeing to sit on my committee. Dr.
Underwood, thank you for agreeing to sit on my committee and for always being willing to
answer questions that have come up throughout classes. Dr. Haritha Malladi deserves a special
thanks because of all the work she has put into this research project. You have consistently
helped me adjust to the rigors of graduate school and helped guide me in this project when I was
unsure of where to go. Finally, I would like to thank the person who had the largest influence on
my decision to continue pursuing education, Dr. Cassie Castorena. You encouraged me to work
in the lab as an undergraduate assistant and showed me the incredible world of research and first
sparked my interest in transportation materials and enabled me to continue to graduate school for
research. You are one of the kindest, most patient, and intelligent people I have ever been
blessed to work with and have the privilege to call my friend. Thank you for constant guidance, I
v TABLE OF CONTENTS
List of Tables ... vii
List of Figures ... viii
1. Introduction ... 1
1.1. Research Need ... 1
1.2. Objectives ... 2
1.3. Scope ... 2
1.4. Thesis Organization ... 3
2. Literature Review ... 4
2.1. Crack Sealant Overview ... 4
2.2. Crack Sealant Type ... 5
2.3. Crack Sealant Configurations ... 5
2.4. Crack sealant project selection Criteria ... 6
2.5. Comparison of the Skid Resistance of Different Preventive Maintenance Treatments 7 2.6. Crack Sealant Quality Control ... 8
2.7. NCDOT Specifications for Crack Sealing ... 8
2.8. Crack Sealant Contracts ... 9
2.9. Pavement Condition Survey Practices in North Carolina ... 9
2.10. Pavement Skid Resistance Measurements ... 13
2.10.1. Locked-Wheel Skid Number Thresholds ... 16
2.11. Summary of Knowledge Gaps ... 16
3. Methodology and Experimental plan ... 17
3.1. Test Sections ... 17
3.2. Locked-Wheel Skid Testing ... 18
vi
4. Results... 22
4.1. Baseline Skid Numbers ... 22
4.2. Relationship between SN value and Percentage of Pavement surface Area Covered By Crack Sealant ... 23
4.3. Relationship Between SN Value and Percentage of Wheel Path Covered by Crack Sealant ... 25
4.4. Establishment of Pavement Conditions Where Crack Sealing May Pose Safety Hazard ... 31
4.4.1. Allowable Percentage of Crack Sealant in Wheel Path ... 32
4.4.2. Allowable Pavement Distress Conditions ... 35
5. Conclusions and Recommendations ... 40
6. References ... 41
Appendix ... 43
vii LIST OF TABLES
Table 2.1 Crack Density Classifications (Decker 2014). ... 7 Table 3.1 Summary of Test Sections ... 18 Table 4.1 Baseline Skid Numbers ... 23 Table 4.2 Thresholds for Allowable Percentages of Crack Sealant in the Wheel Path to
Maintain Safe Conditions. ... 35
Table 4.3 Summary of Crack Sealant Coverage, SN Values, and Pre-existing Condition of Locations Evaluated. ... 36
viii LIST OF FIGURES
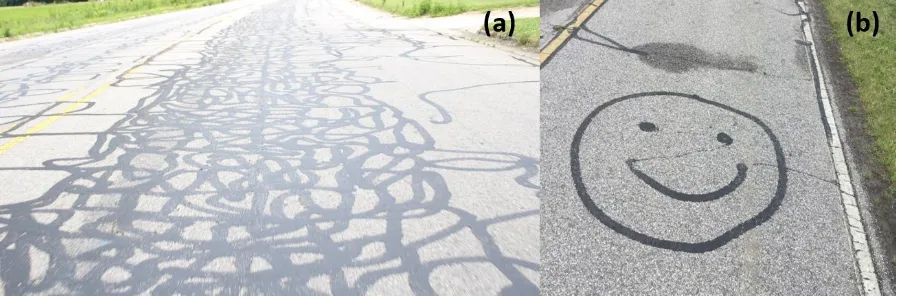
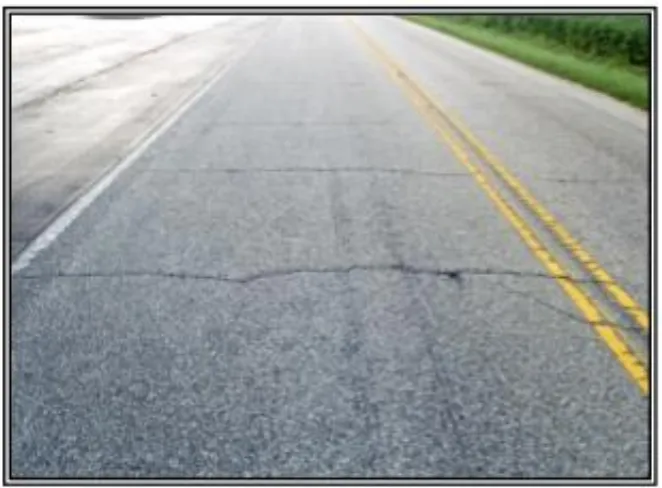
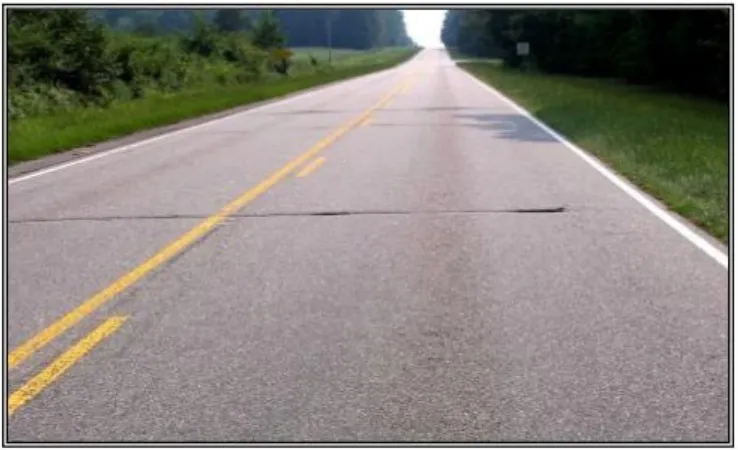
Figure 1.1 Examples of excessive crack sealant application in North Carolina. ... 2
Figure 2.1 Friction number comparison of different preventive maintenance treatments (Wang 2013). ... 7
Figure 2.2 Section showing what is considered one section of pavement on 2-lane highway (NCDOT 2012). ... 10
Figure 2.3 Example of severe alligator cracking (NCDOT 2012). ... 11
Figure 2.4 Example of severe oxidation (NCDOT 2012). ... 12
Figure 2.5 Example of transverse cracking (NCDOT 2012). ... 13
Figure 2.6 Locked Wheel Skid Tester (McCarthy et al. 2018). ... 14
Figure 2.7 Grip Tester (McCarthy et al. 2018). ... 15
Figure 2.8 Correlation between SN and GN (McCarthy et al. 2018). ... 15
Figure 3.1 Locked-Wheel Skid Tester. ... 19
Figure 3.2 Camera with GPS unit attached mounted to hood of car. ... 20
Figure 3.3 Image analysis process (a) initial image, (b) perspective fixed, (c) contrast increased and wheel path focused (d) binary image... 21
Figure 4.1 Relationship between LWST skid numbers and the percentage of the pavement lane covered by crack sealant for test sections in (a) Location A, (b) Location B, and (c) Location C (d) Location D, (e) Location E. ... 24
Figure 4.2 Relationship between LWST skid numbers and the percentage of the wheel path covered by crack sealant for test sections in (a) Location A, (b) Location B, (c) Location C, (d) Location D, (e) Location E and (f) Location F. ... 26
Figure 4.3 Relationship between LWST skid numbers and the percentage of the wheel path covered by crack sealant for all test sections. ... 27
ix Location A, (b) Location B, and (c) Location C (d) Location D (e) Location E
(f) Location F. ... 29
Figure 4.5 Combined relationship between change in skid numbers from the baseline and the percentage of the wheel path covered by crack sealant for test sections A, B, D,
E, and F. ... 30
Figure 4.6 Relationship between the change in skid numbers from the baseline and the
percentage of the wheel path covered by crack sealant for all test sections. ... 31
Figure 4.7 Relationship between LWST skid number and the percentage of the wheel path covered by crack sealant with 95 percent confidence intervals (dotted lines) for
(a) Locations A, B, D, E, and F, and (b) Location C. ... 33
Figure 4.8 Visual representation of (a) 17 percent crack sealant within the wheel path and (b) 27 percent crack sealant coverage within the left wheel path. ... 35
Figure 4.9 Relationship between location minimum skid number and max crack sealant
coverage in the wheel path. ... 37
1 1. INTRODUCTION
1.1. RESEARCH NEED
Crack sealing is a cost-effective method of preventive maintenance performed on roadways to
extend pavement service life. Crack sealing is applied within surface cracks. The sealant is
intended to form a water-tight bond and withstand thermal expansion and contraction of the
surrounding pavement, thereby preventing weakening of underlying layers and reducing the rate
of pavement deterioration (FCMNRC 2003). Crack sealant application is most effective when
conducted early in a pavement’s life, typically within the first three to five years (FCMNRC
2003). Crack sealing should be conducted on pavements with minor to moderate cracking and
good rideability because crack sealing does not improve the structural integrity of a pavement
(NCDOT 2012).
While crack sealing is an effective when applied to pavements in relatively good condition, crack
sealing is often applied to pavements with extensive cracking. An example is shown in Figure
1.1 (a). Pavements with extensive cracking are generally structurally compromised, making
sealing ineffective. Furthermore, if the crack sealant covers too much of the pavement surface
area, it can potentially degrade skid resistance. Skid resistance is critical to avoid accidents,
particularly in wet weather conditions. Crack sealant may cover too much of a pavement’s
surface area if either excessive crack sealant is applied (e.g., overband is too wide) or the extent
of cracks sealed on the pavement surface is too high. Furthermore, many agencies pay
contractors for projects based on the quantity of sealant applied (NCDOT 2012, Caltrans 2003,
MIDOT 2006); therefore, contractors may be indirectly incentivized to over-apply crack sealant
even in locations where cracks are absent. Evidence of the application of crack sealant to a
2 Figure 1.1 Examples of excessive crack sealant application in North Carolina.
Decker (2014) conducted a national survey as part of the development of a crack sealing best
practice guide to identify the criteria are used for determining if a pavement is a good candidate
for crack sealing. Eighty percent of respondents indicated that three criteria are used (FCMNRC
2003) type of crack, (NCDOT 2012) percentage of cracked area on pavement, and (CALTRANS
2003) crack width. Decker (2014) did not identify any agencies with crack sealant specifications
that directly prohibit skid loss. To develop such specifications, research is first needed to
quantify the effect of crack sealant application on the frictional properties of pavements.
1.2. OBJECTIVES
The objectives of this study are to:
(1) Quantify the effect of crack sealant application on pavement skid resistance; and
(2) Identify pavement conditions where it is unsafe to apply crack sealant.
1.3. SCOPE
This study investigates the relationship between the amount and distribution of crack sealant
application and pavement skid resistance. Locked-Wheel Skid Tester (LWST) testing was
conducted on several pavement projects in North Carolina with varying amounts and patterns of
crack sealant. Images of the locations of LWST testing were obtained and processed to
determine the percentage of the pavement surface area covered by crack sealant. The relationship
between the percentage of the wheel path covered by crack sealant and LWST results was
investigated. In addition, the relationship between the percentage of wheel path covered by crack
3 existing pavement conditions where crack sealing should be avoided because it could pose a
safety hazard.
1.4. THESIS ORGANIZATION
This thesis is organized into five chapters. Chapter 1 presents the research needs, objectives, and
scope. Chapter 2 is a review of the relevant literature. Chapter 3 presents the experimental and
analysis methods employed to evaluate the impacts of crack sealant on pavement skid resistance.
Chapter 4 presents the results of the field experiments, including the identification of pavement
conditions where crack sealing may pose a safety hazard. Chapter 5 summarizes the conclusions
4 2. LITERATURE REVIEW
2.1. CRACK SEALANT OVERVIEW
Crack sealant is a form of preventive maintenance that is often used due to the ease and
relatively undisruptive nature of its application. It is typically applied to cracks in asphalt
concrete that are determined to be “working” or active cracks (Stantec Consulting 2013). A
“working” crack is defined as a crack that has a width of at least 3 mm during the summer and
expands by 15 to 100 percent during the winter (Al-Qadi et al. 2009). The primary goal of the
crack sealant is to prevent the intrusion of water and other debris from infiltrating a crack; this
process can help extend the pavement life-span and improve rideability for 3 to 5 years by
preventing infiltration to the subgrade or base and slowing the growth of existing cracks (Hand
2000, Al-Qadi et al. 2009). When applied properly, crack sealants are expected to have a
life-span of 2 to 7 years, with reapplication recommend thereafter (Masson et al. 2004).
An INDOT study found that when comparing sealed joints to unsealed joints, there was not a
significant effect on pavement distress, ride quality, bridge encroachment, material integrity, and
pavement life (Hand 2000). However, it was found that crack sealing does provide benefit when
applied to cracks that form in the pavement. It was found that sections that had been crack sealed
exhibited less lipping and cupping at the edges of transverse cracking than unsealed sections. In
addition, it was found that the extent of cracking in sealed sections was lower when compared to
unsealed ones after two years of crack sealant application.
Crack sealant is applied manually using a wand attached to a heated trailer that melts the
material. The crack is routed prior to sealing if it is determined by visual inspection that the dirt
and debris could cause the sealant to not properly stick to the wall of the crack. All cracks are
cleaned with a hot air lance that removes debris before application. Once the hot air lance has
been used to clear debris, the sealant is applied via a heated wand. The sealant is spread to be
level with the surrounding pavement surface with a squeegee and allowed to cool to the ambient
pavement temperature. Crack sealant is typically applied during the late spring due to the
requirement of applying when pavement temperature is between its lowest and highest extremes
5 Not all types of cracking are ideal for crack sealing. A pavement that exhibits alligator cracking,
poor sub-base drainage, structural damage, or cracks with widths that exceed 20 mm, is not an
ideal good candidate for sealing (Stantec Consulting 2013). Identifying these routes early and
marking them as unfit for sealing could help reduce the amount of over-sealing that sometimes
occurs on lower volume roadways.
2.2. CRACK SEALANT TYPE
There are two main types of crack sealant application methods, hot and cold applied. Hot
application is more commonly used due to a myriad of benefits. The major benefits are the ease
of application, the amount of DOTs that have equipment for cold application is limited, the speed
at which the sealant is applied, and overall performance. This was backed up by research done by
a research team in Canada led by Yildirim (2007). Most crack sealants used in North Carolina
are hot pour sealants. The benefits of cold pour sealants include the reduced temperatures at
which they are applied, amount of time spent on construction, and their ability to fill cracks more
easily than hot-poured sealants (Yildirim 2007).
2.3. CRACK SEALANT CONFIGURATIONS
There are several types of crack sealant configurations that are used in practice, with the most
common including recessed fill, flush fill, and overband (Decker 2014). The type of crack
sealant application examined for the purpose of this project was overband due to its prevalence
in North Carolina. The overband configuration is favored by many DOTs due to the speed and
ease of application (Chehovits and Maning 1984). Overband sealant application involves heating
the crack sealant to the desired temperature and applying directly to the crack using a heated
wand. After application, the excess sealant is squeegeed so that the sealant is level with the road
surface. This entire process is more efficient and rapid compared to the recessed fill and flush fill
configurations. However, the disadvantages of the overband configuration include appearance,
rideability, and increased exposure to traffic and environmental factors due to the increase in
surface area (Chehovits and Manning 1984). Due to the smooth texture of the overbanded
sealant compared to pavement, there is a concern this configuration can lead to skid loss if a
significant amount of pavement is covered in sealant. Because of these concerns, the overband
6 The flush fill sealant configuration differs from the overband configuration in terms of
appearance and application site. Flush filled cracks are filled only to the surface of the crack and
not over; therefore, the flush filled configuration is less susceptible to tensile strains, is typically
more aesthetically appealing than overband, and can be used on higher trafficked routes
(Caltrans 2003). However, it is more difficult and time consuming to apply and does not
adequately seal cracks with edge deterioration (Caltrans 2003).
The recessed fill sealant configuration differs from the flush fill with respect to the height to
which the crack is filled. Recessed filled cracks are sealed to a height slightly below the surface
of the crack. This is done to prevent the sealant from being tracked by vehicles and being
damaged by snow plows (Caltrans 2003). The primary disadvantage of the recessed fill
configuration is the difficulty of its application. In order to be properly applied, cracks must first
be cleaned and then routed (Caltrans 2003).
2.4. CRACK SEALANT PROJECT SELECTION CRITERIA
Candidate pavements for crack sealing are identified based on crack width, crack depth, crack
density, and crack type and orientation based on a national survey distributed to state DOTs
(Truschke et al. 2013). In a similar survey conducted by Decker (2014), it was found that 80
percent of respondents used three criteria for determining the suitability of a pavement for
sealing: type of crack, percentage of surface covered by cracks, and crack width (Decker 2014).
Cracks that are found to be appropriate for sealing can typically be classified as longitudinal,
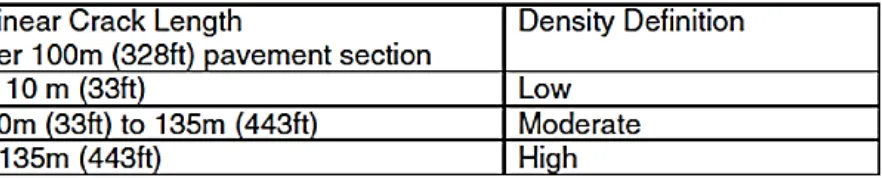
transverse, or block. Sealing is generally not recommended for pavements that exceed low to
moderate cracking densities (Decker 2014). Low to moderate cracking densities are more clearly
defined below by Table 2.1. Another example of rejection for sealing include roadways where
alligator cracking exceeds 25 percent of the pavement surface being covered in cracks (Decker
2014). Currently, no agencies specify project selection specifically to mitigate safety hazards
7 Table 2.1 Crack Density Classifications (Decker 2014).
2.5. COMPARISON OF THE SKID RESISTANCE OF DIFFERENT PREVENTIVE
MAINTENANCE TREATMENTS
The underlying hypothesis of this study is that crack sealant application can lead to a reduction in
pavement surface friction. A research team at The State University of New Jersey examined the
skid resistance of four different types of preservation treatments: thin overlay, slurry seal, crack
seal, and chip seal (Wang 2013). Cracking sealed sections had the lowest friction of all treatment
types except for thin overlays. The authors rated the performance of the pavements on a scale of
one to five with one exhibiting the worst. Ranking performance of pavement preservation
techniques in four different climates and averaging the different types of sections, crack sealed
sections were found to be the least effective treatment option (Wang 2013).
8
2.6. CRACK SEALANT QUALITY CONTROL
The primary issues associated with over application of crack sealant include poor finish,
incorrect usage of finishing tools, sealant applied at lower temperature, breakdown of sealant due
to excess heating, and hot environments (Caltrans 2003). Many of these issues can be reduced
with proper quality control during the installation process. Examples of quality control measures
are inspection of the crack, sealant sampling and testing, properly calibrating equipment, and
inspecting the equipment (Decker 2014). Inspection of the equipment is an important step in
quality control and should be performed according to the manufacturer’s recommendation
(Decker 2014). However, the most important aspect of quality control is inspecting the
application of sealant. Checking cracks to ensure that they are properly cleaned/prepared for
application helps ensure that sealant with adhere to the pavement and do its job effectively
(Decker 2014).
2.7. NCDOT SPECIFICATIONS FOR CRACK SEALING
The NCDOT specifications for crack sealing are given in the NCDOT 2012 Standard
Specifications document in Section 657. The specifications dictate that existing longitudinal and
transverse pavement cracks should be sealed with hot applied joint sealer (NCDOT 2012). Edge
cracks do not require sealing according to the NCDOT specification.
The specifications require cleaning of cracks and joints using a hot compressed air lance to
remove any dirt, vegetation, dampness, and loose materials prior to sealing. The hot air lance
must be used immediately prior to sealing the pavement to ensure the crack is dry and warm
(NCDOT 2012). The sealant is heated and applied according to the manufacturer’s
recommendations. A portable melting kettle is used for heating the material and the material
must be constantly agitated in order to maintain a uniform temperature (NCDOT 2012). Material
should be heated between 200°F and 600°F. It is crucial to monitor the temperature of the sealant
because overheating is not allowed according to NCDOT’s specification. The sealant should be
spread after application using a pressure screed shoe to completely fill the crack, leaving a 2 in
overband. The sealant should be immediately squeegeed in order to limit the height of the sealant
and limit the impact on rideability. All sealed cracks should have a minimum of 1/8 inch depth of
9 There are several restrictions that are also accounted for in the NCDOT specification. Excessive
overbanding or wasting of sealant materials is not allowed. However, it is unclear what is
considered excessive and how this is monitored. If the pavement temperature is below 32°F, the
pavement cannot be sealed. After the sealant has been applied and excess sealant is removed,
traffic is not allowed on the roadway until it is approved by the engineer. When it is approved by
the engineer, sand, toilet paper, or another approved material can be placed on the sealant to help
prevent tracking (NCDOT 2012).
2.8. CRACK SEALANT CONTRACTS
Crack sealant contract payment terms often incentivize the over application of the sealant. In
North Carolina, payment for crack sealant project is made on the basis of linear meter of sealant
applied or by pound of sealant applied (NCDOT 2012). Canada pays their contractors by the
linear meter of sealant applied (NGSMI 2003). These types of payments could lead to an
incentive to seal excessively and seal the pavement where cracks are not in actuality forming. In
Colorado, projects are bid by estimating the number of miles that will be sealed and determining
the cost based on the estimated number of gallons of emulsion that will be used (Truschke et al.
2014).
2.9. PAVEMENT CONDITION SURVEY PRACTICES IN NORTH CAROLINA
The goal of this study is to relate pavement skid resistance changes from crack sealant
application to existing roadway conditions so that the NCDOT can develop specifications to
preclude the application of crack sealant to roadways where it will pose a safety hazard.
Therefore, the NCDOT procedures for conducting pavement distress surveys and defining the
condition of the pavement were reviewed. The NCDOT assigns a Pavement Condition Rating
(PCR), ranging from 0 to 100 that determines the overall condition of a roadway. On this scale, a
rating of 0 is corresponds to a highly damaged road and 100 corresponds to a road in perfect
condition. Roadways in a severely deteriorated condition indicate that the operating speed of the
road cannot be maintained safely (NCDOT 2016).
As of 2012, NCDOT conduct automated distress surveys on primary roadways and windshield
surveys on secondary roadways. In manual, windshield surveys, NCDOT Pavement Condition
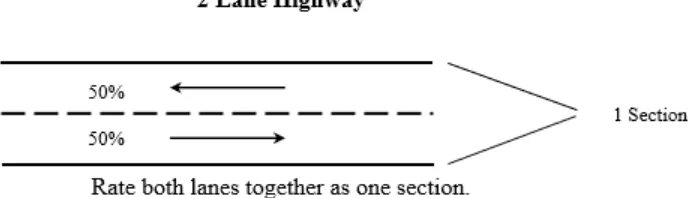
10 into sections depends on the type of roadway being analyzed. Most routes examined in this study
would fall under the description of a secondary, two lane highway, as shown in Figure 2.2. The
evaluation of these roadways by NCDOT typically only had one section per route examined,
while a few longer routes did have multiple sections.
Figure 2.2 Section showing what is considered one section of pavement on 2-lane highway (NCDOT 2012).
The NCDOT pavement distress surveys quantify the extent and severity of many distresses along
a section. A section is defined as a route that is of similar condition/pavement material and is less
than two miles in length (NCDOT 2016). The distresses that are anticipated to impact the effect
of crack sealant on pavement skid resistance include: alligator cracking, transverse cracking, and
oxidation. Alligator cracking and transverse cracking affect the extent of sealant that will be
required to seal cracks in the roadway whereas raveling and oxidation have significant impacts
on the existing roadway frictional characteristics. In cases of severe alligator cracking, it is likely
that crack sealant will be overapplied to fill all cracks, posing a potential loss in skid resistance.
Furthermore, alligator cracks exist in the wheel path where skid resistance is most critical.
Oxidation often impacts the surface characteristics, including raveling. Raveling is anticipated to
impact skid resistance; however, the NCDOT only quantifies raveling on slurry seals and chip
seals.
The NCDOT Pavement Condition Survey Manual (PCS) assigns rankings for alligator cracking
are Light, Moderate, and Severe (NCDOT 2016). Light cracking is classified as longitudinal
11 Moderate cracking is when longitudinal cracks in the wheel path connect together and form
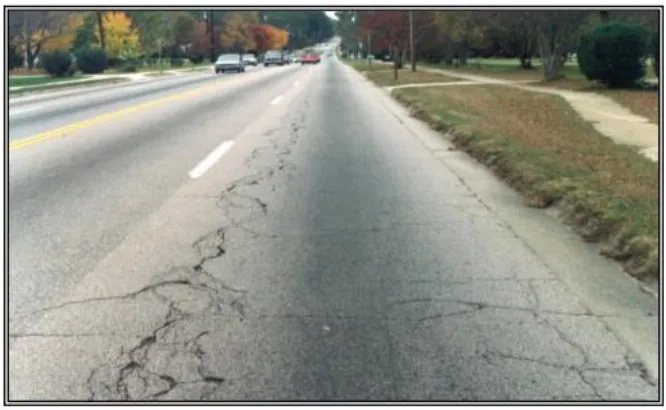
cracks that are about 1/4 inch wide. Severe cracking, shown below by Figure 2.3, is when the
cracks have advanced to the point where pieces of pavement appear to be loose and the cracks
are about 3/8 to 1/2 inch wide (NCDOT 2016). In NCDOT PCS Manual, the alligator cracking
also includes longitudinal and edge cracking.
Figure 2.3 Example of severe alligator cracking (NCDOT 2012).
The alligator cracking index is calculated and reported by the NCDOT by using the percentage
of area of roadway covered by none, low, medium, and high severities of alligator cracking. An
analysis of the NCDOT distress survey data that compared the reported alligator cracking index
to the reported values for low, medium, and high severity cracking indicates that it is calculated
using Equation 2-1.
(
)
100 0.5 % % 4 %
Index
AC = − LOW+ MED+ HI (2-1)
Where %LOW refers to the percentage of the total area of the lane that is low severity. %MED is
the percent of the total area that is medium severity. %HI is the percent of the total area that is
high severity. In addition, %NONE refers to the percentage of the total area that exhibits no
alligator cracking. The summation of %NONE, %LOW, %MED, and %HI must equal 100
12 The oxidation rating is an indication if there is oxidation on the route being inspected. Oxidation
occurs when a pavement hardens from oxidative aging caused by exposed to certain
environmental factors. The NCDOT has two ratings for oxidation; none and severe (NCDOT
2016). Oxidation is determined by visually analyzing the entire surface and determining if the
pavement is showing significant signs of discoloration. The oxidation index is reported with a
value of 100, indicating no signs of oxidation, or a value of 0, indicated severe oxidation. An
example of an oxidation index of 0 is given in Figure 2.4.
Figure 2.4 Example of severe oxidation (NCDOT 2012).
The transverse cracking index refers to the amount of cracking that occurs perpendicular to a
roadway. These cracks are typically greater than 1/2 inch wide and typically cross both lanes of
traffic (NCDOT 2016). Transverse cracking can be caused by thermal stresses and reflective
cracking. Reflective cracking occurs when a crack reflects to the surface of the new asphalt layer
from the underlying pavement. A transverse cracking index is determined by the width of the
crack and the frequency of the cracks; however, the specific formula used to calculate the index
is not reported. If cracks are less than 1/4 inch wide and occur less frequently than every 10 to 20
13 width between 1/4 to 1/2 inch that are spaced 5 to 20 feet apart (NCDOT 2016). Severe
transverse cracks have a width greater than 1/2 inch and occur 1 to 2 feet apart (NCDOT 2016).
Figure 2.5 Example of transverse cracking (NCDOT 2012).
2.10. PAVEMENT SKID RESISTANCE MEASUREMENTS
Two common techniques used in practice to measure pavement skid resistance include: the
Locked-Wheel Skid Tester (LWST) and the Continuous Friction Tester (CFT). Additional
techniques exist but are not under consideration by the NCDOT at this time and thus, are omitted
from this review. McCarthy et al. (2018) examined the main differences between the different
types of friction testers available for DOTs. The two that are most related to the current crack
sealant project are the Grip Tester, (a type of CFT) and the LWST (standard smooth tire) due to
how NCDOT measures friction values.
The LWST (ASTM E274) measures the pavement friction at a set interval by periodically
locking a tire attached to a trailer, as shown in Figure 2.6. This wheel is locked when the vehicle
reaches a consistent speed of 40 mph. Both smooth and ribbed tires are available. The smooth
tire is sensitive to changes in mean profile depth (MPD) of the pavement which makes it
preferable to the ribbed tire version of the LWST. The primary benefit of using a LWST is that it
14 Skid Number (SN) and calculated by the formula shown below in Equation
(2-2).
Figure 2.6 Locked Wheel Skid Tester (McCarthy et al. 2018).
(
)
SN= F W ×100 (2-2)
where SN = Skid Number, F = Tractive Force (i.e., the horizontal force applied to the test tire at
the tire-pavement contact patch), lbf (or N), and W = dynamic vertical load on test wheel, lbf (or
N). The method of measurement is the same for the LWST with a ribbed tire; however, it is less
sensitive to the changes of MPD in a pavement’s surface.
The CFT method is a popular method of measuring friction on runways and airfields. The CFT is
typically measured using a grip tester. Fundamentally, it works the same way as the LWST by
locking up a wheel but the increments at which it locks up are occurring at such short intervals so
it is considered as continuous. A grip tester, shown below in Figure 2.7, measures a value that is
reported as a GN (Grip Number), which is a measure on the longitudinal force required to slow
the middle tire of the grip tester. For most grip testing, the tires used are smooth instead of
ribbed, which makes them more reliable for measuring the effect of MPD on a pavement’s skid
resistance. A GN value is the metric used to measure the friction of the pavement surface and is
determined by calculating the amount of friction necessary to bring a wheel to 15 percent of the
speed of the trailer. By not fully locking the wheel up, the test is able to record values at short
15 Figure 2.7 Grip Tester (McCarthy et al. 2018).
The main differences between the LWST and a CFT are test interval length, speed at which
friction value is recorded, sensitivity to MPD, how friction value is calculated, and the location
where the wheel records the friction value. The LWST has a test tire that records values that are
in the actual wheel path of the vehicle while the grip tester records values in the center or the
travel lane. The GN value is also measured without fully locking up the test tire while the LWST
locks the tire entirely. McCarthy et al. (2018) correlated LWST and CFT results (both with
smooth tires) and found only a weak relationship with R2 of 0.44 as shown in Figure 2.8. Due to
the significant differences in equipment, measurement, and lack of overall correlation it is
unlikely that continuous friction tester data can be combined to that found with the LWST.
16
2.10.1. LOCKED-WHEEL SKID NUMBER THRESHOLDS
SN values are often used as indicators of roadway safety. Based on a nationwide survey of
LWST use performed by Jayawickrama et al. (1996), it was determined an SN of 30 is the
minimum acceptable value for low-volume roads and that a minimum SN of 35 is required for
high-volume roads. Pavements that have skid values of between 31 and 34 are typically
monitored closely by state agencies so that preventive maintenance can be performed and
increase the SN value to maintain safe conditions (Jayawickrama et al. 1996).
If a roadway has an SN value that falls below 30, many DOTs would then consider corrective
action due to likelihood of a skid-related accident occurring. The widespread use of these
thresholds has to do with their values relating directly to the ASTM E274 LWST, which is used
widely across the United States. Some states such as Maryland, Minnesota, and Pennsylvania
have higher thresholds such as 40 as a cutoff for determining unsafe conditions (Jayawickrama et
al. 1996). However, for the purposes of this study, NCDOT values for safety thresholds were
used, which are consistent with thresholds established by Jayawickrama et al. (1996).
2.11. SUMMARY OF KNOWLEDGE GAPS
Key findings in this literature review established the tools, pavement thresholds, methods,
calculations, and selection of projects for this study. The literature presented demonstrates that
the selection of projects for crack sealing does not consider the impact that the crack sealant will
have on skid resistance. Many factors that can affect crack sealant application were presented
(e.g., existing pavement condition, configuration, sealant type, etc.). Therefore, the present study
is critical to inform future specification development to prevent the over application of crack
sealant in cases where it could pose a safety hazard. The existing pavement condition and type of
crack sealant configuration potentially play a significant role in whether pavements are being
17
3. METHODOLOGY AND EXPERIMENTAL PLAN
3.1. TEST SECTIONS
Six pavement sections in North Carolina were analyzed in this study. Each section exhibited
significant variability in the coverage by crack sealant along its length; this allowed for
evaluating the relationship between the percentage of the pavement covered by crack sealant and
pavement skid resistance over sections with consistent existing pavement surface characteristics.
A summary of the six test sections is given in Table 3.1. Location C includes two subsections,
C1 and C2 because the route included two segments for which pavement distress condition
survey data was obtained and recorded. For the other locations, a single record of pavement
distress condition survey data was available for the entire route length. The pavement condition
rating, alligator cracking index, transverse cracking index, and oxidation rating values reported
in Table 3.1 correspond to the pavement condition before sealing. It should be noted that all of
the sections evaluated were secondary roadways and thus, manual windshield surveys were used
to obtain these measurements. All test sections were cracked sealed but many exhibited evidence
of relatively extensive cracking. While the extent of alligator cracking is shown to vary among
the locations, it can be seen that the transverse cracking index of all sections except one were 80.
It should also be noted that both longitudinal and alligator cracks are grouped together under
alligator cracking within North Carolina Department of Transportation (NCDOT) distress
surveys (NCDOT 2016). In addition, except for Location C, the test locations did not exhibit
visual evidence of oxidation; an oxidation rating of zero indicates that oxidation was not
observed and a rating of 100 indicates a severely oxidized pavement. The crack sealant
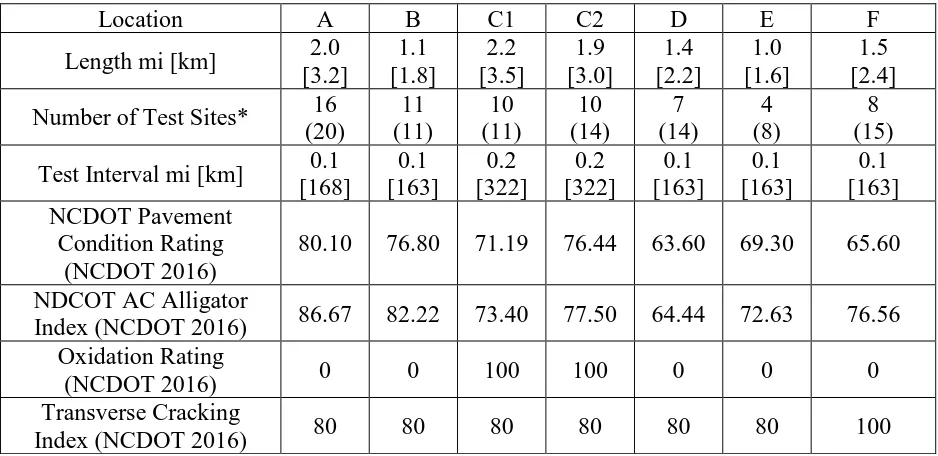
18 Table 3.1 Summary of Test Sections
Location A B C1 C2 D E F
Length mi [km] 2.0 [3.2] 1.1 [1.8] 2.2 [3.5] 1.9 [3.0] 1.4 [2.2] 1.0 [1.6] 1.5 [2.4]
Number of Test Sites* 16 (20) 11 (11) 10 (11) 10 (14) 7 (14) 4 (8) 8 (15)
Test Interval mi [km] 0.1 [168] 0.1 [163] 0.2 [322] 0.2 [322] 0.1 [163] 0.1 [163] 0.1 [163] NCDOT Pavement Condition Rating (NCDOT 2016)
80.10 76.80 71.19 76.44 63.60 69.30 65.60
NDCOT AC Alligator
Index (NCDOT 2016) 86.67 82.22 73.40 77.50 64.44 72.63 76.56 Oxidation Rating
(NCDOT 2016) 0 0 100 100 0 0 0
Transverse Cracking
Index (NCDOT 2016) 80 80 80 80 80 80 100
*First number corresponds to the number of test site results deemed acceptable, number in parentheses corresponds to the total number of test sites.
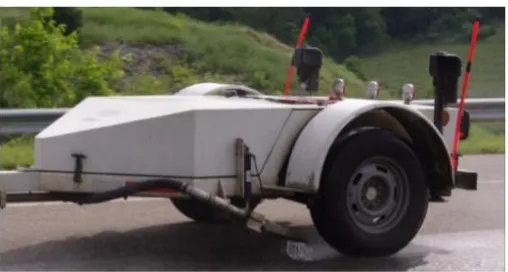
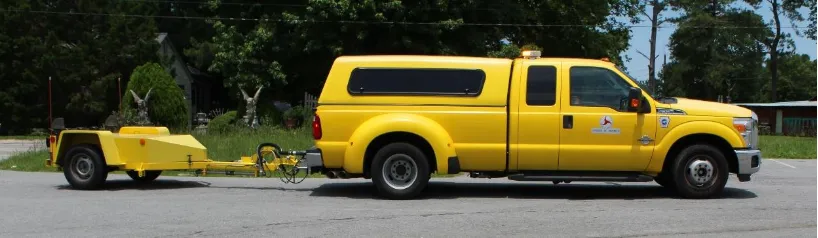
3.2. LOCKED-WHEEL SKID TESTING
The LWST was used to measure the skid resistance of pavements with varying amounts of crack
in the wheel path in accordance with ASTM E274 (2011). The LWST used consists of a trailer
with a test wheel, water supply and dispensing system, and instrumentation system to measure
frictional force. The trailer is towed by a vehicle traveling at 40 mph (64 km/h). Once up to
speed the LWST sprays water 12 to 18 in in front of the test tire as well as 1 in to the left and
right of the tire to ensure a wetted surface for the tire. The trailer’s test wheel is positioned in the
left wheel path and is locked and dragged over wetted sections of pavement in order to measure
the steady-state friction. The LWST used in this study is a smooth, single tire and is shown in
19 Figure 3.1 Locked-Wheel Skid Tester.
The LWST was used to determine the skid number (SN) at each site of testing. The SN number
is recorded as the average value for the duration of each skid test and is calculated by using
Equation (2-2). LWST tests were conducted at constant intervals with different intervals
depending on the overall length of the section. Longer sections included measurements every 0.2
miles (322 m) while shorter sections took measurements around 550 feet (168 m). SN values
were removed from the data set if the speed was not 40 mph (64 km/h) or if the photo showed
significant amount of wandering from the wheel path.
3.3. IMAGE ACQUISITION AND PROCESSING
A vehicle with a camera mounted to its hood closely followed the LWST to obtain images of the
pavement sections over which SN values were measured to allow for comparing skid resistance
to crack sealant coverage. The camera mounted to the vehicle is shown in Figure 3.2. The
location of each LWST test was easily identified by the watermark left on the pavement. Two
photographs were taken for each skid mark. The camera contained a Global Positioning System
(GPS) unit, which allowed for reconciling the images with the corresponding LWST result. A
handheld GPS unit was also used to record the location of each photograph in case of failure of
20 Figure 3.2 Camera with GPS unit attached mounted to hood of car.
The locations of LWST test results and photographs were used to create a database of images
with the corresponding SN value before processing for analysis. The images were then reviewed
and filtered. If an image was blurry or contained significant shadows that significantly reduced
contrast between crack sealant and the surrounding pavement, the image and corresponding SN
value were removed from the database. The number of test sites removed due to blurry images
and/or improper LWST speed is shown in Table 3.1.
An algorithm was developed to calculate the percentage of the lane and wheel path within each
section of LWST testing covered by crack sealant using both Adobe Photoshop® and
MATLAB®. The image processing algorithm first conducts a perspective warp to convert the
image to a top-down view using Photoshop®. Then, the image is cropped to include only the lane
of interest over the length where LWST testing was conducted. Auto-contrast, brightening tools,
and a color balancing tool in Photoshop® are applied to improve the contrast between the crack
sealant and the surrounding pavement. For isolated analysis of the wheel path location where the
LWST test was conducted, the image is further cropped to a fixed width of 140 pixels centered
around the water mark, which corresponded to approximately three wheel widths, capturing the
expected range of traffic wander within the wheel path (Luo et al. 2011).
Each cropped lane width and wheel path image is then imported into MATLAB®. In
MATLAB®, each image is converted from color to greyscale and subsequently converted to a
21 MATLAB® that sorts through an image and converts a color image to a binary one. The way that
this process works in MATLAB® is by examining a smaller selection of the image and
determining what is the foreground and background via differences in overall contrast (Puneet
2013). For the purposes of this research the background (roadway) was determined to be lighter
than the crack sealant and as a result the adaptive thresholding.
An example of (a) an original photograph, (b) perspective-corrected, and (c) wheel path only and
(d) final binary wheel path image is shown in Figure 3.3. The algorithm was verified using a
subset of images by overlaying final binary images with the initial perspective-corrected color
image to ensure that the crack sealant was properly identified and delineated from the
surrounding pavement.
22 4. RESULTS
4.1. BASELINE SKID NUMBERS
For each testing location, a baseline SN value was established based on the LWST results of a
portion of the roadway without crack sealant. Note that the baseline pavement frictional
characteristics were not found to vary appreciably along the length of a given testing location.
The baseline SN results are shown in Table 4.1. The baseline SN values for Locations A, B, D, E
and F were similar and indicate that the existing pavements had good skid resistance prior to the
application of crack sealing. Locations C1 and C2 has a significantly lower baseline SN value,
close to the widely accepted SN threshold for high volume roads of 35 (Jayawickrama et al.
1996).
The baseline SN value was identified by selecting sections that had no sealant applied and an
average of those skid numbers was calculated. In cases where there was only a single section
with no sealant, only a single value could be used to establish a baseline. In other cases a
representative value was used by looking at all results and calculating an average. A plot
between baseline SN and PCR was determined to have no relationship. It is expected that a
pavement that has a lower mean profile depth would likely have a lower baseline value due to
having a smoother surface. Mean profile depth can be influenced by the size of aggregate
material used in making the pavement as well as the volumetric properties of the asphalt.
Pavement distresses that could have an influence on baseline skid number could be raveling and
polishing. However, these distresses were not reported for these sections. Other distresses have
23 Table 4.1 Baseline Skid Numbers
Location Measured Baseline SN Values
A 49.0
B 48.6
C1 37.1
C2 37.6
D 44.9
E 43.0
F 47.1
4.2. RELATIONSHIP BETWEEN SN VALUE AND PERCENTAGE OF PAVEMENT SURFACE
AREA COVERED BY CRACK SEALANT
Once the crack sealant images had been processed and filtered, the relationship between the SN
value and percentage of the pavement surface area covered by crack sealant was investigated.
Figure 4.1 shows the relationship between SN values and the percentage of the total lane covered
by crack sealant for each location of testing. While Location B exhibits a linear relationship
between the percentage of the lane covered by crack sealant and SN, the other sections do not
exhibit a clear trend. There is a significant amount of spread in the measured SN values for each
testing location, with many of the reported SN values falling below generally accepted threshold
values of 30 for low volume roads and 35 for high volume roads (Luo et al. 2011). Similarly,
there is a wide range in the percentage of the lane covered by crack sealant along the length of
each testing location; the percentages of the pavement lane covered by crack sealant exceed 40
percent in some test sites, indicating highly excessive crack sealant application. Interestingly,
Location C exhibits the highest percentage of the pavement covered by crack sealant but did not
have the worst alligator index or NCDOT rating index (see Table 3.1), which can be explained
by visual observations that crack sealant was applied with a wide overband and to locations
where cracks were not present within Location C. The results indicate that the amount of crack
sealant covering the lane width and SN are not correlated; this is not surprising because the
LWST measures skid resistance in the left wheel path only. Therefore, the relationship between
24 investigated. It should be noted that skid resistance in the wheel path is most critical because it is
where the majority of the traveling public’s wheels will pass.
Figure 4.1 Relationship between LWST skid numbers and the percentage of the pavement lane covered by crack sealant for test sections in (a) Location A, (b) Location B, and (c) Location C
(d) Location D, (e) Location E. 15 20 25 30 35 40 45 50 55
0% 10% 20% 30% 40% 50%
S k id Nu m b e r
Percentage of Lane Covered by Crack Sealant
(d) 15 20 25 30 35 40 45 50 55
0% 10% 20% 30% 40% 50%
S k id Nu m b e r
Percentage of Lane Covered by Crack Sealant
(a) 15 20 25 30 35 40 45 50 55
0% 10% 20% 30% 40% 50%
S k id Nu m b e r
Percentage of Lane Covered by Crack Sealant
(b) 15 20 25 30 35 40 45 50 55
0% 10% 20% 30% 40% 50%
S k id N u m b e r (S N )
Percentage of Lane Covered by Crack Sealant
(c) 15 20 25 30 35 40 45 50 55
0% 10% 20% 30% 40% 50%
S k id Nu m b e r
Percentage of Lane Covered by Crack Sealant
(f) 15 20 25 30 35 40 45 50 55
0% 10% 20% 30% 40% 50%
S k id Nu m b e r
Percentage of Lane Covered by Crack Sealant
25
4.3. RELATIONSHIP BETWEEN SN VALUE AND PERCENTAGE OF WHEEL PATH
COVERED BY CRACK SEALANT
Figure 4.2 shows the relationship between SN values and the percentage of the wheel path area
where LWST testing was conducted covered by crack sealant. For each location, a linear trend
line was regressed to the data and the corresponding coefficients of determination (R2) and
standard error (SE) values for each location are reported in Figure 4.2. While there is some
scatter in the results, the moderately high R2 values and low standard error values indicate that
SN value is correlated to the percentage of the wheel path area covered by crack sealant. The
trends in Figure 4.2 demonstrate that SN values generally decrease as the percentage of the
wheel path covered by crack sealant increases for each testing location. These results support the
hypothesis that the application of excessive crack sealant can pose a safety hazard. The primary
distresses that generally occur in the wheel path are longitudinal cracking and alligator cracking,
which makes it is more likely that sealant will be applied in the wheel path. In addition to posing
skid loss, pavements with alligator and longitudinal cracking area generally poor candidates for
crack sealing because these distresses indicate an underlying structural problem in the pavement.
26 Figure 4.2 Relationship between LWST skid numbers and the percentage of the wheel path covered by crack sealant for test sections in (a) Location A, (b) Location B, (c) Location C, (d)
Location D, (e) Location E and (f) Location F.
Once it was established that the amount of crack sealant in the wheel path affects skid resistance,
efforts were made to unify the results of the different testing locations. Figure 4.3 shows the
relationship between SN and the percentage of the wheel path covered by crack sealant for all
testing locations. The results demonstrate that the baseline skid resistance of the pavement
affects the relationship between SN and the percentage of the wheel path covered by crack R² = 0.60
15 20 25 30 35 40 45 50 55
0% 10% 20% 30% 40% 50% 60% 70%
S k id Nu m b e r
Percentage of Wheel Path Covered by Crack Sealant
(d)
SE = 3.47
R² = 0.64
15 20 25 30 35 40 45 50 55
0% 10% 20% 30% 40% 50% 60% 70%
S k id Nu m b e r
Percentage of Wheel Path Covered by Crack Sealant
SE = 3.26
(e)
R² = 0.70
15 20 25 30 35 40 45 50 55
0% 10% 20% 30% 40% 50% 60% 70%
S k id Nu m b e r
Percentage of Wheel Path Covered by Crack Sealant
SE = 2.93
(a)
R² = 0.84
15 20 25 30 35 40 45 50 55
0% 10% 20% 30% 40% 50% 60% 70%
S k id Nu m b e r
Percentage of Wheel Path Covered by Crack Sealant
SE = 2.66
(b)
R² = 0.71
15 20 25 30 35 40 45 50 55
0% 10% 20% 30% 40% 50% 60% 70%
S k id Nu m b e r
Percentage of Wheel Path Covered by Crack Sealant
SE = 3.17
(c)
R² = 0.67
15 20 25 30 35 40 45 50 55
0% 10% 20% 30% 40% 50% 60% 70%
S k id Nu m b e r
Percentage of Wheel Path Covered by Crack Sealant
SE = 3.02
27 sealant. Locations A, B, D, E, and F all have good baseline conditions (see Table 4.1) and the
results of both data sets follow a similar trend in Figure 4.3. Both sections C1 and C2 had a
significantly lower baseline SN value, and it can be seen that the Location C results generally fall
below Locations A, B, D, E, and F in Figure 4.3.
No discernable trend in the relationship between the SN value and the percentage of the wheel
path covered in crack sealant for baseline skid values ranging from 43 to 49. As seen above in
Figure 4.2, each location displays a different slope of SN vs. percentage of wheel path covered in
crack sealant. Location C exhibits a significantly lower slope than the other sections. This is
attributed to its significantly lower baseline skid value. For the other sections, there is no clear
trend in slope with baseline skid values.
Figure 4.3 Relationship between LWST skid numbers and the percentage of the wheel path covered by crack sealant for all test sections.
In a further effort to unify the results of the different testing locations, the difference between the
baseline SN and the SN value measured at each test site with crack sealant present was
investigated, referred to as the change in SN herein. Figure 4.4 shows the relationship between
15 20 25 30 35 40 45 50 55
0% 10% 20% 30% 40% 50% 60% 70%
S
kid
N
u
m
b
er
Percentage of Wheel Path Covered by Crack Sealant
Location A
Location B
Location C1
Location C2
Location D
Location E
28 the change in SN and the percentage of the wheel path covered by crack sealant for each testing
location. While there is significant scatter in the results, all locations exhibit an overall positive
trend, indicating that higher amounts of crack sealant application in the wheel path generally
correspond to greater loss in skid resistance. The slope of the relationship between the change in
SN and the percentage of the wheel path covered by crack sealant is significantly lower for
Location C than the other testing locations, indicating the change in SN due to crack sealant
application is also affected by the baseline pavement skid resistance. In addition, the slopes of
the individual plots for Locations A, B, D, and E differ somewhat. However, when the results are
combined, as shown in Figure 4.5, it can be seen that the results of the different sections are
generally in agreement. Due to the differing slopes but overall similar trend, the categorical
approach was used, which grouped pavements into good condition (43<) and poor condition
(<38). Analysis of additional sections with a baseline value ranging from 38-43 could help
29 Figure 4.4 Relationship between the change in skid numbers from the baseline and the percentage of the wheel path covered by crack sealant for test sections in (a) Location A, (b)
Location B, and (c) Location C (d) Location D (e) Location E (f) Location F. y = 59.17x
R² = 0.62
0 2 4 6 8 10 12 14 16 18 20
0% 10% 20% 30% 40% 50% 60% 70%
Ch a n g e in S N fr o m B a s e li n e
Percentage of Wheel Path covered in Crack Sealant
(e)
y = 50.77x R² = 0.27
0 2 4 6 8 10 12 14 16 18 20
0% 10% 20% 30% 40% 50% 60% 70%
Ch a n g e in S N fr o m B a s e li n e
Percentage of Wheel Path covered in Crack Sealant
(d) y = 67.06x
R² = 0.67
0 2 4 6 8 10 12 14 16 18 20
0% 10% 20% 30% 40% 50% 60% 70%
Ch a n g e in S N fr o m B a s e li n e
Percentage of Wheel Path covered in Crack Sealant
(a)
y = 86.66x R² = 0.83
0 2 4 6 8 10 12 14 16 18 20
0% 10% 20% 30% 40% 50% 60% 70%
Ch a n g e in S N fr o m B a s e li n e
Percentage of Wheel Path covered in Crack Sealant
(b)
y = 28.48x R² = 0.60
0 2 4 6 8 10 12 14 16 18 20
0% 10% 20% 30% 40% 50% 60% 70%
Ch a n g e in S N fr o m B a s e li n e
Percentage of Wheel Path Covered in Crack Sealant
(c)
y = 51.31x R² = 0.71
0 2 4 6 8 10 12 14 16 18 20
0% 10% 20% 30% 40% 50% 60% 70%
Ch a n g e in S N fr o m B a s e li n e
Percentage of Wheel Path covered in Crack Sealant
30 Figure 4.5 Combined relationship between change in skid numbers from the baseline and the
percentage of the wheel path covered by crack sealant for test sections A, B, D, E, and F.
The combined results of the change in SN versus the percentage of wheel path covered by crack
sealing for all locations are shown in Figure 4.6. The results of Location C fall towards the lower
bound of the scatter of the results for the other test sections for relatively low crack sealant wheel
path coverages and deviate from the trends of the other sections at relatively high percentages of
crack sealant coverage in the wheel path. However, the data corresponding to Location C extend
to higher crack sealant coverages than the other sections so definitive trends are difficult to
ascertain.
y = 59.48x R² = 0.63
0 2 4 6 8 10 12 14 16 18 20
0% 10% 20% 30% 40% 50% 60% 70%
Ch
a
n
g
e
in
S
N
fr
o
m
B
a
s
e
li
n
e
31 Figure 4.6 Relationship between the change in skid numbers from the baseline and the
percentage of the wheel path covered by crack sealant for all test sections.
4.4. ESTABLISHMENT OF PAVEMENT CONDITIONS WHERE CRACK SEALING MAY
POSE SAFETY HAZARD
The sensitivity of the relationship between SN and the percentage of the wheel path covered by
crack sealant to the existing pavement SN suggests that the pavement conditions for which
sealing will pose a safety hazard depend on the existing pavement skid resistance. Roadways
with relatively high amounts of cracking and good baseline skid resistance may be crack sealed
without risking a skid resistance safety hazard compared to roadways with poor baseline skid
resistance. Therefore, maximum percentages of the wheel path that can be covered by crack
sealant without posing safety hazards were defined as a function of the existing pavement SN
value. The established limits were then related to the pavement distress survey results to define
pavement conditions where sealing should be avoided. It should be noted that the effect of crack
sealant configuration could impact the established limits based on pavement distress survey
results; however, the effect of crack sealant configuration on skid resistance could not be
evaluated in this study because all test sections evaluated included the overband configuration.
0 2 4 6 8 10 12 14 16 18 20
0 10 20 30 40 50 60 70
C
h
an
g
e
in
S
N
Percentage of Wheel Path Covered by Crack Sealant (%)
Location A
Location B
Location C1
Location C2
Location D
Location E
32 The overband configuration leads to greatest surface coverage and thus, the established
thresholds can be regarded as conservative for other configuration types.
4.4.1. ALLOWABLE PERCENTAGE OF CRACK SEALANT IN WHEEL PATH
To establish guidance on the allowable percentages of crack sealant application in the wheel
path, the results of Locations A, B, D, E, and F were analyzed together given their good baseline
SN values (i.e., 43 and above), while Locations C1 and C2 were analyzed separately due to their
relatively poor baseline SN values (i.e., 37). Linear regression of the relationship between SN
value and the percentage of the wheel path covered by crack sealant was conducted. Based on
the regression results, the 90 percent confidence intervals were established using the upper and
lower bounds defined by Equation (4-1).
^
crit
Bound = y SE t (4-1)
Where
^
y is the SN value predicted by the regression line, SE is the standard error of the
regression line, and tcrit is the critical value on the t distribution for the desired confidence level.
To define the confidence interval bounds, the α value used to determine tcrit was 0.05, meaning
that there is a 5 percent probability of a value falling below the lower bound and 5 percent
probability of a value falling 5 percent above the upper bound. Given the sample sizes, the tcrit
value for Location C is 2.093 and the tcrit value for the combined results of Locations A, B, D, E,
33
Figure 4.7 Relationship between LWST skid number and the percentage of the wheel path covered by crack sealant with 95 percent confidence intervals (dotted lines) for (a) Locations A,
B, D, E, and F, and (b) Location C.
y = -21.65x + 34.81 R² = 0.71
15 20 25 30 35 40 45 50 55
0% 10% 20% 30% 40% 50% 60% 70%
S k id Nu m b e r
Percentage of Wheel Path covered in Crack Sealant
(b)
SE = 2.85 y = -50.72x + 46.19
R² = 0.73
15 20 25 30 35 40 45 50 55
0% 10% 20% 30% 40% 50% 60% 70%
S k id Nu m b e r
Percentage of Wheel Path covered in Crack Sealant
34 The linear regression model and confidence intervals were used to establish limits for the
percentage of the wheel path that can be covered by crack sealant without dropping below SN
thresholds of 30 and 35. A SN threshold of 30 is often applied to low-volume roadways whereas
a SN threshold of 35 is often applied to high-volume roadways (Jayawickrama et al. 1996).
When establishing these limits, two reliabilities were considered: 50 percent and 95 percent. To
establish these thresholds, a similar approach to the reliability concept implemented in Pavement
ME was used (ARA Inc. 2003). The 50 percent reliability threshold corresponds to the Figure 4.7
regression model predictions. The 95 percent reliability threshold corresponds to the lower
confidence interval bounds in Figure 4.7; that is, there is 95 percent confidence that the
established limit for crack sealant coverage will not lead to an SN value lower than the critical
safety threshold.
Table 4.2 shows the established limits for acceptable crack sealant application in the wheel path.
It can be seen that the allowable amount of crack sealant in the wheel path is significantly higher
for (a) the good baseline condition (minimum SN value of 43) than the (b) poor baseline
condition (SN value of 37). These results indicate that the existing condition of the roadway
plays a significant role in establishing whether crack sealant can be applied without reaching an
unsafe condition. The relatively high limits for allowable amounts of crack sealant in the wheel
path for Locations A, B, D, E, and F suggest that many pavements are good candidates for crack
sealing without posing a safety hazard. Figure 4.8 provides examples of pavement sections
exhibiting 17 percent and 27 percent crack sealant coverage in the wheel path to provide some
context to these thresholds given in
Table 4.2.
The results of Locations C1 and C2 imply that crack sealing may be an inappropriate preventive
maintenance strategy for pavements with deteriorated baseline SN approaching safety limits (i.e.,
37) because even small amounts of crack sealant in the wheel path can lead to a drop in skid
resistance that could pose a safety hazard to traffic. For high volume roadways where the SN
value should not drop below 35, sealing should be avoided. For low volume roadways, crack
sealing may be possible without leading to conditions dropping below the commonly accepted