ISSN(Online): 2320-9801
ISSN (Print): 2320-9798
I
nternational
J
ournal of
I
nnovative
R
esearch in
C
omputer
and
C
ommunication
E
ngineering
(An ISO 3297: 2007 Certified Organization)
Vol. 3, Issue 8, August 2015
Novel Approach for Salient Region Detection
Improved By Dynamic Region Merging and
Boundary Analysis
A New way to detect salient regionsArchana Patil
1, Rahul Gaikwad
2PG Scholar, Department of Computer Engineering, GF’S GCOE, Jalgaon, Maharashtra, India
Asst. Professor, Department of Computer Engineering, GF’S GCOE, Jalgaon, Maharashtra, India
ABSTRACT: Detection of salient region detection is useful for several image processing applications such as security system for Airport, Medical imaging, Object reorganization, Criminal Investigation, Retrieval of image, filter design and Retargeting an Image. A novel approach to determine salient region of images is proposed in this paper. GMM if used for clustering the colour values in the L*a*b colour space into n classes and colour spatial variance is calculated. Then dynamic region merging segmentation algorithm is utilized to extract the high level information and to achieve full resolution saliency maps. Context- aware technique is used, which makes salient regions more brilliant in the saliency map. The segmented results of image are used to compute the saliency value based on the colour contrast computation and define the saliency for each region as the weighted sum of region contrast to all regions in the image to obtain better precision and recall. The results obtained from the three modules are combined to obtain the final saliency map which is then multiplied by center distance map.
KEYWORDS: Dynamic region Merging, Context- aware, salient region detection, SPRT, RAG, NNG
I. INTRODUCTION
EXTRACTING meaningful objects from an image or image sequences is a crucial problem in many image processing applications like object recognition, image resizing, image retrieval, context-aware image editing. Visual Saliency is a broad term used to refer the meaningful region of an image. Detecting a salient region is the process of referring to the meaningful region of an image. Whether the region is salient or not depends on its uniqueness, unpredictability and is highly related to boundaries, gradient, colour and edges. Salient region detection is used to evaluate whether an object attracts viewers attention or not. There are two stages of visual processing i.e. Bottom up and top down. The bottom up factors highlights the image regions that are different from their surroundings. Any algorithm designed for salient region detection must have the following characteristics:
Highlight complete salient regions uniformly. Emphasize on the detection of large salient regions. Establishing well defined boundaries of salient regions. Produce resolution saliency map efficiently.
Discarding high frequencies arising from texture, noise and blocking artifacts.
ISSN(Online): 2320-9801
ISSN (Print): 2320-9798
I
nternational
J
ournal of
I
nnovative
R
esearch in
C
omputer
and
C
ommunication
E
ngineering
(An ISO 3297: 2007 Certified Organization)
Vol. 3, Issue 8, August 2015
(a) (b)
Figure1:- (a) Original Image (b) Saliency maps.[1]
The saliency maps in the proposed framework presented in this paper are extracted by three features: The colour spatial variance, border measurement, context- aware. The colour spatial variance is used to calculate the degree of colour distribution.
It is observed that when the colour is extensively distributed in an image, it may be the background colour. From the previous observations, it is clear that, the salient objects are less likely connected with the border of an image. The boundary information obtained from each segment is used to determine salient regions. Finally, I will use Context-aware method to achieve full resolution saliency map with well defined boundaries.
II. LITERATURE SURVEY
There are several studies related to salient region detection in the recent years. Ma and Zhang[4] used a fuzzy growth model to generate saliency maps. Harel at al. Combined the saliency maps of Itti et al. with the feature maps to highlight the distinctive regions of an image. Hou and Zhang[6] construct the saliency map by extracting the spectral residual of an image in the spectral domain. This method outputs low resolution saliency maps of size 64×64 pixels for any size input image. Achanta at al.[7] determines the salient region in images using low level luminance and colour features. This method produces the saliency maps of the same size as the input image and better highlights the smaller salient region than the larger one. Recently Goferman et al. [8] consider both local and global features to highlight the salient objects enhanced by means of visual organization. Zahi and Shah[9] defined the pixel level saliency by constructing spatial and temporal attention models. In 2011, Cheng et al.[3] used histogram and region based contrast to compute salient maps with higher precision and recall rates. The disadvantage of this method is that if there are any noisy regions, then this method may not detect right salient regions. Recently, Po-Hung Wu and Chien-Chi[1] proposed a method to calculate the saliency maps based on three features i.e. colour spatial variance, border measurement and PCA-CA method. The disadvantage of most of all existing salient region detection methods is that their computational complexity is very high; also they do not consider noise problems. Noise is independent of the image information such as text, spots and texture. This redundant information provides the high contrast region from local and global perspective which increases the difficulty in detecting the salient objects.
ISSN(Online): 2320-9801
ISSN (Print): 2320-9798
I
nternational
J
ournal of
I
nnovative
R
esearch in
C
omputer
and
C
ommunication
E
ngineering
(An ISO 3297: 2007 Certified Organization)
Vol. 3, Issue 8, August 2015
better precision and recall rates are achieved and computational complexity can be reduced. As compared to other segmentation based saliency detection technology, in this algorithm segment boundaries are used to calculate the saliency values rather than using the entire region, since the context aware method is more effective around edges. Finally the three feature maps obtained from three main components are averaged to obtain full saliency map, which is multiplied by center distance map.
III. PROPOSED FAMEWORK
In the proposed framework, the need L0 smoothing filter used in the existing system is replaced by the concept of dynamic region merging, which is the most dominant process for image segmentation. Also Instead of PCA CA method used for making a salient object more brilliant in the saliency map is replaced by the context aware (CA) method. Following figure shows the architecture of the proposed system:
Figure2 – System architecture of the proposed framework.
The architecture include the three main modules: - The first module consist Gaussian Mixture Model and Colour Spatial Variance; Second module is Dynamic Region Merging and Border Measurement; and third module is Context-Aware and Boundary Scoring.
A. Colour Spatial Variance
GMM based colour spatial method, is one of the most statistically an efficient method for clustering, and is a widely used global feature that matches the human visual system [11]. If a colour is extensively distributed within an image, it may be the background colour. In other word we can say that a specific colour with a small spatial variance will attract greater attention, and it may be the part of salient pixel in the GMM can be represented as :
wcN(I(x,y) | μc,∑c )
P(c | I(x,y)) = --- (1) ∑cwcN(I(x,y) | μc,∑c)
Where wc, μc and ∑c are the weight, mean and covariance of the cth component, N(.) is the Gaussian model and I(x,y) is
the pixel at the co-ordinate(x,y).
In the proposed framework maximum likelihood is used instead of probability models :
c*I(x,y) = arg max c ∈C p(c | I(x,y) ) (2)
ISSN(Online): 2320-9801
ISSN (Print): 2320-9798
I
nternational
J
ournal of
I
nnovative
R
esearch in
C
omputer
and
C
ommunication
E
ngineering
(An ISO 3297: 2007 Certified Organization)
Vol. 3, Issue 8, August 2015
Where, C is the set of all components. The horizontal and vertical spatial positions, vh(c*) and vv(c*), of each colour
component can be further simplified as : 1
Vh(c) = ----
∑
∈ c* | x - μx(c*) | 2 (3)N I(x,y)
1
Vv(c) = ----
∑
∈ c* | y - μy(c*) | 2 (4)N I(x,y)
Where μx and μy are the means of x and y co-ordinates respectively. And N is the number of pixel with a maximum
likelihood of c*. The colour spatial variance of the c*th component can be defined as the maximum of the x and y co-ordinate variances:
V(c*) = max(vh(c*), vv(c*)) (5)
B. Image segmentation by DRM for Border Measurement
In the second module, a dynamic region merging segmentation algorithm is going to utilize to extract the high level information and to achieve the full resolution saliency maps. It is known that the segmentation algorithm is mainly responsible for efficiency of segmentation results, mostly depends on the context of the context of images.
The dynamic region merging segmentation algorithm is based on the similarities among the pixels within a region. In order to cluster the collection of pixels of an image into meaningful groups of regions or objects, the region homogeneity is used as an important segmentation criterion. The homogeneity criteria are essential to the region merging process. The proposed predicate can therefore interpreted as a combination of the consistency measure and the similarity measure. More specifically the extent of consistency tells whether the tested data belongs to the same group. It is measured by the two hypotheses according to the sequential probability test ration (SPRT): null hypothesis, i.e. “the tested data are consistent”, and alternative hypothesis, i.e. “the tested data are inconsistent”.
Overview of the system
Partition the image into regions. This partition depends on predicate Check the consistency of regions
Most consistence regions are merged first and so on. Merging follows the dynamic region merging consistency The process can be accelerated using nearest neighbour graph.
Consistency Check
This property checks if the regions are homogenous. The merging predicate on regions and could be thus “merge and if and only if they are the most similar neighbours in each other’s neighbourhood and follow the principle of consistency. Region information is usually presented by features extracted from the observed data. The choice of features can be gray level, colour, texture and so on. It will consider two hypothesis[7] according to sequentially probability ratio test.
ISSN(Online): 2320-9801
ISSN (Print): 2320-9798
I
nternational
J
ournal of
I
nnovative
R
esearch in
C
omputer
and
C
ommunication
E
ngineering
(An ISO 3297: 2007 Certified Organization)
Vol. 3, Issue 8, August 2015
DRM Algorithm
DRM algorithm started from a set of segmented regions. This is because the small regions can provide more stable statistical information than a single pixel and using the regions for merging can improve a lot of computational efficiency. The algorithm is as follows:
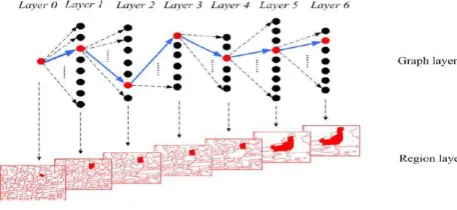
Figure3 - DRM Process
Step 1: For a given over segmented image assign each region as label. Step 2: Consider n regions
Step 3: Assign initial label as L0 and final label as Ln.
Step 4: The label of each region is sequentially transited from initial to final.
Step 5: To finds the optimal sequence of merges which produces optimal merging of all regions we require minimization of objective function.
Step 6: For this original problem is broken into sub problems using dynamic programming. Step 7: For each sub problem calculate minimum edge weight
Step 8: Obtain the merging result by shortest path.
In the DRM algorithm there is at least one pair regions to be merged during each iteration, before stopping criteria is satisfied. Dynamic region merging process as a shortest path in a layered graph (shown in Upper Row) the label transitions of a graph node ( shown in lower Row). The corresponding image regions of each label layer. Starting from layer 0 (shown in red) the highlighted regions obtains a new label from its closest neighbour. If the region is merged with its neighbour, they will be assigned to the same name of label. The shortest path is shown as a group of ( in blue) the directed edges shortest path algorithm is processed by two algorithms: i.e. Region Adjacency Graph , Nearest Neighbour Graph
Region adjacency graph
It is used to represent the segmentation data. Each node represents a region between two nodes if the corresponding regions are adjacent. (1) Form the initial regions in the image using thresholding followed by component labelling. (2) Prepare region adjacency graph (RAG) for the image. (3) For each region in the image perform the following steps: (a) Consider its adjacent region and test to see if they are similar. (b) If regions are similar, merge them. (4) Repeat step 3 until, no regions is merged. DRM perform a scan of a whole graph by which relations between neighbouring are indentified. If the number of regions to be merged will be very high and total computational cost in the proposed DRM algorithm will be very high, so we increase the speed of dynamic region merging algorithm by using nearest neighbour graph.
ISSN(Online): 2320-9801
ISSN (Print): 2320-9798
I
nternational
J
ournal of
I
nnovative
R
esearch in
C
omputer
and
C
ommunication
E
ngineering
(An ISO 3297: 2007 Certified Organization)
Vol. 3, Issue 8, August 2015
Nearest Neighbour Graph
Instead of scanning whole graph only a small portion RAG edges counts for the merging process, this process explains below:
Along any directed edge in NNG, the weights are non-increasing. The maximum length of cycle is two.
The NNG contains at least one cycle.
The maximum number of cycles is half of number of edges.
After merging the regions, boundary information evaluates the region saliency, The boundary weight of region i can be defined as :
length(i)
bw(i) = --- (6) 2 ( h + w)
Where length(i) is the length of the overlapping part of the image border and the boundary of region i, h and w is the height and width of the image. The boundary information is used to decide the threshold value used for region merging and new boundary information about overlapping the image border is used to construct border feature map. The segmented image obtained by dynamic region merging process is then passed to the third module of the system to obtain the saliency maps. These saliency maps are obtained by using Context aware method and boundary scoring technique. To obtain the final saliency map, the three feature maps are multiplied by center distance map.
C. Context – Aware and Boundary Scoring
In the third module the segmented result obtained from the second module is utilized to compute the saliency value based on the local and global contrast computation and define the saliency for each region as a weighted sum of region contrast to all regions in the image. Then the result of three modules is combined to obtain final saliency map. The context aware approach is based on the concept that salient regions are distinctive with their local and global surrounding. Context aware saliency has the following principles
Low –level consideration such as contrast and colour.
Global considerations which suppress frequently occurring features while maintaining the features that deviate from the norm.
Visual organization rule which states that visual forms may processes one or several center of gravity about which the form is organized.
High level factors, such as human faces.
There are several saliency based techniques [7], [14] and their performance highly depend on the segmentation result. In the proposed algorithm the boundary of each segment is going to be used to determine saliency value, rather than the entire segment, since the context-aware method is more effective around the edges. Consequently the utilization of boundary can lower the influences of an incomplete segmentation result. Each region boundary sequence is described as Gi = [ ti(1) , ti(2) ,..., ti(ni) ] where ti(.) is the co-ordinate vector of x and y (Co-ordinates of pixel) and ni is the total
number of the ith region boundaries.. At the last, the feature map based on boundary score will be determined.
IV. CONCLUSION
ISSN(Online): 2320-9801
ISSN (Print): 2320-9798
I
nternational
J
ournal of
I
nnovative
R
esearch in
C
omputer
and
C
ommunication
E
ngineering
(An ISO 3297: 2007 Certified Organization)
Vol. 3, Issue 8, August 2015
REFERENCES
[1] Po-Hung Wu, Chien-Chi Chen, Jian-Jiun Ding, Chi-Yu Hsu and Ying-Wun Huang “Salient region detection improved by principal component analysis” IEEE Transactions On Image Processing, Vol-22 No. 9 September 2013.
[2] L. Itti, C.Koch and E. Niebur, “A Model of saliency-based Visual attention for Rapid Scene Analysis,” IEEE Trans. Pattern Analysis Mach. Intell, Vol. 20, No. 11, pp 1254-1259, Nov 1988.
[3] M. M. Cheng, G. X. Zhang, N. J. Mitra, X. Huang and S. M. Hu, “Global contrast based salient region detection”, in proc. IEEE Conf. Comput. Vis. Pattern Recognition, Jun 2011, PP. 409-416.
[4] Y. F. Ma and H. J.Zhang, “Contrast Based image attention analysis by using fuzzy growing.” In proc. 11th Int. Conf. Multimedia, 2003, pp. 374-381.
[5] J. Harel, C. Koch, and P. Perona, “Graph-Based Visual Saliency,” in advance in neural information Processing system, Vol. 19. New York, NY, USA: Springer-Verlag, 2006, pp. 545-552.
[6] X. Hou and L.Zang, “ Saliency detection: A spectral residual approach.” In Proc. IEEE conf. Comput. Vis. Pattern Recongnition., Jun 2007,pp. 1-8.
[7] R. Achanta, F. Estrada,P. Wils and S. Sijsstrunk, “ Salient Region detection and segmentation,” in computer vision system, Vol 5008, New York, NY, USA:Springer-Verlag,2008, pp 66-75.
[8] S. Goferman, Z. M. Lihi, and A. Tal, “Context-aware saliency detection.” in Proc IEEE Conf. Comput. Vis. Pattern Recognition, Jun 2010, pp 2376-2383.
[9] Y. Zahi and M. Shah, “Visual attention detection in video sequences using spatiotemporal cues,” in Proc. 14th Int. Conference Multimedia, 2006, pp. 815-824.
[10] J. J. Ding, C. J. Kau and W. C. Hong , ”An efficient image segmentation technique by fast scanning and adaptive merging,” in Proc. Conf. Comput. Vis. Graph. Image Processing Aug 2009.
[11] T. Liu, Z. Yuan, J. Sun, J. Wang, N. Zheng, X. Tang and H. Shum, “Learning to detect a salient Object,” IEEE Trans. Pattern Analysis Mach. Intell. Vol. 33, no. 2, pp. 353-367. Feb -2011.
[12] Q. Zhang, H. Liu, J. Shen G. Gu, H. Xiao, “An Improved computational approach for Salient region detection,” Journal of Computers , Vol. 5, No. 7, pp. 1011-1018. July 2010.
[13] Bo Peng, Lei Zhang, Member , IEEE and David Zhang, Fellow, IEEE “Automatic Image Segmentation by Dynamic Region Merging” IEEE Transactions On Image Processing” Vol 20, No. 12, December 2011.