Prepared by Dorsey W. Daniel, J. Paul Mueller and James T. Green Crop Science Extension Specialists
Published by
THE NORTH CAROLINA AGRICULTURAL EXTENSION SERVICE
North Carolina State University at Raleigh, North Carolina Agricultural and Technical State University at Greensboro, and the U. S. Department of Agriculture, Cooperating. State University Station, Raleigh, N. C., T. C. Blalock, Director. Distributed In furtherance of the Acts of Congress of May 8 and June 30, 1914. The North Carolina Agricultural Extension Service offers its programs to all eligible persons regardless of race, color, or national origin, and is an equal opportunity employer.
TABLE OF CONTENTS
Page INTRODUCTION •••••••••••••••••••••••••••••••••.••••••••••••••••••• 1
Name and Addresses of Cooperators and Extension Staff... 2 Map of Tes t Loca tions • • • • • • • • • • • • • • • • • • • • • • • • • • • • • • • • • • • • • • • • 3 Geographical Information on 1980 Test Sites... 4 EXPERIMENTAL PROCEDURE FOR WINTER ANNUALS AND PERENNIALS... 5 WINTER ANNUAL FORAGES... 6
Agencies Sponsoring Entries •••.••••••.••.•••••••••••••••••••• Results and Discussion... 8
Piedmont, Wake County
yields... 9 Crude Protein Percent and yields... 10 Piedmont Long-Term Averages of Yields and Protein... 11 Coastal Plain, Edgecombe County
Yields •••••••••••.••.••••••••••.••••••••••••••••••• Crude Protein Percent and yields ••••.•••.•••••••••• Coastal Plain Long-TerM ~verages of Yields and Protein •• SUMMER ANNUAL FORAGES FOR SILAGE •••••••••..••••...••.••.••.••...• Agencies Sponsoring Entries •••.•••••••••••••••.••••.••••.•••• Results and Discussion ••••••••••••••••••••••••••••••••••••••• Piedmont, Wake COUIlty ••••••••••••••••••••••••••••••••••• Coastal Plain, Edgecombe County ···.··· PERENNIAL FORAGES •••••••••••••••••••••••••••••••••••.••••••••.•••• Agencies Sponsoring Entries •••••••••••••••••••••••••••••.•••• Results and Discussion •••.•••••.••••••••••••••••••••••••••••.
12
13
14
15 16 15
17
18
20
21 23
Yields
Alfalfa - Scotland County... 25
Granville County... 26
Rowan County... 27
Rockingham County... . . . • . . . • . . . 28
Red Clover - Scotland County... 29
Rockingham County. . . • . 30
Ladino Clover - Rockingham County... 31
Orchardgrass - Rockingham County... 32
Tall Fescue - Rockingham County... 33
Bermudagrass, Pennisetum - Rockingham County... 34
Rowan County... 35
LIST OF APPENDIX TABLES (Temperature, Precipitation)... 36
1
INTRODUCTION
EVALUATION OF FORAGE CROP VARIETIES IN NORTH CAROLINA
New forage varieties and hybrids are constantly being released from public and private sources. In addition, forage breeders are continually interested in testing experimentals under a variety of growing conditions. In order to deter-mine adaptability and productivity, it is necessary that these forages be tested under North Carolina growing conditions. The purpose of this publication is to present comparative data on forages tested in North Carolina in 1980.
The varieties tested are classed into three major groups: winter annuals (such as rye, wheat, oats, barley, ryegrass and legumes); summer annuals for silage (such as forage sorghum, sorghum-sudangrass hybrids, pearl millet and sudangrass); and perennial forages (such as alfalfa, ladino clover, red clover, orchardgrass, tall fescue, bermudagrass and Pennisetum). All varieties (except those in the silage tests) were managed on a multiple-cut system with most vari-eties being clipped three or more times to simulate, as nearly as possible, ro-tational grazing or haying conditions.
Dry forage yields are reported for all entries tested and crude protein is reported for the winter annual species. Additional data reported for the silage tests include adjusted silage yield (35% dry weight), bird damage, height, days to flower, and stems per row foot.
Weather-gathering instruments are often not available at the exact test sites. Climatological data are presented from stations nearest a given test and are listed in the appendix. In most cases reporting stations are relatively close to the tests.
Experimental lines are sponsored through the USDA-SEA-AR, state agricultural experiment stations and privately owned companies. These lines are not available for farm use. All entries from privately owned companies are tested on a fee basis, whether they are experimental lines or varieties offered for sale in North Carolina. The Crop Science Department, N. C. State University reserves the right to enter proven varieties to be used as standards, or other varieties of interest. All varieties are from certified sources or from sources which would be able to verify origin. This gives assurance as to the purity of the entries tested and results reportedherecould likely be reproduced.
Annual forage tests are conducted on private farms as well as state experi-ment stations whereas the perennial tests are usually on experiexperi-ment stations. Cooperators and locations for 1980 trials are listed in Table 1. The Forage Variety Testing Program expresses appreciation to these individuals and to the county ex-tension agents and their staffs for assistance in conducting these tests.
Statistical analyses and most other computations are made in the Statistical Laboratory and Computing Center at North Carolina State University. Supervision of these operations is by Dr. John O. Rawlings and Mrs. Sandra Donaghy.
Nitrogen analyses are conducted by the Department of Soil Science, Analytical Service Laboratory at N. C. State University under the supervision of Drs. C. B. McCants, W. P. Robarge and Ms. Beverly Johnson.
Table 1.
2
Names and addresses of cooperators in the 1980 North Carolina Forage Variety Trials.
Name
Winter Annuals Henry Marshall
J. W. Sumner
Sorghum Silage Henry Marshall
J. W. Sumner
Perennial Forages Clyde Z. McSwain
Howell Gentry
H. B. Hardee
C. Ray Campbell
Address
University Farms Raleigh, N. C. Wake County
Upper Coastal Plain Research Station Rocky Mount, N. C. Edgecombe County
University Farms Raleigh, N. C. Wake County
Upper Coastal Plain Research Station Rocky Mount, N. C. Edgecombe County
Piedmont Research Station Salisbury, N. C.
Rowan County
Upper Piedmont Research Station
Reidsville, N. C. Rockingham County McNair Farms Laurinburg, N. C. Scotland County Oxford Tobacco Research Station
Oxford, N. C. Granville County
Extension Agent or Experiment Station Personnel
Carlyle Woodlief
Experiment Station Personnel
Carlyle Woodlief
Experiment Station Personnel
David Hall
Experiment Station Personnel
Warren Bailey Extension Agent Scott Shoulars Extension Agent Clarence Cameron Extension Agent
II
WINTER ANNUAL GRASSES•
SUMMER ANNUAL SILAGE[II PERENNIAL GRASSES
,...
ALFALFAA
WHITE AND RED CLOVERSFIGURE 1 - LOCATIONS OF 1980 FORAGE VARIETY TESTS
Table 2. Geographical soil and environmental information for forage variety test locations.
Crop
Perennial Forages Winter Annuals
Perennial Forages
Perennial Forages
Perennial Forages
Sorghum Silage
Sorghum Silage
Location
Piedmont Research Station Salisbury, North Carolina Central Piedmont, Rowan County Approx. Elev. 825 feet
Oxford Tobacco Research Station Oxford, North Carolina
Northern Piedmont Granville County Approx. Elev. 500 feet.
Upper Piedmont Research Station Reidsville, North Carolina Upper Piedmont
Rockingham County Approx. Elev. 890 feet. McNair Farms
Laurinburg, North Carolina Coastal Plain
Scotland County Approx. Elev. 115 feet
University Research Farm-Unit 1 Raleigh, North Carolina
East Central Piedmont Wake County
Approx. Elev. 390 feet. Upper Coastal Plain Res. Sta. Rocky Mount, North Carolina North Central Coastal Plain Edgecombe County
Approx. Elev. 110 feet
Soil
Davidson-Mecklenburg Association Dark red clay loam soil with firm red clay, thick subsoil.
Helena-Wilkes Association Gray sandy loam soil with firm clay subsoil. Eroded.
Appling-Cecil Association Sandy clay loam surface soil with red, firm clay subsoil.
Norfolk Association
Light-gray, sandy loam surface soil with reddish-brown friable sandy clay loam subsoil.
Appling-Cecil Association Gray sandy loam soils with red, firm clay subsoils.
Norfolk-Ruston Association Light gray surface soil. Yellow friable sandy clay loam subsoil.
Length of Growing Season
200 Days
190 Days
200 Days
210 Days
200 Days
212 Days
Average Annual Rainfall 49 Inches
43 Inches
46 Inches
47 Inches
46 Inches
46 Inches
+:--5
EXPERIMENTAL PROCEDURE FOR WINTER ANNUALS AND PERENNIALS
The detailed procedures for the silage tests will be in the section with re-sults and discussion. Accepted research techniques for small-plot experiments were employed on all tests. Cultural practices were in accord with sound research techniques. Fertilization, seeding rates, dates and other cultural information of a given test are listed with the table which gives dry matter yields by harvests for that test.
The experimental design used for all tests was a randomized complete block with five replications. Plot dimensions were 20 feet long and 2 1/2 feet wide) with the exception of 5 x 20 foot plots for ladino clover, bermudagrass and Pennisetums. Blocks were separated by not less than 2 1/2 feet and all tests were bordered by material either identical or comparable to that included in the test.
In tests which included different species with major differences in seasonal productivity, borders were maintained between species.
All plots except ladino clover, bermudagrass and Pennisetums contained three rows nine inches apart. Seeding was accomplished with a push-type Planet Jr. seed-er which was calibrated for each entry. Ladino clover was broadcast seeded by hand; bermudagrass and Pennisetum were established by placing sprigs into rows.
Seeding rates for all tests conducted were adjusted to 100% germination based on a germination test conducted just prior to planting.
In general, perennials and winter annuals were seeded in September while summer annuals were seeded in May. Standard practices were employed in seedbed preparation.
The machine used to harvest plots was a self-propelled, flail-knife chopper designed specifically for small plot work. Wheels of the machine were spaced such that the harvest rows and the stubble were not damaged during harvesting. The height in inches of stubble left after harvesting was as follows: alfalfa, 3; other perennials and winter annual grasses, 2 1/2.
When weeds were estimated to be greater than 5% of the harvested forage, each plot was evaluated for weed percentage and weed contribution was subtracted from harvested forage weights. Thus all dry forage yields listed in this publication are reported on a weed-free basis.
Dry yield determinations included drying either the whole plot sample or a subsample from all plots in two replications. The percent moisture values from the two reps were used to determine dry yield. Subsampling was necessary in some cases due to the bulk of green material being handled and a shortage of drying space. Samples were dried in a forced air drier at 1300 Fahrenheit. Moisture
re-maining in the samples was determined to be from 5 to 9%. Extreme variations did not exist within separate harvests and no attempt was made to standardize dry weight yields to a constant moisture level. Thus the term "dry forage" as stated in the tables refers to oven-dry forage containing 5 to 9% moisture.
6
WINTER ANNUAL FORAGES
Small grains and ryegrass are an important part of the winter feeding program on many North Carolina farms. Winter annuals can be of particular importance in supplying supplemental energy and protein for silage or hay-fed animals. Maximum production of winter annual grasses occurs in the early spring when feed supplies are generally short; therefore, farmers should con-sider the sU'itability of small grain or ryegrass or a mixture of the two in their feed program.
Seasonal yield should be considered before making any decision on varieties or species. Rye is generally earlier in spring forage production and in maturity than ryegrass. Therefore, rye is better suited to a double-cropping program than ryegrass. Ryegrass usually produces more forage than rye during late April and the month of May.
Wheat and barley appear to be more valuable as silages than for grazing. Winter oats are often grown with crimson clover for hay; however, growing winter oats is always uncertain due to the possibility of winter kill.
Since ryegrass volunteers readily, it may become a pest, especially in the Piedmont when it is used in rotation with the small grains or alfalfa. Herbicides can now be used effectively to reduce this problem in alfalfa. Refer t'o the latest North Carolina Pesticide Manual for specific information.
Table 3.
WINTER ANNUAL FORAGES
Name, address and cu1tivar designation of agencies sponsoring winter annual forage entries in the 1979-80 trials.
Sponsoring Agency Gurley Inc. Mommersteeg International B.V. Ring Around Products Northrup King Company Acco Seed North American Plant Breeders Barenbrug, USA Inc. Mississippi State University
N. C. Agricultural Extension Service
Address
P. O. Box 388 Selma, N. C. 27576
P. O. Box 1 5250 AA Vlijmen The Netherlands
P. O. Box 589 Montgomery, Ala.
1500 Jackson St., N.E. Minneapolis, MN 55413
P. O. Box 1630 Plainview, TX 79072
RR3
Ames, Iowa 50010
P. O. Box 276 Dallas, Oregon 97330
P. O. Box 5248 Mississippi State Mississippi 39762
Raleigh, N. C.
Brand Gurley Gurley Gurley Gurley Mommersteeg Mommersteeg Mommersteeg Ring Around Ring Around Ring Around Ring Around NK NK NK Acco NAPB NAPB NAPB NAPB NAPB NAPB Barenbrug Barenbrug Barenbrug Coker Coker Berger & Plate Cu1tivar Designation
Grazer 2000 Rye GI-75 Rye Abruzzi Rye GI-85 Rye
Shannon Ryegrass Multimo Ryegrass LMW 93 Ryegrass
Trident Ryegrass Sabel Ryegrass Lyra Ryegrass Agusta Ryegrass
Tetrablend 444 Ryegrass 78120 Ryegrass
Wonder Grazer Rye
WR-8ll Rye Meritra Ryegrass Asso Ryegrass Sunbelt Ryegrass 150 Ryegrass SRG-E Ryegrass SR-80 Rye Barspectra Ryegrass Baritra Ryegrass Baroldi Ryegrass Marshall Ryegrass Gulf Ryegrass N. C. Abruzzi Rye Roy \fueat 747 Wheat Clayton Barley Boone Barley 227 Oat Carolee Oat Brooks Oat
Tibbee Crimson Clover
8
RESULTS AND DISCUSSION
Winter Annuals
FVT
l7~/
Piedmont (Tables 4, 5 and 6)This test was planted behind alfalfa on a Cecil clay loam soil. Growing conditions during 1979-80 were excellent. Moderate fall weather resulted in a ton of dry matter produced by several varieties during October and November. Many ryegrass varieties produced almost as much forage as the ryes during the fall and winter. Total yields were quite high with many ryegrasses yielding 3 1/2 to 4 tons of dry forage per acre.
Crimson clovers were significantly damaged by Sclerotina crown and stem rot during late-winter and early spring. Crude protein was very high, averag-ing 20% or more for most entries.
FVT 177 Coastal Plain (Tables 7, 8 and 9)
Total yields of dry matter were not as high as in the Piedmont test, but like the Piedmont test, ryegrass varieties yielded the most forage. Crimson clovers were slightly damaged by Sclerotina crown and stem rot. Both oat cultivars were observed to be infested with rust in late December and early March. Crude protein percentages were good, but not as high as the Piedmont test.
Table 4. FVT 176 Dry matter yields of winter annual forages in the Piedmont (University Farm at Raleigh) 1979-80.
Dry Forage Yields (lbs/Acre)l/
Brand Variety 10/26 12/4
Harvest Dates
3/17 4/3 4/21 5/9 5/29 Total
Mean of Test
L.S.D. Waller-Duncan K-100 Ratio NAPB
NAPB Momme rs teeg Mommers teeg Ring Around Mommersteeg Ring Around NAPB NK NAPB Barenbrug NAPB Barenbrug NK Ring Around Barenbrug Ring Around Gurley NAPB Acco Gurley Gurley Gurley NK Marshall Ryegrass Meri tra Ryegrass Sunbe1t Ryegrass Mu1timo Ryegrass Shannon Ryegrass Agusta Ryegrass LMW 93 Ryegrass Triden t Ryegrass Asso Ryegrass 78120 Ryegrass 150 Ryegrass Barspectra Ryegrass Gulf Ryegrass SRG-E Ryegrass Baro1di Ryegrass Tetrab1end 444 Ryegrass Sabel Ryegrass Baritra Ryegrass Lyra Ryegrass Abruzzi Rye SR-80 Rye WR-811 Rye GI-75 Rye GI-85 Rye Grazer 2000 Rye Wonder Grazer Rye Roy Wheat Boone Barley Brooks Oat
Annua1 Clove rs
704 685 795 311 388 396 711 383 821 481 374 819 474 301 689 478 301 338 190 1362 1032 1385 1249 1378 1074 802 748 775 629 ~ 240 1221 1136 1302 743 1115 785 1147 986 1143 730 1071 1315 1284 807 1242 1071 732 563 628 1336 1192 1342 1406 1226 1311 1435 1207 1010 1017 1086 210 1334 1178 1323 1093 1087 1138 1204 1150 1411 759 1284 1192 1180 1000 996 847 940 878 963 2223 2520 1807 2075 1779 1837 1701 1579 691 545 1301 395 1035 1113 1196 1469 1161 1355 1270 1397 1271 1450 1315 1114 1131 1232 1106 976 1140 1044 1136 672 591 534 508 791 392 542 932 1206 669 1026 270 1602 1583 1386 1814 1658 1778 1382 1714 1073 1696 1378 1064 1335 1670 1163 1513 1874 1792 1684 707 828 1005 613 676 806 896 899 1045 1115 1302 257 1139 1355 794 1167 994 1082 861 766 780 1337 967 976 1065 730 1029 1010 937 912 764 982 463 1356 1015 1218 1300 1341 1194 1083 1226 1055 1069 1043 923 747 1445 913 1222 947 1112 1090 1121 372 8392 8064 8015 7896 7745 7728 7658 7621 7553 7523 7433 7404 7216 7183 7138 7118 6872 6639 6454 6300 6163 6073 5850 5849 5420 5376 5365 4727 3975 6784 774
Mean of Test
L.S.D. Waller-Duncan K-100 Ratio
590 866
NK Tibbee Crims~n
Woogene11u~ 2/ Mt. Barker Sub.-Dixie Crimson Meechee Arrow1etf Ta11arook Sub
1
529 1215 1087 714 977 515 11..L 839 N.S. 310 82 86 97 89 102 120 2.§. 28 462 554 462 238 268 603 439 451 1938 1855 1646 1631 1308 123R 1602 527
1/Average of five replications.
l/About 20% of total yield of the sub clovers escape harvest due to their prostrate habit of growth.
Seeded September 13, 1979 on a Cecil soil.
Soil analysis at seeding: P205 = 139 lbs/A, K20= 367 1bs/A, pH 6.1 and organic matter= 2.2% Fertilization (lbs/A): At seeding 50 N, 60 P205, 0 K20;
November 6, 1979 - 40 N.
Table 5. FVT 176 Crude protein content (%, 1bs /A) of winter annual forages grown on Cecil clay loam (University Farm at Raleigh) 1979-80.
Crude Protein (% and Ibs/A)lJ
Harvest Dates
10/26 12/4 3/17 4/3 4/21 5/9 5/29 Average Total
Brand Variety %~ ~. % Lbs. % Lbs. %~. % Lbs. ~ . % Lbs.
Mommersteeg LMW 93 Ryegrass 28 199 29 337 19 226 25 312 15 210 20 177 17 186 22 1646
Barenbrug Barspectra Ryegrass 26 217 29 387 20 237 25 283 16 167 20 193 17 157 22 1641
NAPB Mer! tra Ryegrass 27 185 27 307 20 239 23 256 15 241 17 236 17 175 20 1640
Monune rs teeg Shannon Ryegrass 27 107 28 312 19 210 24 274 15 255 21 210 18 239 21 1606
Barenbrug Barold! Ryegrass 24 164 28 350 22 215 26 285 17 202 19 198 18 167 22 1581
Ring Around Trident Ryegrass 25 95 30 294 19 222 23 319 15 260 22 171 18 220 21 1580
Marshall Ryegrass 25 178 26 315 16 217 22 226 14 229 18 207 15 199 19 1571
NAPB Sunbel t Ryegrass 27 216 26 342 16 207 21 253 14 193 21 166 16 191 20 1568
NK 78120 Ryegrass 25 121 26 190 19 145 24 348 16 264 21 287 19 199 21 1554
Ring Around Agus ta Ryegrass 22 87 30 235 19 213 23 306 15 268 20 214 16 194 20 1517
Momme rs teeg Mu1t!mo Ryegrass 26 80 27 204 19 206 22 324 14 253 19 225 17 218 19 1510
NAPB Asso' Ryegrass 26 216 26 299 17 236 22 282 16 167 19 145 15 161 20 1506
Gurley Abruzzi Rye 31 421 29 382 18 396 24 158 21 147 24 1505
NAPB 150 Ryegrass 25 93 29 312 20 252 22 288 16 219 18 175 15 161 20 1500
Gulf Ryegrass 27 127 28 358 19 226 24 269 14 194 17 182 18 134 21 1490
NAPB SRG-E Ryegrass 25 74 29 236 20 196 25 310 15 254 20 144 16 232 20 1447
NAPB SR-80 Rye 32 330 31 366 17 424 26 154 20 166 23 1441 ....0
Acco WR-811 Rye 30 413 29 385 17 311 27 146 18 178 24 1432
NK Tetrab1end 444 Ryegrass 25 118 28 299 18 150 23 222 14 214 20 198 17 204 20 1405
Gurley GI-75 Rye 31 386 30 421 16 341 27 135 20 122 24 1404
Ring Around Sabel Ryegrass 25 76 31 225 17 163 24 271 14 267 20 186 19 176 20 1364
Gurley GI-85 Rye 30 407 27 336 16 281 23 182 19 128 23 1336
Barenbrug Baritra Ryegrass 23 78 27 152 18 159 24 255 14 253 20 185 16 179 19 1260
Ring Around Lyra Ryegrass 25 47 27 172 18 172 23 265 14 229 22 165 18 191 19 1242
Gurley Grazer 2000 Rye 30 322 27 351 17 306 26 103 18 143 23 1225
NK Wonder Grazer Rye 30 240 27 385 17 293 25 137 19 167 23 1222
Roy Wheat 28 209 27 325 15 231 23 211 17 157 21 1133
Boone Barley 31 239 29 293 16 111 20 240 14 148 22 1031
Brooks Oat 26 165 26 269 18 100 24 159 15 169 22 862
Mean£!..Test J:!.. 193 ~ 305 1J! 231 ~ 240 1& 202 1.Q. 193 11. 189 11 ~ Annual Clovers
Woogene11up Sub. 24 298 23 20 20 109 23 427
NK Tibbee Crimson 23 202 24 129 20 17 17 77 22 425
Dixie Crimson 24 140 25 177 20 18 19 44 23 380
Mt. Barker Sub. 22 244 23 23 20 92 22 358
Meechee Arrowleaf 25 244 24 24 23 63 25 331
Ta11arook Sub. 25 127 24 28 20 118 22 274
Mean£!..Test Q 171 ~ 203 ll. ll. 1.Q. ~ 11 366
Table 6.
11
Dry forage and crude protein yields of winter annuals for three years in Piedmont North Carolina.
Brand Variety
Annual Dry Forage1/and Crude Protein (CP)!I Yields (lbs/Acre)
197ad/ 1979!!..1 198021 Average
Forage CP Forage CP Forage CP Forage CP
2362 426 3991 735 3807 661 2845 530 1938 425 1855 427 1646 358 1631 380 1308 331 1238 274 2004 392 2811 558 2558 496 2042 402 NAPB NAPB Mommersteeg Mommersteeg Ring Around Mommersteeg Ring Around NAPB NK NAPB Barenbrug NAPB Barenbrug NK Ring Around Barenbrug Ring Around Gurley NAPB Acco Gurley Gurley Gurley NK NK Marshall Ryegrass Meritra Ryegrass Sunbe1t Ryegrass Mu1timo Ryegrass Shannon Ryegrass Agusta Ryegrass LMW 93 Ryegrass Trident Ryegrass Asso Ryegrass 78120 Ryegrass 150 Ryegrass Barspectra Ryegrass Gulf Ryegrass SRG-E Ryegrass Baro1di Ryegrass Tetrab1end 444 Ryegrass Sabel Ryegrass Baritra Ryegrass Lyra Ryegrass Abruzzi Rye SR-80 Rye WR-811 Rye GI-75 Rye GI-85 Rye Grazer 2000 Rye Wonder Grazer Rye Roy Wheat Boone Barley Brooks Oat Annual Clovers Tibbee Crimson Woogene11up Sub. Mt. Barker Sub. Dixie Crimson Meechee Arrow1eaf Ta11arook Sub. 4625 2468 6783 5667 6081 5305 980 539 1486 1273 1420 1272 7458 6837 6266 4840 6612 5342 6320 5603 5897 7705 1420 1369 1181 804 1227 1186 1382 1235 1335 1613 8392 8064 8015 7896 7745 7728 7658 7621 7553 7523 7433 7404 7216 7183 7138 7118 6872 6639 6454 6300 6163 6073 5850 5849 5420 5376 5365 4727 3975 1571 1640 1568 1510 1606 1517 1646 1580 1506 1554 1500 1641 1490 1447 1581 1405 1364 1260 1242 1505 1441 1432 1404 1336 1225 1222 1133 1031 862 5150 7426 6850 4841 6865 6142 6242 5707 5799 5912 1347 1469 1341 944 1316 1392 1412 1304 1327 1305
l/Average of five replications.
~/compositeof five replications.
llRockingham County. See AG 49 Crop Sci. Report 71 for details on establishment and fertilization ~/RowanCounty. See AG 49 Crop Sci. Report 76 for details on establishment and fertilization.
Table 7.
12
FVT 177 Dry forage yields of winter annuals grown at the Upper Coastal Plain Research Station (Rocky Mount), 1979-80.
Forage Yield~1 (lbs/A)
Brand Variety 11/1 12/3
Harvest Dates
3120 4/6 4/28 5/22 Total
Mean of Test
L.S.D. Waller-Duncan K-IOO Ratio
Mean of Test
L.S.D. Waller-Duncan K-IOO Ratio NK NAPB Mommersteeg NAPB Mommersteeg NAPB NAPB Gurley Mommersteeg Acco NAPB Barenbrug NK NAPB Gurley Gurley NK Ring Around Barenb rug Gurley Ring Around Barenbrug Ring Around Ring Around Coker Coker NK Marshall Ryegrass Tetrablend 444 Ryegrass 150 Ryegrass
Gulf Ryegrass Multimo Ryegrass Meritra Ryegrass LMW 93 Ryegrass Sunbelt Ryegrass Asso Ryegrass GI-85 Rye Shannon Ryegrass WR-8ll Rye SR-80 Rye Barspectra Ryegrass 78120 Ryegrass SRG-E Ryegrass GI-75 Rye Grazer 2000 Rye Wonder Grazer Rye NC Abruzzi Rye Trident Ryegrass Baroldi Ryegrass Abruzzi Rye Sabel Ryegrass Baritra Ryegrass Lyra Ryegrass Agusta Ryegrass Roy Wheat 747 Wheat Clayton Barley Boone Barley 227 Oat Carolee Oat Brooks Oat Annual Clovers Tibbee Crimson 21
Woogenellup Sub.-Dixie Crimson 21
Mt. Barker Sub.! Tallarook Sub.1. 596 414 376 319 411 615 564 612 695 1101 389 1111 840 726 217 270 953 1102 857 1058 301 667 908 225 299 345 206 716 671 617 539 204 463 302
lZ.2-198 466 417 480 584 402 569 537 632 597 687 478 956 656 678 279 434 784 743 831 741 294 581 701 204 253 256 281 525 265 300 364 362 471 460 508 149 557 695 563 830 422 312 558 385 690 1499 477 1354 1760 491 209 510 1599 1600 1110 1327 278 545 1531 259 287 260 236 887 680 464 494 620 304 311 708 319 1525 623 869 145 56 644 391 1587 1631 1535 1676 1372 1322 1291 1359 1301 907 1495 667 851 1118 1332 1382 538 606 668 691 1467 1046 556 1406 1133 1212 1034 1464 1478 1805 2013 1205 585 760 1191 230 169 154 215 115 101 151 30 1990 1859 1715 1279 1932 1835 1505 1412 1209 942 1484 996 941 1299 2205 1599 967 770 1314 920 1836 1232 930 1895 1857 1785 1765 642 864 771 424 846 1053 1028 1326 354 704 1249 899 1159 1258 1054 396 739 5935 808 5825 871 5541 725 5413 820 5359 695 5349 844 5298 774 5174 667 5157 5135 810 5133 5084 5048 715 5025 734 4977 708 4903 4841 4820 4779 4737 534 4710 596 4667 4627 535 4525 667 4497 572 4430 763 4285 4234 3959 3957 3835 3237 2878 2861 ill- 4713 N.S. 639 2397 2026 1983 1420 1415 1848 528~/AVerage of five replications.
IIAbout 20% of total yield of the sub-clovers escape harvest due to their prostrate habit of
growth.
Seeded September 20, 1979 on a Norfolk sandy loam soil. Fertilization (lbs/A): At seeding 30 N, 30 P
205 and 60 K20;
Table 8. FVT 177 Crude protein (%, 1bs/Acre) of winter annual forages grown at the Upper Coastal Plain Research Station (Rocky Mount) 1979-80.
Crude Protein (%, 1bs/A)1/
Harvest Dates
11/1 12/3 3/20 4/10 4/28 5/22 Average Total
Brand Variety %---u;-;: ~ % Lbs. % Lbs , % Lbs. % Lbs. % Lbs ,
NK Wonder Grazer Rye 24 209 26 218 13 150 19 129 15 199 19 904
Gurley GI-85 Rye 23 251 25 170 13 192 16 147 14 133 17 893
NAPB SR 80 Rye 23 197 25 166 13 238 18 153 15 138 18 891
Gurley Grazer 2000 Rye 22 246 26 ·196 13 211 18 111 16 124 18 888
NC Abruzzi Rye 23 239 25 182 13 168 20 137 17 156 19 881
Acco WR-811 Rye 22 242 23 219 12 162 17 116 13 133 17 873
Gurley GI-75 Rye 24 233 24 190 13 205 19 102 14 134 18 864
Mommersteeg LMW 93 Ryegrass 19 110 22 119 12 65 17 225 16 236 12 105 16 861
Marshall Ryegrass 19 114 23 106 12 67 14 227 13 261 11 80 14 855
NAPB Meri tra Ryegrass 21 126 23 133 12 37 15 197 14 266 12 85 16 845
NK Tetrab1end 444 Ryegrass 20 83 26 108 12 82 13 213 14 270 10 83 14 839
Momme rs te e g Shannon Ryegrass 22 84 24 117 12 56 16 233 17 250 12 97 16 837
Mommersteeg Mu1timo Ryegrass 18 75 28 112 13 54 14 199 15 297 12 97 16 834
Barenbrug Barspectra Ryegrass 20 147 22 148 12 59 16 178 16 213 12 88 17 833
NAPB 150 Ryegrass 18 68 23 112 14 77 15 230 14 242 10 91 15 822
Gurley Abruzzi Rye 22 198 25 174 13 196 20 111 15 143 18 822
NAPB Asso Ryegrass 21 143 21 126 12 84 14 183 15 177 11 76 15 789 I-'
W
Barenbrug Baro1di Ryegrass 20 131 22 128 14 75 17 175 16 201 13 75 17 785
Gulf Ryegrass 20 64 22 127 12 99 14 227 14 184 10 70 14 771
NK 78120 Ryegrass 21 46 25 69 12 26 16 216 15 332 11 83 15 771
NAPB Sunbe1t Ryegrass 20 122 21 134 13 48 13 182 13 189 11 85 15 759
NAPB SRG-E Ryegrass 20 55 24 105 14 71 16 219 14 232 11 78 15 759
Ring Around Trident Ryegrass 18 54 24 71 14 39 15 226 15 281 13 71 16 742
Roy Wheat 22 158 24 124 14 122 15 221 16 105 17 730
Barenbrug Bari tra Ryegrass 18 52 22 57 13 39 17 196 15 288 14 96 16 727
Ring Around Sabel Rye g r as s 19 43 23 47 15 39 17 237 15 277 13 70 16 713
Coker 747 Wheat 23 158 26 69 16 108 15 216 17 146 17 697
Ring Around Agusta Ryegrass 20 40 23 64 13 31 16 165 16 276 13 97 16 673
Ring Around Lyra Ryegrass 17 58 23 60 14 37 16 195 14 244 12 70 15 664
Clayton Barley 25 152 26 79 13 63 13 228 15 120 16 641
Boone Barley 22 119 26 96 13 67 11 228 17 74 15 583
Caro1ee Oat 22 102 25 117 15 46 18 104 15 156 18 524
Brooks Oat 21 64 25 113 15 46 16 120 14 148 17 492
Coker 227 Oat 20 41 24 87 11 69 13 158 14 116 15 471
Mean.£fTest ~ 124 ~ 122 Q
zz
.!.§. 182 J2 198 g ~ .!.§. 766 Annual CloversNK Woogene11up Sub. 27 166 26 40 22 274 24 480
Tibbee Crimson 21 316 22 37 16 110 19 463
Dixie Crimson 21 185 23 50 17 157 20 392
Mt. Barker Sub. 25 36 27 31 21 247 22 315
Ta11arook Sub. 25 14 27 28 25 311 25 352
Mean~Test ~ 144 ~
u
lQ 220 11- 400Table 9.
14
Dry forage and crude protein yields of winter annuals grown during three years in the Coastal Plain of North Carolina.
Annual Dry FOrage.!.! and Crude Protein (Cp)~/Yie1ds(lbs/A)
Brand Variety Forage CP
1979!!...!
Forage CP Forage1980~.!CP
Average Forage CP
NK
NAPB
Momme rs teeg NAPB Mommersteeg NAPB NAPB Gurley Mommersteeg Acco NAPB Barenbrug NK NAPB Gurley Gurley NK Ring Around Barenbrug Gurley Ring Around Barenbrug Ring Around Ring Around Coker Coker NK Marshall Ryegrass Tetrab1end 444 Ryegrass 150 Ryegrass
Gulf Ryegrass Mu1 timo Ryegrass Meri tra Ryegrass LMW 93 Ryegrass Sunbe1t Ryegrass Asso Ryegrass GI-85 Rye Shannon Ryegrass WR-8ll Rye SR-80 Rye Barspectra Ryegrass 78120 Ryegrass SRG-E Ryegrass GI-75 Rye Grazer 2000 Rye Wonder Grazer Rye NC Abruzzi Rye Trident Ryegrass Baroldi Ryegrass Abruzzi Rye Sabel Ryegrass Baritra Ryegrass Lyra Ryegrass Agusta Ryegrass Roy Wheat 747 Wheat Clayton Barley Boone Barley 227 Oat Caro1ee Oat Brooks Oat Annual Clovers Tibbee Crimson Woogene11up Sub. Dixie Crimson Mt. Barker Sub. Ta11arook Sub. 3086 2336 3551 4199 4120 2562 2126 2133 454 338 539 610 575 390 338 306 5889 6674 6390 6135 6045 5766 5621 5314 5240 5151 4710 4449 4721 4157 4433 4226 3147 3574 780 1181 821 953 900 1005 979 916 999 902 700 686 700 582 713 805 721 834 5935 5825 5541 5413 5359 5349 5298 5174 5157 5135 5133 5084 5048 5025 4977 4903 4841 4820 4779 4737 4710 4667 4627 4525 4497 4430 4285 4234 3959 3957 3835 3237 2878 2861 2397 2026 1983 1420 1415 855 839 822 771 834 845 861 759 789 893 837 873 891 833 771 759 864 888 904 881 742 785 822 713 727 664 673 730 697 641 583 471 524 492 463 480 392 315 352 58507 6108 4963 4607 5609 5425 5334 4569 4753 4633 4334 3656 3661 3697 3148 3104 2283 2494 809 1001 682 712 829 939 935 773 832 766 698 572 540 526 514 598 518 593
l/Average of five replications.
~/Compositeof five replications.
15
SUMMER ANNUAL FORAGES FOR SILAGE
In 1980 several summer annuals were planted to determine their potential for silage production. The primary goal was to evaluate the forage sorghums, but one or two varieties from the following annuals were also tested: grain sorghum, corn, sudangrass, sorghum-sudangrass and millet. Table 10 contains information on the entries tested and the sponsoring agencies.
Experimental Procedure for Silage Tests
The summer annuals were tested at two locations (1) University Farms in Raleigh (FVT 179) and (2) Upper Coastal Plain Research Station in Edgecombe County (FVT 180). The varieties were planted in a randomized complete block design with four or five replications. Each variety was planted in three rows 38 (FVT 179) or 36 (FVT 180) inches apart and 20 feet in length. Replications were separated by 6 foot borders which contained a single row of FSIA as a bor-der row. Each variety was planted with a Planet Jr. seeder which was calibrated for the entry. Seeding rates were between 80,000-100,000 seeds per acre with the exception of corn (28,000). Fertilization, weed control, planting dates, etc. are presented at the bottom of tables containing the data.
Data (presented in tables) were collected from the center row of each variety when most of the seeds were in the soft dough stage of maturity. The plants were cut by hand at a 4-inch stubble, weighed green, subsampled and dried for yield and moisture determinations. Plant height was obtained by measuring three random plants per row. Birds pecked the seeds from some varieties and re-duced seed yields before soft dough stage was reached. An estimate of the per-cent of the seedhead damaged was taken at harvest.
RESULTS AND DISCUSSION
FVT 179. The 1980 season June - September was extremely dryas indicated since precipitation average was about 7.1 inches below normal. The test was irrigated with about 1 inch of water on June 9 and June 23 primarily to keep it from dying. No attempt was made to supply all of the necessary water for pro-duction. The entries were all severely drought dressed in August and September and the results presented will not be representative of normal years.
16
SORGHUM SILAGE
Table 10. Name, address and cultivar designation of agencies sponsoring entries in the 1980 sorghum silage variety trials.
Name
DeKalb Ag Research
FFR Cooperative
Taylor Evans Seed Company Northrup King Company
Acco Seed
Pioneer Hi-Bred International, Inc.
N. C. Agricultural Extension Service
Address Route 2
Lubbock, Texas 79415 4112 East State Road 225 W. Lafayette, Indiana
47806 Box 68
Tulia, Texas 79088 P. O. Box 151 Columbus
Mississippi 39701
Box 1630
Plainview, Texas 79072
1000 West Jefferson St. Tipton, Indiana 46072
Raleigh North Carolina Brand DeKalb FFR FFR T-E T-E NK NK NK NK NK Paymaster Paymaster Paymaster Pioneer Pioneer Pioneer DeKalb DeKalb Pioneer Pioneer Pioneer GSA GSA McNair NK Cultivar Designation FS25a+
66 (Sotghurn x Sudan) 74A (Sudangrass)
Table 11. FVT 179 Silage yields and characteristics of forage sorghums grown on the University Farm in l.Jake County, 1980.1 / Silap,e Yield
Days'll
Drv Matter Percent Adiusted Plant Percent Numher
Harvest·V
Yieid Pounds T)ry 65% Moisture Height Bird Percent Stems to
Brand Variety Per Acre Natter Tons Per Acre Inches Damage Lodged Per Row Ft. Date Flower
GSA *1586F 14114 30 20.2 77 61 0 6.2 September 25 95
Pioneer 931 14034 29 20.2 104 16 0 4.1 September 25 95
NK 367 13110 25 18.7 93 0 0 4.2 September 25 95
Pioneer
~~i~/
13079 33 18.7 69 44 0 5.0 September 25 95Pioneer 11477 24 16.4 71 0 0 3.5 September 25
McNair *Exp. 3135 10811 29 15.4 67 50 0 3.0 September 25 82
Paymaster FS 451 10727 29 15.3 62 11 0 3.9 August 25 82
HT 135 10387 30 14.8 63 29 0 3.0 September 25 95
NK *X7983F 10367 30 14.8 69 III 1 4.1 August 25 74
GSA Growers 30F 10327 2R 14.8 63 4R 0 3.6 August 28 82
DeKa1b FS 25A+ 10317 27 14.7 65 30 0 4.2 August 28 82
NK Silo Milo 2 10072 27 14.4 76 30 1R 4.2 August 25 74
Pioneer 947 9926 32 14.2 74 0 0 4.8 August 25 74
Paymaster FS 461 9395 29 13.4 62 13 0 3.4 August 25 82
NK 300 9067 31 13.0 60 0 0 4.7 August 15 74
Paymaster FS 401R 8884 25 12.7 64 31 0 4.5 August 25 82
FFR 66 (Sorghum x Sudan) 8839 31 12.6 94 0 q 5.8 August 15 68
McNair Energy Plus 8743 31 12.5 79 10 23 3.4 August 15 68
T-E Sd Lomaker 8720 27 12.5 70 48 3 4.5 August 25 74 ::;
T-E Go1dmaker-T 8622 30 12.3 83 15 5 3.3 August 25 68
Paymaster FS 351 8522 32 12.2 50 29 0 4.4 August 25 74
DeKa1b FS 1A 8052 31 11.5 64 4 0 3.8 August 15 68
NK *X7984F 7624 33 10.9 86 3 54 3.0 August 15 68
NK Savanna 5 (Grain) 7445 38 10.6 51 0 0 3.7 August 15 68
FFR 74A (Sudan) 7272 39 10.4 85 0 5 10.0 August 15 60
Pioneer 3160 (Corn) 6946 29 9.9 54 29 24 1.8 August 25
Tifleaf 1 (Pearl) 6726 24 9.6 22 0 0 1.3 August 25 95
Pioneer 8417 (Grain) l.889 33 7.0 48 97 12 4.0 August 25 68
Mean..QfTest 9589 lQ. 1l..=1. 2i II 1 ~
L.S.D. Waller Duncan - K Ratio=100 1725 2 2.50 7 21 15 18
*Experimental
1/All data based on four replications. ~/Entries harvested at early to late dough stage.
1/Days from plant emergence to 50% inflorescence. ~/Hadnot f Lovere d at harvest.
Planted May 8, 1980 on a Cecil clay loam.
Soil test report at seeding: P 205 59 1bs/A, K20 91 1bs/A, pH - 5.7 and organic matter - 1.1%. Fertilizer at seeding (lbs/ A): 180 P 20 and 180 K20.
Nitrogen at 75 applied May 29 and June i9. Weed Control: 2.4 1bs. (A.I.) AAtrex - May 26.
Table 12. FVT 180 Silage yields and characteristics of forage sorghums grown on the Upper Coastal Plain Research Station in Edgecombe County, 1980.
Silage Yield
Days11 Dry Matter Percent Adjusted Plant Percent Number
Harvest~/
Yield Pounds Dry 65% Moisture Height Bird Percent Stems to
Brand Variety Per Acre Matter Tons Per Acre Inches Damage Lodged PerRow Ft. Date Flower
Pioneer 911~1 19388 32 27.7 113 0 5 3.9 September 5
Pioneer 931 15629 39 22.3 121 0 0 4.7 August 13 75
NK 367 14806 29 21.2 118 0 3 3.3 August 21 83
Paymaster FS 451 13752 32 19.6 81 0 1 4.6 August 13 75
HT 135 13134 34 18.8 97 30 23 3.6 August 28 83
GSA *1586F 12971 29 18.5 96 2 23 4.6 August 21 83
Pioneer 923 12532 42 17.9 100 42 16 5.2 August 28 83
McNair *Exp. 3135 12417 32 17.7 103 26 10 2.2 August 28 83
T-E Silomaker 12391 28 17.7 73 0 1 3.6 August 13 75
DeKa1b FS 25a+ 12172 27 17.4 83 2 0 4.2 August 21 83
Eaymaster FS 401R 12095 28 17.3 69 1 1 3.8 August 13 83
Pioneer 947 11955 33 17.1 84 19 0 3.9 August 13 83
Paymaster FS 461 11896 29 17.0 83 0 3 2.8 August 13 75
Pioneer 3160 (Corn) 11763 39 16.8 78 0 0 1.6 August 13 69
NK *X7983F 11462 33 16.4 66 1 2 3.9 August 21 75
NK Silo Milo 2 10538 31 15.1 70 5 15 4.2 August 13 69
Paymaster FS 351 10310 33 14.7 54 1 1 11.2 August 21 75
T-E Go1dmaker-T 10302 32 14.7 75 0 1 4.8 August 5 69
Tif1eaf 1 (Pearl Millet) 9564 28 13.7 71 0 0 10.8 August 13 75 ....00
NK 300 9310 33 13.3 58 3 0 3.4 August 13 83
FFR 66 (Sorghum-Sudan) 9242 31 13.2 92 0 21 5.2 August 5 66
Growers 30F 9173 27 13.1 78 39 1 3.2 August 21 83
McNair Energy Plus 8987 28 12.8 67 91 1 3.0 August 13 69
NK *X7984F 8871 35 12.7 73 0 11 3.4 August 5 69
DeKalb FS-lA 8592 29 12.3 58 95 1 4.1 August 13 75
NK Savanna 5 (Grain) 8117 39 11.6 46 0 0 3.4 August 13 69
Pioneer 8417 (Grain) 5495 30 7.9 40 29 0 3.8 August 13 69
FFR 74A (Sudan) 5164 30 7.4 71 0 0 8.6 July 28 55
Mean£fTest 11144 B. 12.:.2.
ts.
.!i ~ 4.4Waller-Duncan - K Ratio =100 2436 3 3.5 8 18 14 85
*Expe rimen ta1s
1/All data based on five replications. '1:-/Entries harvested at early to late dough stage. 1/Days from plant emergence to 50% inflorescence .
.YHa d not flowered at harvest.
Planted May 6, 1980 on a Norfolk loamy sand. Soil test report at seeding: P20
a
-
100 1bs/A, K20- 42 1bs/A, pH - 5.9, and organic matter - 6. Fertilized at seeding (lbs/A): 3 N, 30 P20 5 and 60 K20. June 18, 1980 - 114 N. Weed Control: 1.5 Ibs/A (A.I.) AAtrex - May 27, 1980.
Table 13. FVT 180 Regrowth yields and plant characteristics of forage sorghums grown on the Upper Coastal Plain Research Station in Edgecombe County, 1980.
Regrowth Datal/ - Harvest Date 10/27/80 Combined Yield-Silage Plus Regrowth
Silage Yield Silage Yield
Dry Matter Percent Adj usted Plant
Percen
tJ,./
Dry Matter Adjusted
Yield Pounds Dry 65% Moisture Height Pounds 65% Moisture
Brand Variety Per Acre Matter Tons Per Acre Inches Head Per Acre Tons Per Acre
Pioneer 911 2677 23 3.8 37 0 21530 30.8
Pioneer 931 3864 27 5.5 58 25 18720 26.7
NK 367 2773 21 4.0 46 4 17024 24.3
T-E Silomaker 5022 29 7.2 51 74 16409 23.4
Paymaster FS 451 2420 23 3.5 37 1 15688 22.4
Pioneer 947 4206 28 6.0 48 60 15320 21.9
HT 135 2569 22 3.7 37 1 15189 21.7
Pioneer 923 3010 24 4.3 35 3 14939 21.3
DeKa1b FS 25a+ 3450 23 4.9 40 2 14931 21.3
McNair Exp. 3135 2821 21 4.0 39 1 14674 21.0
GSA l586F 2104 25 3.0 39 7 14654 20.9
Paymaster FS 46J. 3384 26 4.8 47 30 14603 20.9
Paymaster FS 401R 3068 23 4.4 48 57 14550 20.8
NK X7983F 2915 30 4.2 41 13 13794 19.7
....
T-E Go1dmaker-T 3841 31 5.5 58 100 13375 19.1 \0
NK Silo Milo 2 3073 24 4.4 47 66 12996 18.6
McNair Energy Plus 4655 30 6.7 59 100 12711 18.2
FFR 66 (Sorghum x Sudan) 4055 33 5.8 63 100 12485 17.8
Paymaster FS 351 2/ 1990 25 2.8 29 3 11901 17.0
Pioneer 3160 (Corn)-
*
*
*
*
*
11763 16.8DeKa1b FS 1A 3853 32 5.5 43 100 11674 16.7
Tif1eaf 1 (Pearl Millet) 2548 36 3.6 34 100 11602 16.6
NK X7984F 3244 34 4.6 59 97 11466 16.4
Growers 30F 2249 22 3.2 38 3 10972 15.7
NK 300 1234 24 1.8 28 26 10298 14.7
NK Savanna 5 (Grain) 2572 29 3.7 38 94 10175 14.5
FFR 74A (Sudan) 4437 35 6.3 64 100 8714 12.4
Pioneer 8417 (Grain) 2807 27 4.0 32 100 7743 11.1
Mean of Test 3142 28 ~ 44 !!2 13568 ~
WallerDuncan
-K Ratio =100 1127 3 1.6 5 18 2567 3.7
l/Regrowth data based on four replications due to wet conditions at time of harvest.
1:.../Corn had no regrowth.
20
PERENNIAL FORAGES
The perennial species reported in this publication include orchardgrass, tall fescue, bermudagrass, Pennisetum (experimental), alfalfa, ladino clover, and red clover. Sponsoring agencies for the species entered in these tests are given in Table 14.
Tall fescue and orchardgrass are two of the most important perennial cool-season pasture grasses in the state. Both grow well in combination with ladino clover where ladino is adapted. Orchardgrass is grown for hay with or without a legume. Tall fescue is more widely adapted than orchardgrass especially east of Raleigh.
Bermudagrass is fairly widely used in the Coastal Plain, however there is a need for its use as a summer forage in the Piedmont. It is a long lived per-sistent grass which responds to fertilization from May - September, a time when fescue growth is often retarded because of drought and high temperatures. Bermudagrass may be grazed close and continuously or harvested as hay.
Of the perennial legumes reported here, ladino clover and alfalfa are prob-ably the most widely used. Alfalfa must be grown on relatively deep, fertile, well-drained soils with good water-holding capacities. These soils should be
limed to a pH of 6.5 to 7.0. Alfalfa is best utilized as hay. Ladino is the number one pasture legume in North Carolina and is adapted over most of the state except above 2500-3000 feet elevation and on the deep sands of the Coastal Plain and sand hills regions.
21
Table 14. Names, addresses and cultivar designation of agencies sponsoring entries in the 1980 North Carolina Perennial Forage Trials.
Name
Agriculture Service Corp.
Berger&Plate Company
Clemson University
Address
1121 Boone Road, S.E. Salem, Oregon 97302
1 California Street San Francisco, CA 94111
Clemson, SC 29631
Brand
ASC
Berger &Plate Berger &Plate
Cultivar Designation
Tamar White Clover
Sacremento White Clover *B-2 Festulolium
*OG-65G Orchardgrass
Farmers Forage Research Cooperative
Great Plains Research Company, Inc.
4112 E. State Road FFR
W. Lafayette, IN 47906 FFR FFR FFR FFR FFR FFR FFR
1221 Pioneer Court Great Plains Cary, NC 27511
Weev1chek Alfalfa Hi-Phy Alfalfa Tempo Alfalfa Redman Red Clover *Syn. D. Fescue
21 Forager Fescue-Able Orchardgrass Hallmark Orchardgrass
Cimarron Alfalfa
North American Plant Breeders
N. C. Agricultural Ext. Service
N. C. State University
Northrup King Company
RR3
Ames, Iowa 50010
N. C. State Univ. Raleigh, NC 27650
Crop Science Department Raleigh, NC 27650
1500 Jackson St., N.E. Minneapolis, MN NAPB NAPB NAPB NAPB NAPB NAPB NK NK NK NK NK NK NK NK NK NK NK NK NK NK NK
Apollo Alfalfa II
Vangard Alfalfa-Atlas Alfalfa Olympic Alfalfa Redland Red Clover *TF0070 Fescue
Williamsburg Alfalfa Saranac AR Alfalfa Libertv A1fa1f~1 Victoria Alfalfa Agate Alfalfa Riley Alfalfa Chesapeake Red Clover Tillman White Clover Regal White Clover Kentucky 31 Fescue Coastal Bermudagrass Tifton 44 Bermudagrass Midland Bermudag ras s *Pennisetum flaccidum *Pennisetum orientale
Phytor Alfalfall Thor Alfalfa Gladiator Alfalfa *K7-28 Alfalfa *K7-3l Alfalfa *Florie Red Clover *78001 Red Clover *78023 Red Clover *78042 Red Clover
Arcadia White Clover *K2-28 Fescue
22
Table 14. (Continued) Names, addresses and cultivar designation of agencies sponsoring entries in the 1980 North Carolina Perennial Forage Trails.
Name
Oregon State University
Pickseed West
Pioneer Hi-Bred Inter.
University of Kentucky
University of Missouri
Waterman-Loomis Company
Address
10L Farm Crops Bldg. Corvallis, OR 97331
P. O. Box 888 Tangent, OR
P. O. Box 85 Johnston, Iowa
Lexington, Ken tucky
Dept. of Agronomy 210 Waters Columbia, MO 65201
7625 Brown Ridge Rd. Highland, MD 20777
Brand
Pickseed Pickseed Pickseed
Pioneer Pioneer Pioneer
WI.. WI.. WI.. WL
Cultivar Designation
Lucky Ladino Clover
Felopa Fescue X Ryegrass INA Orchardgrass Kay Orchardgrass
*MH-2 Alfalfa *OB-2 Alfalfa *OF-l Alfalfa
Kenstar Red Clover Kenland Red Clover Kenhy (Fescue X Ryegrass)
Missouri-96 ~escue
*H-l Fescue *H-2 Fescue
311 Alfalfa 312 Alfalfa 318 Alfalfa 512 Alfalfa
*Expe rimen tals
l/vangard formerly reported as Victor
llForager formerly reported as Syn. I.
llphytor formerly reported as K3-l5
23
RESULTS AND DISCUSSION
FVT 168 (Table 15). This second year stand yielded fairly well, but Sclerotium rolfsii (Southern blight) plagued the stand in June and July just as i t did in August and September of 1979. The dry weather during August, \1980 further contributed to the very poor yields in September.
FVT 129 (Table 16). This test was not harvested in 1979 for official yields, however the area was treated as usual except the growth was removed without measuring the production. The 1980 season was the fifth growing sea-son and yields were generally excellent. In August, 1980 weeds were encroach-ing and on September 18, 1980 crabgrass and foxtail were estimated to cover 20% of the plots.
FVT 141 (Table 17). The four best varieties in 1980 also have the highest four year average yields. The plots of several varieties thinned out by July allowing considerable weed growth by September. Stand and weed estimates were made in September. This test will be fertilized and clipped in 1981, but yields will not be taken again t i l l 1982.
FVT 162 (Table 18). This three year test has given the best average yields of any test in the program. In the third growing season the average yield was better than 6 tons per acre.
Red Clover
FVT 169 (Table 19). Yields of red clover were excellent for the first two cuttings, but dropped drastically by late June. On July 30, 1980, there was not enough growth to harvest, but estimates of stands were made.
FVT 161 (Table 20). Yields of this third year stand dropped drastically from 6 tons/A in 1979 to 1.5 tons/A in 1980. There was not enough growth to harvest after July 10.
Ladino Clover
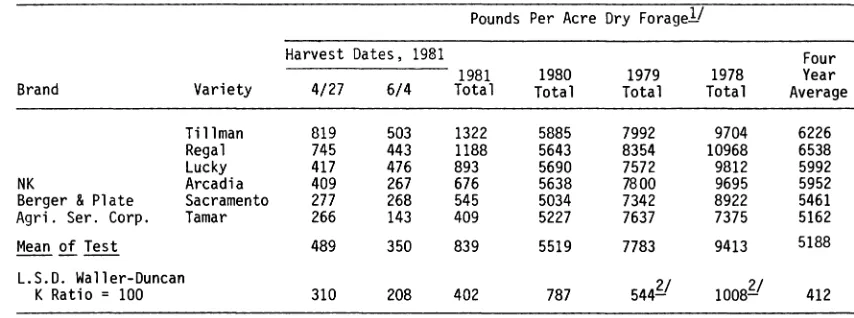
FVT 160 (Table 21). The yields from this third year stand averaged 5519 lbs/acre which was about 2200 Ibs. less than 1979 yields. Summer production was hampered by weeds as shown below.
Orchardgrass
FVT 167 (Table 22). Yields in 1980 were only slightly better than in 1979. There was very little regrowth from June 11 t i l l August 27, 1980 when additional N was applied.
Tall Fescue
24
Bermudagrass - Pennisetum
These tests were established during May of 1978 by planting two rows of sprigs 2 feet apart in 5 feet by 20 feet plots. The tests were not harvested for yield in 1979 because of failure of some entries to completely cover the plot area. During 1980, the entire 5 by 20 foot plot area was harvested for yield in order that relative differences in the rate of establishment would be reflected in the yields. This was particularly evident for Tifton 44 in FVT 159. During 1981, only the central 3 feet of each plot will be harvested for yield.
FVT 171 (Table 24). The bermudagrass and Pennisetum plots were establish-ed from sprigs in 1978, but were not samplestablish-ed for yield until 1980 because ground coverage was inadequate. The Pennisetums are not released varieties, therefore not available to the public. The bermudagrass varieites produced similar yields.
Table 15. FVT 168 Dry matter yields of alfalfa on the McNair Farms in Scotland County, North Carolina. Pounds Per Acre Dry Forage Yie1d!/
Harvest Dates, 1980 1980 1979 TwoYear
Brand Variety 4/30 6/2 6/30 7/30 9/10 Total Total Average
Great Plains Cimarron 4094 3213 1435 1345 621 10708 10525 10616
WI.. WI.. 312 3692 3231 1632 1312 565 10431 10776 10603
WI.. WI.. 311 3444 3214 1553 1499 650 10358 10048 10203
~VL '-lL 318 3487 3105 1592 1335 644 10163 9435 9799
FFR Hi-Phy 3322 3240 1470 1391 622 10046 9912 9979
Liberty 4072 3150 1123 1088 497 9929 9947 9938
NAPB Vangard 3519 3009 1224 1190 566 9507 10314 9910
NK ,~ K7-28 3583 2980 1223 941 566 9292 10255 9773
NAPB Apollo 3332 2970 1277 1062 585 9225 10070 9647 N
Saranac AR 3580 2806 1188 1021 494 9089 10153 9621 In
Arc 3539 2746 989 932 448 8655 9675 9165
NK
*
K7-31 3150 2887 1092 1002 517 8649 10002 9325Riley 3099 2656 1290 1133 454 8632 9856 9244
NK Phytor 3102 2849 1152 1062 465 8630 9582 9106
NK Thor 3206 2674 1025 1011 429 8345 10008 9176
NK Gladiator 3249 2838 884 916 435 7867 9572 8719
Mean of Test ·3467 2945 1259 1140 535 9345 10008 9676
-L.S.D. Waller Duncan
5551:.1
K Ratio = 100 573 577 216 352 131 1151 486
1/A f f' 1 . .
*
Experimental- verage 0 lye rep lcatlons.
~/Fisher
analysis - L.S.D.Seeded September 12, 1978 at 20 1bs/acre on Marlboro sandy loam. Fertilized (lbs/A) at seeding: 68 PO, 203 K
20, 3 Boron Maintenance: September 27, 1979 - 60
i
20 ; February 10, 1980 - 204 K20 and 3.4 Boron Weed Control (lbs/A): December 7, 1978 - 1 Kerb (A.I.) and .5 Sencor (A.I.)
Table 16. FVT 129 Dry matter yields of alfalfa on the Oxford Tobacco Research Station in Granville County, N. C.
Pounds Per Acre Dry Forage Yie1dsl/
Harvest Dates, 1980 1980 1978 1977 1976 YearFour
Brand Variety 5/13 6/13 7/9 8/8 9/17 Total Total Total Total Average
WI.. 318 2779 2870 1298 1225 1856 10029 9664 9784 8029 9376
NAPB Atlas 3572 2786 1120 852 1671 10001 9441 9676 7261 9095
Victoria 3422 2730 1045 890 1858 9946 8903 7654 7108 8403
Pioneer *MH-2 2875 2983 1162 980 1929 9930 8805 7590 5599 7981
Pioneer *OB-2 2862 3025 1110 997 1861 9856 9585 9054 6531 8756
Liberty 3333 2654 1093 768 1770 9619 9039 8433 6479 8393
NAPB Apollo 3131 2747 1099 775 1768 9520 9343 8597 5909 8342
NK Thor 3001 2648 1144 969 1657 9418 9394 8032 7336 8545
NAPB Olympic 2997 2491 1069 853 1810 9221 8788 8760 6925 8423
Pioneer *OF-1 2848 2690 952 759 1865 9115 8608 7699 5610 7758
Saranac AR 2689 2897 1098 792 1613 9089 9417 9190 7016 8678
FFR Tempo 3021 2470 1033 830 1721 9075 8976 8642 6752 8361
NK Phytor 2794 2588 1038 805 1826 9051 9089 7863 5786 7943
Saranac 3055 2635 1026 680 1643 9039 8730 6812 6631 7803
Williamsburg 2721 2500 1083 911 1801 9015 8513 7420 6253 7800
Apa1achee 2442 2685 1104 735 1864 8830 8922 8391 6664 8202 N
0'1
Cherokee 2771 2532 984 820 1712 8818 8979 8156 6370 8081
Arc 2836 2467 1012 728 1701 8743 9097 8491 6786 8279
Team 2954 2467 909 698 1696 8723 8193 7491 6764 7793
FFR Weev1chek 2717 2451 984 775 1734 8660 9002 7815 6371 7962
NAPB Vangard 2805 2363 983 818 1660 8629 8833 8560 6015 8010
Mean of Test 2935 2651 1064 841 1763 9254 9015 8291 6580 8282
L.S.D. Waller-Duncan
731~1 9571:./ 10131/
K - 100 ratio 1053 494 258 289 N.S. 1389 390
l/Average of five replications. *Experimenta1s
l/Fisher analysis 0 L.S.D.
Seeded September 29, 1975 at 20 1bs/acre on Cecil clay loam soil. Fertilized (lbs/A) at seeding: 50 N, 100 P205' 100 K20 and 4 Boron.
Maintenance (lbs/A): March 11, 1977 - 72 P205, 216 K20 and 2 Boron; 1976 - 4000 lime.
March 16, 1978 - 68 P205' 203 K20 and 2 Boron. March 1979 - 80 P205' 160 K20 and 2 Boron. February 19, 1980 - 157 P205, 182 K20 and 1020 lime.
Weed Control: April 4, 1978 - .75 lbs/A (A.I.) 2,4-DB. February 27, 1978 - .S lb/A (A.I.) Sencor. April 1979 - 1.5 (A. I.) 2,4-DB. February 27, 1980 + O.S lb. Sencor (A.I.)
Table 17. FVT 141 Dry matter yields of alfalfa on the Piedmont Research Station in Rowan County , N. C.
Pounds Per Acre Dry ForagJ/
Four
variety!:.}
Harvest Dates, 1980 1980 1979 1978 1977 Year
Brand 5/14 6/10 7/11 8/14 9/22 Total Total Total Total Average
NAPB Apollo 4284 2633 1885 1033 782 10616 12198 10910 3761 9371
WL WI.. 311 3498 2390 1553 1095 805 9340 11829 10583 3375 8782
WI.. WI.. 318 3179 2284 1580 1084 930 9057 12351 10375 3523 8827
Saranac-AR 3438 2439 1408 813 858 8956 11771 10704 3433 8716
Williamsburg 3233 2146 1492 1272 791 8934 10805 9424 3215 8095
NK Phytor 3186 2278 1494 910 654 8522 10628 9786 3705 8160
FFR l-leev1chek 3295 2023 1253 668 832 8071 10465 9946 3543 8031
Arc 3300 2371 1194 602 484 7951 9209 9085 3269 7379
NK Thor 2947 2071 1442 811 651 7921 10705 9491 3541 7915
Victoria 3129 2145 1223 621 444 7563 11230 10049 3477 8080
NK Gladiator 3044 1742 1203 738 475 7203 9646 10003 3754 7652
NAPB Vangard 2810 1693 1191 762 666 7122 10559 9967 2094 7638
WI.. WL 512 2481 1929 1249 725 612 6997 8803 7609 1445 6214 N
Team 2797 1826 1144 601 590 6959 7910 7507 3045 6355 -..J
Agate 2738 1654 1178 642 569 6782 9865 8737 2765 7037
Liberty 2996 1688 1062 474 504 6725 7680 8231 2595 6308
Spreador 1873 1104 668 289 297 4231 5931 5081 1866 4277
Mean of Test 3072 2025 1307 1ll 644 7821 10093 9264 3136 12J!i
L. S. D. Waller-Duncan
1274]'/ 14441/ 549]'/
K-Ratio 100 671 428 292 310 289 1266 554
l/Average of six replications.
l/Varieties Phytor, Vangard and Liberty formerly reported as K3-15, Victor and NCW20 respectively. 1/Fisher analysis - L.S.D.
Seeded September 1, 1976 at: 20 1bs/A on a Lloyd clay loam. Soil test report at seeding: P
205- 41 Ibs/A, K20 - 256 1bs/A, pH - 6.2 and organic matter - 0.6%. Fertilizer (lbs/A) at seeding: 40 N, 120 P
205, 120 K20 and 2000 lime. Maintenance (lbs/A): March 20, 1978 - 68 P205, 203 K20, 2 Boron.
March 14, 1979 - 165 P205, 50 K20, 2 Boron. February 12, 1980 - 139 P
20 , 189 K20, 2 Boron.
Weed Control (lbs/A): March 20,1978 - .75
(A.I.~
2,4-DB, spot spray for curled dock. April 5, 1978 - .75 (A.I.) 2,4-DBFebruary 6, 1979 - 1.0 (A.I.) Kerb, .50 (A.I.) Sencor May 14, 1980 - 1.0 (A.1.) Surf1an
Insect Control (lbs/A): No insect control in 1977. April 5, 1978 - .5 (A.I.) Furadan
Table 18 .. FVT 162 Dry matter yields of alfalfa at the Upper Piedmont Research Station in Rockingham County.
Pounds Per Acre Dry Forage
Yie1d~/
Harvest Dates, 1980 Three
1980 1979 1978 Year
Brand Variety 5/12 6/11 7/10 8/7 9/19 Total Total Total Average
Liberty 4872 3592 2132 1608 984 13189 16340 14171 14567
WI.. 311 4086 3397 2253 2173 976 12886 15186 15991 14688
Saranac AR 4326 3414 2137 1748 875 12500 15123 13827 13817
Arc 4728 3202 2061 1768 731 12489 15811 14284 14195
NAPB Apollo 4235 3342 2127 1604 872 12181 14877 15463 14174
WI.. 318 3736 3072 2332 2062 963 12164 15389 15307 14287
FFR Weev1chek 3826 3117 2086 1792 80R 11629 13656 14892 13392
NAPB Vangard 4277 3024 1989 1425 865 11581 16199 15768 14516 N
00
Mean of Test 4261 3270 2140 1772 884 12327 15323 14963 14205
-L.S.D. Waller-Duncan
1587
1 /
14111
.1
K - 100 ratio 774 398 N.S. N.S. N.S. 1897 910
1/A f fi 1 . .
- verage 0 lve rep lcatlons.
~/Fisher
analysis - L.S.D.Seeded August 20, 1977 at: 20 1bs/acre on an Appling fine sandy loam soil. Soil test report at seeding: 277 - P205, 125 - K
20, pH - 5.7 and organic matter Fertilizer (lbs/A) at seeding: 45 P
20 , 135 K20, 3 Boron and 2000 lime. Maintenance (lbs/A): March 12,1979 _5 75 P
20 , 150 K20, 2 Boron. February 21, 1980 - 68
~205'
205 K20 and 1025 lime. Weed Control (lbs/A): January 30,1979 - 1 (A.I.) Kerb, .50 (A.I.) SencorMarch 10, 1980 - .50 (A. I.) Sencor Insect Control (lbs/A): April 2, 1979 - 0.5 (A.I.) Furadan
April 4, 1980 - 0.5 (A. I.) Furadan
29
Table 19. FVT 169 Dry matter yields of red clover on the McNair Farms in Scotland County.
Pounds Per Acre Dry Forage Yields
1 /
Two
Harvest Dates, 1980 1980 1979 Year
Brand Variety 4/3 6/2 6/30 Total Total Average
Chesapeake 5868 2678 885 9430 6409 7920
FFR Redman 5532 2216 730 8479 6431 7455
NK *78023 5462 1927 904 8292 5496 6894
NK *78001 5092 2159 905 8157 5631 6894
NAPB Redland 5248 2087 813 8149 5931 7040
NK *78042 5212 1852 817 7881 5740 6811
Mean of Test 5403 2153 842 8398 5940 7168
L.S.D. Waller-Duncan
632
1/
K - 100 ratio 775 688 N.S. 261 441
l/Average of five replications. *Experimentals l/Fisher analysis - L.S.D.
Seeded September 12, 1978 at 20 lbs/acre on a Marlboro Sandy loam. Soil test report at seeding: P
205 - 408 + lbs/acre, K20 - 188 lbs/acre, pH-6, and organic matter - 0.6% Fertilized (lbs/A) at seeding: 68 P20S' 203 K20 and 3 Boron. Maintenance (lbs/A): September 27,1979 - 60 K
20.
February 10, 1980 - 204 K
°
and 3.4 Boron. Weed Control (lbs/A): December 7,1978 - 1 (A.t.) Kerb.30
Table 20. FVT 161 Dry matter yields of red clover at the Upper Piedmont Research Station in Rockingham County.
Pounds Per Acre Dry Forage
Yie1d~/
Harvest Dates, 1980 Three
1980 1979 1978 Year
Brand Variety 5/12 6/4 7/10 Total Total Total Average
Kenstar 1179 2089 1099 4367 13506 12948 10274
Ken1and 1195 2071 783 4049 12378 15032 10486
.NK F10rie 765 1991 615 3371 10849 12147 8789
NAPB Red1and 840 1876 528 3244 12819 13217 9760
FFR Redman 791 1652 500 2943 11069 12486 8833
Chesapeake 381 1332 37 1750 11673 13185 8869
Mean of Test 859 1835 594 3287 12049 13169 9502
L.S.D. Waller-Duncan
9851/ 13891)
K - 100 ratio 308 510 505 810 513
l/Average of five replications. ~/Fisheranalysis - L.S.D.
Seeded August 31, 1977 at: 15 1bs/acre on an Appling fine sandy loam soil. Fertilized at seeding (lbs/A): 45 P
205, 135 K20 and 2000 lime. Maintenance (lbs/A): March 12, 1979 - 75 P20 ,150 K20
February 21, 1980 - 55
~205'
165 KTable 21. FVT 160 Dry matter yields of 1adino clover on the Upper Piedmont Research Station in Rockingham County.
1/ Pounds Per Acre Dry Forage
Yields-Harvest Dates 1980 1980 1979 1978 ThreeYear
Brand Variety 4/23 5/12 6/4 7/10 8/7 Total Total Total Average
Tillman 1603 1097 1540 675 971 5885 7992 9704 7860
Lucky 1608 1214 1517 585 766 5690 7572 9812 7691
Regal 1519 989 1631 651 853 5643 8354 10968 8322
NK Arcadia 1575 1018 1571 584 890 5638 7800 9695 7711
ASC Tamar 1761 1015 1425 452 573 5227 7637 7375 6746
Berger &Plate Sacramento 1303 1064 1510 520 637 5034 7342 8922 7099
Mean of Test 1562 1066 1532 578 782 5519 7783 9413 7571 w
- - - - -
- -
- -
- -
-
-
- -
- -
- -
- -
I-'L.S.D. Waller-Duncan
5441 / 10081 /
K - 100 ratio N.S. N.S. 183 N.S. 421 787 522
!/Average of five replications.
~/Fisher
analysis - L.S.D.Seeded September 1, 1977 at SIbs/acre adjusted to 100% P.L.S. on an Appling fine sandy loam soil. Fertilized at seeding (lbs/A): 45 P205, 135 K20 and 2000 lime.
Maintenance (lbs/A): March 12, 1979 - 75 P
205, 150 K20.
32
Table 22. FVT 167 Dry forage yields of Orchardgrass on the Upper Piedmont Research Station in Rockingham County.
Pounds Per Acre Dry Forage
Yield~/
Harvest Dates 1980 1980 1979 Two
Year
Brand Variety 4/23 5/12 6/11 10/22 Total Total Average
FFR Hallmark 2807 648 735 1955 6144 5744 5944
Boone 2874 585 685 1832 5975 5038 5506
*
OG-65G 2737 585 655 1541 5518 4613 5065NK Saborto 2582 556 748 1240 5127 3437 4282
NK Orbit 2453 585 539 1519 5097 4412 4754
Pickseed Ina 2333 589 720 1429 5071 4540 4805
FFR Able 1807 636 691 1646 4779 3968 4373
NK
*
K8:-122 1917 513 723 1505 4658 3891 4274NK
*
K2-8 2129 407 639 1353 4528 4109 4318Pickseed Kay 1874 460 695 1261 4289 3760 4024
Mean of Test 2351 556 683 1528 5119 4351 4734
-L.S.D. Waller-Duncan
390
1/
K - 100 Ratio 287 154 207 609 679 10.48
*
Experimentall/Average of five replications.
~/Fisher
analysis - L.S.D. (.05)Seeded 'September 8, 1978 at 20 1bs/acre on an Appling fine sandy loam soil. Fertilized (lbs/A) at seeding: 28 N, 56 P
205 and 84 K20 Maintenance (lbs/A): March 12, 1979 - 75 N, 50 P
205 and 100 K20. August 23, 1979 - 75 N
February 21, 1980 - 105 N, 85 P
205 and 85 K20 August 27, 1980 - 75 N
Table 23. FVT 153 Dry matter yields of tall fescue on the Upper Piedmont Research Station in Rockingham County.
Pounds Per Acre Dry Forage
Yie1d~/
Harvest Dates, 1980 1980 1979 1978 ThreeYear
Brand Variety 4/23 5/12 6/11 10/22 Total Total Total Average
FFR Forager'1=/ 5785 750 1049 2799 10383 12149 12122 11551
FFR *Syn. D 5481 819 1164 2680 10144 10728 9449 10107
*II-I 4652 783 1084 2972 9492 10710 10224 10142
Ky. 31 4430 842 1055 3017 9344 10427 10541 10104
*NAPB *TF 0070 4186 842 1045 2914 8987 10836 12031 10618
Kenhy 3743 718 1003 3030 8494 9739 11074 9769
*H-2 3628 714 1040 2638 8019 9468 9389 8959
Missouri 96 3374 746 983 2636 7739 7970 8752 8154 ww
Pickseed Fe10pa 3607 462 786 1026 5880 5985 9197 7021
*Berger & Plate *B-2 Festu101ium 2635 503 682 1308 5128 6434 9876 7146
*NK *K2-28 1567 310 380 995 3252 4460 6653 4788
Mean of Test 3917 681 934 2365 7897 8991 9938 8942
-L.S.D. Waller-Duncan
1716
1/
19491/
K - 100 ratio 1469 208 411 815 2017 727
l/Average of five replications. * Experimental 2/
- Formerly reported as FFR Syn. I.
l/Fisher analysis - L.S.D.
Seeded September 15, 1977 at 20 1bs/acre on an Appling fine sandy loam soil. Fertilized at seeding (lbs/A): 50 N, 45 P205, 133 K20, and 2000 lime. Maintenance (lbs/A): March 22, 1978 - 75 N, July 31, 1978 - 75 N.
March 12, 1979 - 75 N, 50 P205 and 100 K O.
August 23, 1979 - 75 N, February 21, 1985 - 105 N, 85 P205 and 85 K20. August 27, 1980 - 75 N.
Table 24.
34
FVT 171 Dry matter yields of warm season perennial forages on the Upper Piedmont Research Station in Rockingham County, 1980.
Pounds Per Acre Dry Forage
Yield~/
Harvest Dates 1980Entry 6/4 7/10 8/7 9/19
*Pennisetum flaccidum 4290 2909 2604 990
Coastal Bermuda 1347 1278 3742 3210
Tifton 44 Bermuda 2059 962 3449 2941
Midland Bermuda 1574 1513 2581 2719
*Pennisetum orientale 1543 1365 2872 1269
Hean of Test 2163 1605 3049 2226
-L.S.D. Waller-Duncan
K - 100 ratio 775 953 N.S. 1428
l/Average of five replications. *Experimentals Planted June 6, 1978 on an Appling fine sandy loam soil. Fertilization (lbs/A) at planting: 50 N, 100 P
205, 160 K20 March 12, 1979 - 80 P
20 and 160 K 0 April 17, 1979 - 50 N,
~une
14, 19'9 - 50 N August 23, 1979 - 50 N.February 21, 1980 - 55 P
20 , 105 K20 and 1025 lime. April 23, 1980 - 50 N,
Jun~
4, 1980 - 50 N,July 10, 1980 - 50 N, August 7, 1980 - 50 N.
Weed Control: Burned February 21, 1980 and hand rogued to control Johnsongrass in 1980.
Total
10793 9577 9411 8387 7049 9043
Table 25.
35
FVT 159 Dry matter yields of warm season perennial forages on the Piedmont Research Station in Rowan County, 1980.
Pounds Per Acre Dry Forage Yields
11
Harvest Dates, 1980Entry 6/8 7/11 8/14 9/22 Total
*Pennisetum F1accidum 5429 3435 1126 989 10980
Coastal Bermuda 2418 2599 2629 3196 10843
Tifton 44 Bermuda 2258 1815 1881 1852 7832
*Pennisetum Orientale 2673 2335 936 954 6898
Mean of Test 3201 2546 1643 1748 9138
L.S.D. Waller-Duncan
K= 100 Ratio 974 366 450 366 1632
l/Average of five replications. *Experimenta1s Planted March 23, 1978 on a Lloyd clay loam. Fertilizer (lbs/A): February 28, 1980 - 115 P
205, 115 K20
50 N - April 16, June 12, July 11 and August 14, 1980. Weed Control: 1.5 (A. I.) 2,4-D - March 31, 1980
36
APPENDIX
List of Appendix Tables
1. Climatological Data for Edgecombe County Location
2. Climatological Data for Granville County Location
3. Climatological Data for Rockingham County Location
4.
Climatological Data for Rowan County Location5. Climatological Data for Scotland County Location
6. Climatological Data for Wake County Location
37
38 39
40
41
37
Table 26. Temperature and precipitation for Edgecombe County - 1980 (FVT 177, 180).
Temperature (oF) Departure
from long
Month Mean term mean Highest Date Lowest Date
Jan. 40.6 69 12 24 31
Feb. 37.0 78 24 9 3
Mar. 46.9 70 22 11 4
Apr. 61.0 91 24 34 17
May 68.2 90 14 38 10
June 73.4 96 17+ 49 13
July 79.8 96 20+ 59 15
Aug. 80.2 102 2 54 25
Sept. 75.5 97 3 48 28
Oct. 58.7 85 12+ 33 27
Nov. 49.2 77 10+ 25 20
Dec.
+a1so earlier date or dates.
Precipi tation (inches)
Departure No. of days with
from long Greatest in precipitation Month Total term mean 24 hours Date 0.10 in or over
Jan. 4.55 1.16 .87 12 11
Feb. 2.29 -1.58 .70 10 7
Mar. 5.22 1.33 1.15 18 10
Apr. 3.00 .01 .80 28 5
May 4.32 1.13 1.48 18 6
June 1.25 -3.33 .53 26 4
July 2.14 -3.56 .65 24 5
Aug. 2.01 -3.32 1.59 2 4
Sept. 2.74 -1.15 1.50 6 5
Oct. 4.37 1.53 1.63 25 8
Nov. 2.45
-
.72 79 25 6Table 27.
38
Temperature and precipitation for Granville County - 1980 (FVT 129).
Temperature (OF)
Departure from long
Honth Mean term mean Highest Date Lowest Date
Jan. 41.6 .9 63 11 20 24
Feb. 38.1 -4.3 77 23 10 3
Mar. 48.5
-
.9 71 29+ 12 2Apr. 61.6 1.7 93 23 34 17
May 69.1 1.1 90 29+ 36 10
June 73.9 -1.0 95 28 49 13
July 80.0 2.2 99 17+ 61 15+
Aug. 80.4 3.9 99 9+ 58 25
Sept. 75.3 4.4 95 2+ 46 28
Oct. 58.1 -2.7 83 11 32 27
Nov. 48.1 -2.7 76 8 25 20
Dec.
+a1so earlier date or dates.
Precipitation (inches)
Departure No. of days with
from long Greatest in precipitation Month Total term mean 24 hours Date 0.10 in or over
Jan. 5.88 1.18 1.00 18 9
Feb. 1.30 -2.20 .63 10 4
Mar. 5.82 2.25 1.08 21 12
Apr. 2.86
-
.25 1.22 14 7May 5.13 1.55 2.35 21 5
June 3.56
-
.77 1.50 26 5July 3.46 -1.84 1.36 23 4
Aug. 4.43 .13 2.96 20 5
Sept. 2.59
-
.89 1.01 30 4Oct. 5.11 2.40 1.53 19 6
Nov. 2.14 - .86 .70 24 6
39
Table 28. Temperature and precipitation for Rockingham County - 1980 (FVT 153, 160, 161, 162, 167, 171).
Temperature (OF) Departure
from long
Month Mean term mean Highest Date Lowest Date
Jan. 38.5 -1.6 63 16 18 10
Feb. 34.9 -6.9 74 24 9 1
Mar. 44.3 -4.7 69 30 10 2
April 58.5 - .9 89 24 30 17
May 66.2 -1.5 88 30 36 10
June 71.0 -3.7 92 29+ 49 13
July 77.3 - .4 98 17 60 1
Aug. 77.3 .7 96 10+ 57 18
Sept. 72.3 1.8 94 2 44 28+
Oct. 55.1 -5.4 81 12+ 33 26
Nov. 44.8 -5.4 76 10 20 30
Dec.
+a1so earlier date or dates.
Precipi tation (inches)
Departure No. of days with
from long Greatest in precipitation Month Total term mean 24 hours Date 0.10 in or over
Jan. 3.46 .32 .56 18 8
Feb. 1.02 -2.30 .50 10 3
Mar. 5.13 1.36 1.45 21 9
April 2.92 - .43 1.57 9 6
May 3.18 - .52 1.74 21 4
June 5.90 2.22 4.27 26 4
July 5.02 .95 1.64 11 7
Aug. 2.40 -1.52 .68 2 5
Sept. 1.65 -2.25 1.00 25 4
Oct. 3.17 .07 1.04 1 5
Nov. 2.63