High Dimensional Data used in Consensus Neighbour Clustering with
Fuzzy Based K-Means and Kernel Mapping
1M.Mohanapriya, 2 Dr. Antony Selvadoss Thanamani,
1M.Phil. Research Scholar, Dept. of Computer Science, NGM College, Pollachi, Tamilnadu India
2Assistant Professor and Head, Dept. of Computer Science, NGM College, Pollachi, Tamilnadu, India
ABSTRACT: Clustering is the application of data mining techniques to discover patterns from the datasets. This research entitled “fuzzy based k-means and kernel mappings with consensus neighbouring clustering in high dimensional data” incorporates clustering concept, which is the process of deriving the information the similarity from the unsupervised dataset. Finding the outlier data points that are similar to a training data is challenging task in current trend. To discover the cluster ensemble or clustering aggregation, have more frequent change in the similarity information, which involves raw data points linked to one another and elimination of outlier information. This research presents a framework for discovering data membership from unsupervised high dimensional datasets. By aligning the similar groups from the datasets and by using distance sequence or its weighting of match, the similarities between the data points are determined.
KEYWORDS: K-means Algorithm, consensus clustering, kernel mapping, and consensus neighbour clustering.
IINTRODUCTION
The key to success of the clustering analysis and to obtain the better quality of clustering results, the clustering optimization is done based on the objective function. The Following are the requirements to meet the analysis. The distance between clusters and the data points assigned to them should be minimized and the distance between clusters
should to be maximized. To classify a data point, cluster centroid has to be closest to the data point of membership for estimating the Centroids; typicality is used for alleviating the undesirable effect of outliers. The kernel mapping
function is composed of two expressions: The K-means algorithm represented by their centroids, e.g., the arithmetic means of data points in the respective clusters. The Consensus Clustering algorithm for outlier detection in real-world applications unsupervised data. The first is the Kernel mapping function and a use a distance exponent, the second is Consensus-neighbour clustering function and uses a typical kernel weighting exponent; but the two coefficients in the objective function are only used as exhibitor of membership and typicality.
II RELATED WORK
on minimizing an appropriately formulated objective function, and different formulations suggest different possible algorithms.A. Banerjee, S. Merugu, I. Dhillon, and J. G proposed a wide variety of distortion functions, such as squared Euclidean distance, Mahalanobis distance, Itakura-Saito distance and relative entropy, have been used for clustering.A. Banerjee, X. Guo, and H. Wang, authors considered the problem of predicting a random variable X from observations, denoted by a random variable Z. J. Wu, H. Xiong, C. Liu, and J. Chen, proposed the Fuzzy c-means (FCM) is a widely used fuzzy clustering method, which allows an object to belong to two or more clusters with a membership grade between zero and one. J. Wu, H. Xiong, and J. Chen proposed the Clustering validation is a long standing challenge in the clustering literature. While many validation measures have been developed for evaluating the performance of clustering algorithms, these measures often provide inconsistent information about the clustering performance and the best suitable measures to use in practice remain unknown
IIIPROPOSED ALGORITHM (A) K – means Clustering
A well-known general clustering procedure is the k-means algorithm. This is most often implemented with the Euclidean distance. Given a set of cluster representatives, in the first step each point is assigned to its closest representative. The second step updates the cluster representatives by setting them equal to the mean of the data vectors assigned to them in the previous step. The k-means algorithm is optimal for clustering dense, spherically shaped and linearly separable clusters. Figure:1 a show an example of such a situation, and the k-means algorithm can be expected to give good clustering results.
Figure: 1 Two datasets.
Figure 3.1 K Means Clustering Algorithm
K-means is one of the simplest unsupervised learning algorithms that solve the well-known clustering problem. The
procedure follows a simple and easy way to classify a given data set through a certain number of clusters (assume k
clusters) fixed a priori. The main idea is to define k centroid, one for each cluster. These centroids should be placed in a
cunning way because of different location causes different result. So, the better choice is to place them as much as possible far away from each other. The next step is to take each point belonging to a given data set and associate it to the nearest centroid.
(B) Consensus clustering
Tremendous research efforts have been devoted to consensus clustering. These existing studies can be roughly divided into two categories: CC with implicit objectives (CCIO) and CC with explicit objectives (CCEO).
A large part of the literature on high dimensional cluster has been devoted to the design of suitable clustering representations.
The three graph-based algorithms for CC. Although an objective function was defined on the normalized
mutual information measure.
The information of basic partitioning into a co-association matrix, based on which the agglomerative
hierarchical clustering was used to find the final clustering.
An objective function based on the category utility function for consensus clustering, and used K-means
clustering to find the solution.
The expectation-maximization algorithm with a finite mixture of multinomial distributions for consensus
clustering.
(C) Fuzzy based consensus clustering
High dimensional data clustering arises naturally in a lot of domains, and have regularly presented a great deal with for usual data mining techniques. Clustering becomes difficult due to the increasing sparsity of such data, as well as the increasing difficulty in distinguishing distances between data points. It has been widely recognized that consensus clustering can help to generate robust clustering results, find bizarre clusters, handle noise, outliers and sample variations, and integrate solutions from multiple distributed sources of data or attributes. In this paper, presents an optimal perspective on the problem of Consensus Clustering in high-dimensional data. The proposed method called “Fuzzy based k-means and kernel mappings with Consensus Neighbouring clustering in high dimensional data , which takes as key measures of correspondence between pairs of data points. The proposed method is to establish a unified framework for FKCNCHD on both supervised and unsupervised data sets. Also, we examine some important factors, such as the clustering quality and assortment of basic partitioning, which may affect the performances of FKCNCHD. Experimental results on various synthetic and real world data sets demonstrate that FKCNCHD is highly efficient and
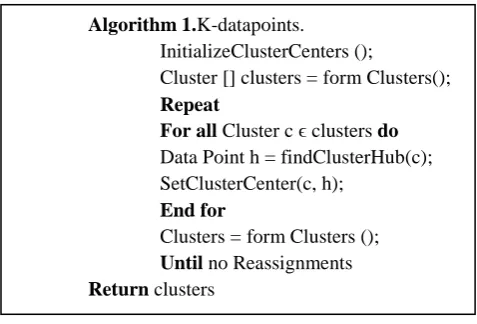
Algorithm 1.K-datapoints.
InitializeClusterCenters ();
Cluster [] clusters = form Clusters();
Repeat
For all Cluster c ϵ clusters do
Data Point h = findClusterHub(c); SetClusterCenter(c, h);
End for
Clusters = form Clusters ();
Until no Reassignments
is equivalent to the state-of-the-art methods in terms of clustering index quality. In addition, FKCNCHD shows high robustness to incomplete basic partitioning with many anomaly values.
(D) Advantages of fuzzy based consensus clustering
The Consensus Neighbour clustering algorithm is easy to implement and provides soft-clustering results that are
immune to irrelevant, redundant, ineffective and unreliable features or kernels.
The advantages of this method are its straightforward implementation; it’s fairly robust behavior and its
applicability to multichannel data and the ability of un-certainty data modeling.
The cluster initialization is based on a small number of points at each iteration and a one-class is trained on each
cluster to obtain spheres.
The observation indeed implies that the normalized measures tend to give more robust right measure to
relationships among these validation measures.
A large number of dimensions of the data structure of running time are essentially determined in advance. All
these properties make fuzzification is a suitable candidate for the real-time systems.
The kernel mappings simultaneously considers all data points as potential prototypes and passes soft information
around until a subset of data points and become the patterns.
The Consensus-neighbour clustering can be viewed as performing model selection and for the selected model,
performing MAP estimation of the
cluster centers and the assignments of data points to centers.
Clustering by Passing Messages between the data points has some advantages: speed, general applicability, and
suitable for large number of clusters.
Kernel methods, the key to success are the formation of a suitable kernel function. However, a single kernel that
is selected from a predefined group is sometimes insufficient to represent the data.
(E) Kernel Mapping Connectivity
The degree of branching can be specified with a kernel k that is directly applied to the similarity matrix. It is
shown that the generated clusters can still be monotonic depending on the used linkage measure even though the induced dissimilarity measures are no longer ultra-metrics. Using the pair-wise merged clusters; an additional shrinking process is proposed to generate topic related groups with more than two cluster elements.
The process of determining the degree to which a value belongs in a kernel set
The value returned by a shared-Neighbour cluster
Most variables in a hub-based system have multiple data points attached to them
Kernel mapping that variable involves passing the crisp value through each neighbour attached to that
value.
Here dataset is an object matrix. Clusters are groups of similar data elements. Resemblance coefficient represents the degree of similarity and non-similarity between the items. The main aim of clustering analysis is identify and quantification of these architecture elements. Identifying the membership and location Center of the clusters is main process in the cluster analysis. Sometime data in the cluster is well packed. But due to the complex nature of the components the data may not be packed well in the clusters. Some of the elements lie outside the cluster region.
The results for both parts of the data set are given in Table 2. Fuzzy based k-means and kernel mappings with
Consensus Neighbouring clustering in high dimensional data (FKCNCHD) clearly outperformed: CSPA, HGPA and
MCLA and other methods. This shows that hubs can serve as good cluster center prototypes. On the other hand, hyper spherical methods have their limits and kernel K-means achieved the best overall cluster quality on this data set. Only one quality estimate is given for HGPA, as it automatically determines the number of clusters on its own.
(F) Consensus-Neighbour clustering Algorithm
points (to pattern). Sum of responsibilities and availabilities for data points identify the cluster patterns.The high-dimensional data point availabilities A (i, k) are zero: A (i, k) = 0, R (i, k) is set to the input similarity between point i
and point k as its pattern, minus the largest of the similarities between point i and other candidate patterns.
(G)Allocation of Data Memberships and Cluster Space
This approach computes two kinds of messages exchanged between data points. The first one is called “responsibility” r(i, j): it is sent from data point i to candidate exemplar point j and it reflects the accumulated evidence for how well-suited point j is to serve as the exemplar for point i. The second message is called “availability” a(i, j) it is sent from candidate exemplar point j to point i and it reflects the accumulated evidence for how appropriate it would be for point i to choose point j as its exemplar. At the beginning, the availabilities are initialized to zero: a (i, j) = 0. The update equations for r (i, j) and a (i, j) are written as
𝑟 𝑖, 𝑗 = 𝑠 𝑖, 𝑗 − max𝑗′≠𝑗{𝑎 𝑖, 𝑗′ + 𝑠 𝑖, 𝑗′ } (1)
𝑎 𝑖, 𝑗 = min{0, 𝑟 𝑗, 𝑗 + max 0, 𝑟 𝑖
′, 𝑗
𝑖′≠𝑖,𝑗 , 𝑖 ≠ 𝑗
max{0, 𝑟 𝑖′, 𝑗 }
𝑖′≠𝑖 , 𝑖 = 𝑗
(2)
In addition, during each message’s exchange between data points, a damping factor is added to avoid numerical oscillations that may arise in some circumstances.
IV SIMULATION RESULT
Three types of consensus clustering methods, namely the K-means-based algorithm, the graph partitioning algorithm (GP), and the hierarchical algorithm (HCC), were employed for the comparison purpose. GP is actually a general concept of three benchmark algorithms: CSPA, HGPA and MCLA which were coded in Mat lab and provided by Streh. HCC is essentially an agglomerative hierarchical clustering algorithm based on the so-called co-association matrix. It was implemented by us in MATLAB following the algorithmic description in . We also implemented fuzzy
based Consensus clustering in MATLAB, which includes ten utility functions, namely Utility Category (Uc) for
particular group selection, Utility Shannon Entropy (UH) for performing predictable data points, Utility Cosine
similarity (Ucos) for calculating similarity function for measure of the difference between probability distributions and
their corresponding normalized versions (denoted as NUh). To generate basic partitioning, we used the kmeans function
of MATLAB with squared Euclidean distance for UCI data sets and with cosine similarity for text data sets. Two strategies, i.e., random parameter selection (RPS) and random feature selection (RFS) proposed in , were used to generate BPs. For RPS, we randomized the number of clusters within an interval for each basic clustering. For RFS, we randomly selected partial features for each basic clustering.
The Rand index or Rand measure in statistics, and in particular in data clustering, is a measure of the similarity between two data clusterings. A form of the Rand index may be defined that is adjusted for the chance grouping of elements; this is the adjusted Rand index.
𝑅𝑛=
𝑎 + 𝑏 𝑎 + 𝑏 + 𝑐 + 𝑑=
𝑎 + 𝑏 𝑛 2
Given a set of n elements S = {o1, …, on} and two partitions of S to compare, X = {X1, …, Xr}, a partition of S into r
subsets, and Y = {Y1, …, Ys}, a partition of S into s subsets, define the following:
a, the number of pairs of elements in S that are in the same set in X and in the same set in Y
b, the number of pairs of elements in S that are in different sets in X and in different sets in Y
c, the number of pairs of elements in S that are in the same set in X and in different sets in Y
The clustering quality in these experiments was measured by quality indices, the Rand index, which measures a percentage of k-neighbour points that are clustered together. In the first experimental setup, the UCI machine learning data set (https://archive.ics.uci.edu/ml/datasets.html) was used for evaluation. Each part consists of 4,601 instances having 57 dimensions. Results were compared for various predefined numbers of clusters in algorithm calls. Each algorithm was tested 50 times for each number of clusters. Neighbourhood size was 2 to 16.
Table 1: Some Characteristics of Real-World Data Sets
Table 1 mappings with Consensus Neighbouring clustering in high dimensional data (FKCNCHD) clearly
outperformed: CSPA, HGPA and MCLA and other methods. This shows that hubs can serve as good cluster center prototypes. On the other hand, hyper spherical methods have their limits and kernel K-means achieved the best overall cluster quality on this data set.
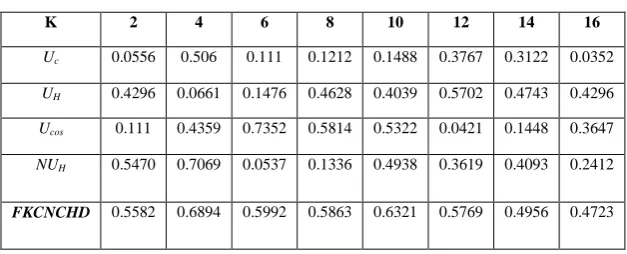
Table 2: Clustering Quality on the UCI machine learning datasets K 2 4 6 8 10 12 14 16
Uc 0.0556 0.506 0.111 0.1212 0.1488 0.3767 0.3122 0.0352
UH 0.4296 0.0661 0.1476 0.4628 0.4039 0.5702 0.4743 0.4296
Ucos 0.111 0.4359 0.7352 0.5814 0.5322 0.0421 0.1448 0.3647
NUH 0.5470 0.7069 0.0537 0.1336 0.4938 0.3619 0.4093 0.2412
FKCNCHD 0.5582 0.6894 0.5992 0.5863 0.6321 0.5769 0.4956 0.4723
On the other hand, hyper spherical methods have their limits and kernel K-means achieved the best overall cluster quality on this data set. Only one quality estimate is given for HGPA, as it automatically determines the number of clusters on its own.
Datasets Source #Objects #Attributes #Classes CV
Iris UCI 150 4 3 0.000
Pendigits UCI 10992 16 10 0.042
Wine UCI 178 13 3 0.194
Ecoli UCI 332 7 6 0.889
Figure1: Clustering quality data set
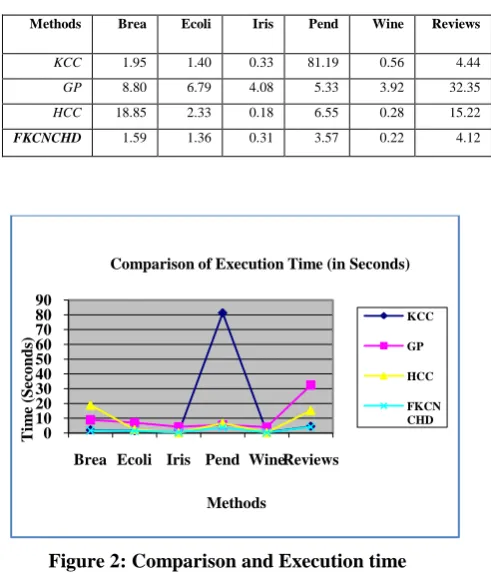
Table 3 shows the runtime comparison of the three methods, where the fastest one is in bold for each data set.
Table 3: Comparison of Execution Time (in Seconds)
Figure 2: Comparison and Execution time
As mostly low-to-medium data (with the exception of spam base), research work have taken several UCI data sets (archive.ics.uci.edu/ml/datasets.html). Values of all the individual features in the data sets were normalized prior to testing. The data sets were mostly simple, composed only of a few clusters. The value of k was set to 20. The results are shown in the first parts of Table 3.
0 0.1 0.2 0.3 0.4 0.5 0.6 0.7 0.8
2 4 6 8 10 12 14 16
R
and
Inde
x
K - Space Value Clustering Quality on the UCI machine
learning datasets Uc UH Ucos NUH FKCNCHD 0 10 20 30 40 50 60 70 80 90
Brea Ecoli Iris Pend WineReviews
T im e (S ec o n d s) Methods
Comparison of Execution Time (in Seconds)
KCC
GP
HCC
FKCN CHD
Methods Brea Ecoli Iris Pend Wine Reviews
KCC 1.95 1.40 0.33 81.19 0.56 4.44
GP 8.80 6.79 4.08 5.33 3.92 32.35
HCC 18.85 2.33 0.18 6.55 0.28 15.22
IVCONCLUSION AND FUTURE WORK
In this paper work shown that using fuzzy based kernel mapping to approximate local data centers is not only a feasible option, but also frequently leads to improvement over the centroid-based approach. the proposed the fuzzy based k-means and kernel mappings with consensus neighbouring clustering in high dimensional data algorithm for the consensus clustering algorithm is in core variations of fuzzy based consensus neighbouring clustering algorithm using different weight measures applied to the vector of base-level clustering’s baseline on both synthetic and real-world data, as well as in the presence of high levels of artificially introduced noise. The kernel map with consensus neighbour clustering can easily be extended to incorporate additional pair-wise constrains such as requiring points with the same label to come into view in the same cluster with just an extra layer of function hubs. A further challenge is to identify scenarios where the use of soft ensembles provides significantly improved performance over hard ensembles, and if needed devise specialized algorithms to deal with various domains such as medical domains.
REFERENCES
1. Goder and V. Filkov, “Consensus clustering algorithms: Comparisonand refinement,” in Proc. SIAM Workshop Algorithm Eng.Exp., 2008, pp.
109–117.
2. B. Mirkin, “Reinterpreting the category utility function,” Mach.Learn., vol. 45, no. 2, pp. 219–228, Nov. 2001.
3. A. Topchy, A. Jain, and W. Punch, “A mixture model for clusterin ensembles,” in Proc. SIAM Int. Conf. Data Mining, 2004, pp. 379–390.
4. S. Vega-Pons, J. Correa-Morris, and J. Ruiz-Shulcloper, “Weighted partition consensus via kernels,” Pattern Recog., vol. 43, no. 8, pp. 2712–
2724, 2010.
5. H. Luo, F. Jing, and X. Xie, “Combining multiple clusterings using information theory based genetic algorithm,” in Proc. Int. Conf.
Comput.Intell. Security, 2006, vol. 1, pp. 84–89.
6. T. Li, M. M. Ogihara, and S. Ma, “On combining multiple clusterings: an overview and a new perspective,” Appl. Intell., vol. 32, no. 2, pp.
207–219, 2010.
7. Teboulle, “A unified continuous optimization framework for center-based clustering methods,” J. Mach. Learn. Res., vol. 8, pp. 65–102, 2007.
8. A. Banerjee, S. Merugu, I. Dhillon, and J. Ghosh, “Clustering with bregman divergences,” J. Mach. Learn.Res., vol. 6, pp. 1705–1749, 2005.
9. A. Banerjee, X. Guo, and H. Wang, “On the optimality of conditional expectation as a bregman predictor,” IEEE Trans. Inform. Theory, vol.
51, no. 7, pp. 2664–2669, 2005.
10. J. Wu, H. Xiong, C. Liu, and J. Chen, “A generalization of distance functions for fuzzy c-means clustering with centroids of arithmetic means,”
IEEE Trans. Fuzzy Syst., vol. 20, no. 3, pp. 557–571, Jun. 2012.
11. J. Wu, H. Xiong, and J. Chen, “Adapting the right measures for k-means clustering,” in Proc. 15th ACM SIGKDD Int. Conf. Knowl. Disc. Data