Comparison of Different Methods in
Estimating Weibull Distribution Parameters
for Wind Power Application
Yusuf Alper KAPLAN1,* Canan ALADAĞ2
Assistant Professor, Department of Energy Engineering, Osmaniye Korkut Ata University, Osmaniye Turkey1
Research Assistant, Department of Energy Engineering, Osmaniye Korkut Ata University, Osmaniye, Turkey2
ABSTRACT: In recent years, there has been an increasing demand for energy due to the population growth and decline in fossil energy resources as well as the developing technology. Thus, there has been a recent tendency towards exploring new energy resources. In this study, the wind energy potential in Hatay was analyzed statistically based on the data regarding the wind speed measured hourly between 2009 and 2013. The wind speed distribution in the turbine location plays an important role besides wind turbine parameters in order to produce wind electricity. Weibull distribution was used in the research to reveal the local wind energy potential. Weibull parameters the c and k values were estimated analytically, and the mean wind speed and energy potential were determined based on these parameters. This study introduced the evaluation of different numerical methods which are used in calculating the Weibull parameters, namely Graphical Method (GM), Standard Deviation Method (SDM), Maximum Likelihood Method (MLM), Energy Pattern Method (EPM), Energy Trend Method (ETM) and Moment Method (MM).
KEYWORDS: Weibull Distribution, Numerical Methods, Wind Potential, Comparative Analysis.
I. INTRODUCTION
generally used to assessment of wind energy potential. The Weibull distribution has two parameters which are dimensionless shape ‘k’ and scale ‘c’ parameters.
II. WINDDATAANALYSESOFHATAYREGION
A precise determination of probability distribution for wind speed data is the most important step in statistically evaluating wind speed and wind energy potential of a region. In this study, wind characteristic and wind energy potential that is located in the Mediterranean coastal city Hatay of Turkey where is shown in Figure 1, are analyzed using the annual average wind speed data of Turkish State Meteorological Service measured at 10 m height.
Fig. 1. Location of Hatay on the map
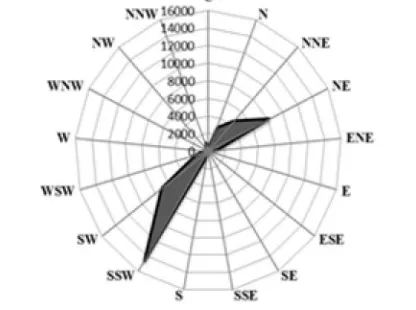
This study aims to determine the wind energy potential in Hatay. We have collected the five years data of the wind speed measured at 10-meter height from the General Directorate of State Meteorology. Based on the hourly-measured wind speed data, we have statistically analyzed the region’s wind energy potential. We have used actual datas and different type of numerical method to determine the Weibull Distribution parameters. Figure 2 shows the density of wind directions according to wind frequency. It is clearly seen that the dominant wind direction is SSW direction.
II.I Wind Power Calculation
Firstly it is necessary to determine wind power potential in order to benefit from wind energy. Recently, studies are ongoing worldwide on Weibull Distribution Function. The obtained results show that this method is most reliable method for wind energy estimation. Wind power is expressed as [5].
(1)
As it has been seen, wind speed is the most important input in order to determine the power potential [11].
II.II Statistical Analysis
There are many distribution functions to evaluate wind speed distribution and wind energy potential. Two-parameter Weibull and Rayleigh distribution functions are the most popular of all. Hourly wind speed and wind direction details are observed in a place and statistical results are calculated for modelling the frequency and probability of the obtained results [7, 13]. First, as is seen in Table 1, the periodical frequency (the blowing number) and probability of wind speed are determined. Wind speeds are grouped periodically in the second column of Table 1. The third column shows average wind speed for each speed ratio. The blowing number or frequency of each speed ratio is given in the fourth column [12].
1 ( ) i
i N
i i
f p v
f
(2)
Here, fi is frequency of occurrence of each speed class and N is number of hours in the period of time considered. P(vi) is the cumulated probability density which is illustrated in the sixth column of the Table 1.
Nomenclature
A Swept Area of Wind [m2]
c Weibull scale factor [m/s]
FW(v) Weibull cumulative distribution function
fW(v) Weibull probability density function
Γ Gamma function
k Weibull shape factor
n Total data number
PW Mean power density of Weibull [W/m2]
Pm Mean power density of Real[ W/m2]
Air density [kg/m3]v Wind speed [m/s]
vm Mean wind speed [m/s]
N Number of observation
xi i-th Weibull data
yi i-th Real data
Table 1. Periodical Frequency and Probability of Hourly Wind Speeds
The two-parameter Weibull distribution function is described for wind speed as follow Eq. (3) and as a cumulative distribution function given by Eq. (4) [14, 15]
1
( ) exp
k k
k v v
p v
c c c
(3)
( ) 1 exp
k
v P v
c
(4)
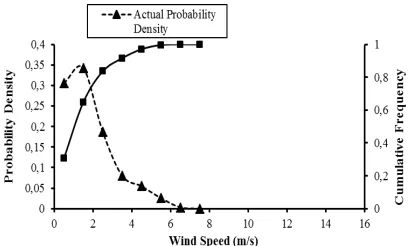
Actual probability density function and cumulative probability distributions derived from the long-term wind speed data of Hatay during 2009 to 2013 period are depicted in Figure 3.
Fig.3. The wind speed probability density and cumulative probability distributions for the year 2009 to 2013
III. DETERMINATION OF WEIBULL PARAMETERS
In practice, a variety of methods have been utilized to determine the wind energy of a region. A wind speed distribution measure or a frequency distribution is used to determine the wind energy potential of a specific region, if possible. If not, wind speed distribution can be demonstrated through other analytical distribution functions. One of
i vi (m/s) vi* (m/s) fi p(vi) P(vi)
1 0-1 0,5 13396 0,31 0,31
2 1-2 1,5 15018 0,34 0,65
3 2-3 2,5 8212 0,19 0,84
4 3-4 3,5 3525 0,08 0,92
5 4-5 4,5 2396 0,05 0,97
6 5-6 5,5 1134 0,03 1
7 6-7 6,5 137 0 1
these functions is the Weibull distribution function. This distribution is not only quite flexible and simple, but it also complies with real data [16, 17]. In the present study, six of these methods ;
Graphical Method
Standard Deviation Method
Energy Trend Method
Energy Pattern Method
Maximum Likelihood Method
Moment Method
are employed in order to characterize the wind speed data recorded for five-year period between 2009 and 2013. The Weibull distribution function, which is a three-parameter function, but for wind speed is known, it can be expressed mathematically in two parameter model.
III.I Graphic Method
The graphical method depends on the evaluation of cumulative distribution function of wind speed. Taking double logarithmic transformation of the cumulative distribution function yields Eq. 5 and Eq. 6 as follows,
ln 1- ( )
k
v
P v c
(5)
ln( ) ln( ) ln ln 1 ( )
k v k c P v (6)
Here, if we accept x = ln (v), y = ln[– ln[l – P(v)]], A = k and B = -kln(c), we can obtain a linear equation as y= Ax +B. Furthermore, we will obtain c = exp(-B/A) from B = - kln (c) [7, 19]. Table 2 shows the obtained xi and yi parameters for graphical method.
Table 2. xi and yi for Hourly Wind Speed
i vi*(m/s) f xi ln( )vi yiln[ ln[1 P v( )]]i
1 0,5 13396 -0,693 -1,00836
2 1,5 15018 0,4055 0,044175
3 2,5 8212 0,9163 0,591324
4 3,5 3525 1,2528 0,907925
5 4,5 2396 1,5041 1,262902
6 5,5 1134 1,7047 1,744859
Fig.4. xi and yi for Hourly Wind Speeds
After determining the numerical values of A and B in y= Ax+B which is shown in Figure 4, k and c parameters can be calculated as follow:
, exp B
k A c
A
(7)
III.II Standard Deviation Method
Standard Deviation Method is a method that, data distribution allows to solve the relationship between average and standard deviation values between the shape parameters using numerical methods for determining the scale of 1 to 10 and the shape parameter. Shape and scale parameters can be expressed as in Eq. 8 and Eq. 9 [10, 14].
(8)
Here Γ is Gamma function;
(9)
Here, , shows Standard deviation , average speed;
(10)
(11)
III.III Energy Pattern Method
The energy pattern method is related to the mean of wind speed. This method uses the mean of wind speed cubes and the cube of mean wind speed to calculate the energy pattern factor Epf and then the Weibull parameters [9].
(13)
(14)
III.IV Energy Trend Method
Energy tendency factor is defined as wind energy obtained by the ratio of total wind energy to the average wind speed. After calculating energy trend factor (EPF) the shape parameter (k) can be obtained by following equation [10, 22].
(15)
(16)
The scale parameter calculated as follows;
(17)
III.V Maximum Likelihood Method
The maximum likelihood estimation method is a mathematical expression recognized as a likelihood function of the wind speed data in time series format. In this method, many numerical iteration can be required to determine the k and c parameters of the Weibull function. In this method Weibull parameters k and c values are calculated by the following equation[8, 9, 20].
(18)
(19)
III.VI Moment Method
Moment method is one of the oldest method is used to determine Weibull distribution parameters. The first two moments of the Weibull density function are utilized to calculate the parameters ‘k’ and ‘c’. The calculations are based on standard deviation, average wind velocity and gamma function for parameter [10, 13].
(20)
Here Г is Gamma function;
(21)
The Weibull shape factor (k) is very important factor to know about the characteristics of the wind wave of a particular wind site. The Weibull scale factor (c) indicates the potentiality of the wind power of that site. Bigger the value of c parameter means the more potential of wind sites. The performance of five numerical methods in estimating Weibull Distribution parameters between 2009 and 2013 has been graphically compared.
IV. OBTAINED RESULTS AND DISCUSSION
IV.I Statistical Error Analysis
To determine the efficiency of the used methods and to find the best method of aforementioned methods, the following three statistical indicators were used: The root mean square error (RMSE), Analysis of variance (R2) and Mean percentage error (MPE) [20].
The root mean square error (RMSE);
(22)
Analysis of variance (R2);
(23)
Mean percentage error (MPE);
(24)
By applying the above equations the performance of the Weibull distribution function can be evaluated where the model with the lowest RMSE, MPE and R2 which gives the closest outcome to a value of “1” is a best method which gives the closest result to the actual data [21].
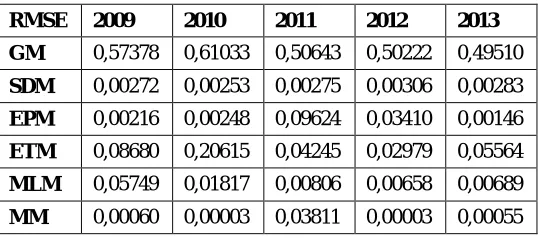
Table 3. The Annually RMSE analysis
The most accurate annually mean RMSE analysis are observed in the methods of MM because of close value of “1” for all years and the worst values GM are occurred in all years as shown in Table. 3.
It is clearly seem that RMSE analysis result; MM presents better performance than other methods in 2009, 2010, 2012 and 2013, SDM presents better performance than other methods in 2011.
RMSE 2009 2010 2011 2012 2013
GM 0,57378 0,61033 0,50643 0,50222 0,49510
SDM 0,00272 0,00253 0,00275 0,00306 0,00283
EPM 0,00216 0,00248 0,09624 0,03410 0,00146
ETM 0,08680 0,20615 0,04245 0,02979 0,05564
MLM 0,05749 0,01817 0,00806 0,00658 0,00689
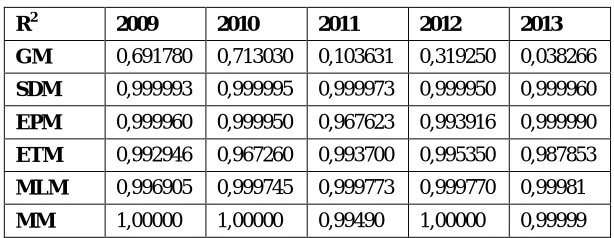
Table 4. The Annually R2 analysis
The obtained R2 results are shown in Table 4, the GM’s performance in estimating Weibull parameters is worst one and the other methods give very close results for all years. Based upon the results of R2 analysis; MM presents better performance than other methods in 2009, 2010, 2012 and 2013, SDM presents better performance than other methods in 2011.
Table 5. The Annually MPE analysis
The obtained MPE results are shown in Table 5, according to obtained results, the GM’s performance in estimating Weibull parameters is worst one and the other methods give very close results for all years. It is estimated that MPE analysis; MM presents better performance than other methods in 2009, 2010 and 2012, SDM presents better performance than other methods in 2011, EPM presents better performance than other methods in 2013.
IV.II Power Density Assessments
As known, the different between the wind energy calculated by actual time series data and by the Weibull Distribution Function data can be used as an indicator to evaluate the accuracy of used method. The average wind speed ‘Vm’ and wind power density ‘PM’ can be computed by the following equations for real time series datas [22];
(25)
(26)
Vm = 1,8515 and Pm = 11,04864 w/m2. The results are obtained from 43824 datas which are measured hourly wind speed for the year 2009 to 2013.
R2 2009 2010 2011 2012 2013
GM 0,691780 0,713030 0,103631 0,319250 0,038266
SDM 0,999993 0,999995 0,999973 0,999950 0,999960
EPM 0,999960 0,999950 0,967623 0,993916 0,999990
ETM 0,992946 0,967260 0,993700 0,995350 0,987853
MLM 0,996905 0,999745 0,999773 0,999770 0,99981
MM 1,00000 1,00000 0,99490 1,00000 0,99999
MPE 2009 2010 2011 2012 2013
GM -27,268 -27,204 -38,649 -37,707 -35,640
SDM -0,040 0,0353 -0,127 -0,180 -0,155
EPM -0,038 -0,008 2,517 0,662 -0,003
ETM 0,712 -1,209 0,811 1,291 1,413
MLM -0,954 -0,052 0,301 -0,101 -0,203
The mean wind velocities and wind power densities have also been calculated with the help of k and c parameters. The average wind speed ‘Vw’ and wind power density ‘PW’ of Weibull Distribution Function can be estimated by the following equations;
(27)
(28)
Table 6. The mean wind speed and power densities of all methods
According to the calculated power densities based on five-year data, it was found that MM, SDM, EPM, ETM and MLM provided very desirable performance while the GM gives the weak performance for all years.
V. CONCLUSIONS
For the wind tribunes to be installed in the province of Hatay, the compatibility of the wind speed with Weibull distribution function has been studied by using the measured wind speed rates that had been measured for five years between 2009 and 2013, and numerical results were presented. Results obtained through graphical method were shown for each month and year separately. In this study, wind speed data were measured at 10 m of ground clearance by the Automatic Meteorology Observation Station, which belongs to the General directorate of the Meteorology Service and is located in the centre of Hatay. From the above investigations, the all methods except GM give close results to each other. It cannot be expected that the same method has the best result for all period and for all used statistical performance tests. Considering the fact that the data used herein are about the measurements made at 10 m of ground clearance, it is understood that there is much more quality wind potential with sufficient power density at approximately 100 m of ground clearance.
REFERENCES
[1] Y. A. Kaplan, (2015). Overview Of Wind Energy In The World And Assessment of Current Wind Energy Policies in Turkey, Renewable and Sustainable Energy Reviews, Vol.43, pp. 562-568.
[2] Y. A. Kaplan, I. San, (2011). Current Situation Of Wind Energy In The World And Turkey, Green Energy Conference- VI (IGEC-VI), Eskisehir, Turkey.
[3] M. Çapika, A. O.Yılmaz, I. Çavusoglu, (2012). Present situation and potential role of renewable energy in Turkey, Renewable Energy, vol.46, pp. 1-13.
[4] M. Gabbasa, K. Sopian, Z. Yaakob, M. Zonooz, A. Fudholi, N. Asim, (2013). Review of the energy supply status for sustainable development in the Organization of Islamic Conference, Renewable and Sustainable Energy Reviews, vol. 28, pp. 18–28.
[5] J.V. Seguro, T.W. Lambert, (2000). Modern estimation of the parameters of the Weibull wind speed distribution for wind energy analysis, J Wind Eng Ind Aerod, vol. 85, pp. 75-84.
2009-2013 K c Vw Pw
GM 1,179 1,351 1,277 5,274
SDM 1,466 2,045 1,851 10,938
EPM 1,461 2,046 1,853 11,028
ETM 1,554 2,087 1,876 10,454
MLM 1,457 2,047 1,855 11,103
[6] B. Safari, J. Gasore, (2010). A statistical investigation of wind characteristics and wind energy potential based on the Weibull and Rayleigh models in Rwanda. Renewable Energy, vol. 35, pp. 2874-80.
[7] M. Bilgili ve B. Şahin, (2005). The finding of weibull parameters at the determination of Wind Power density, New and Renewable Energy / Energy Management Symposium, Kayseri, pp. 229-234.
[8] P. A. C. Rocha, R. C. D. Sousa, C. F. D. Andrade, and M. E. V. D. Silva, (2012). Comparison of seven numerical methods for determining Weibull parameters for wind energy generation in the northeast region of Brazil, Applied Energy. Vol. 89, pp. 395–400.
[9] C. F. D. Andrade, H. F. M. Neto, P. A. C. Rocha, M. E. V. D. Silva, (2014). An efficiency comparison of numerical methods for determining Weibull parameters for wind energy applications: A new approach applied to the northeast region of Brazil, Energy Conversion and Management, vol. 86 (10), pp. 801–808.
[10] T. P. Chang, (2011). Performance comparison of six numerical methods in estimating Weibull parameters for wind energy application. Applied Energy, vol. 88, pp. 272–282.
[11] M.R. Islam, R. Saidur, N.A. Rahim, (2011). Assessment of wind energy potentiality at Kudat and Labuan, Malaysia using Weibull distribution function. Energy, vol. 36 (2), pp. 985–992.
[12] F. Khahro, K. Tabbassum, A.M. Soomro, L. Dong, X. Liao, (2014). Evaluation of wind power production prospective and Weibull parameter estimation methods for Babaurband, Sindh Pakistan. Energy Conversion and Management, vol. 78, pp. 956–67.
[13] J. Kım, B. Yum, (2008). Selection Between Weibull and Lognormal Distributions: A Comparative Simulation Study Computational Statistics&Data Analysis, Vol. 53(2), pp. 477-485.
[14] S.A. Ahmet Shata, R. Hanitsch, (2006). Evaluation of wind energy potential and electricity generation on the coast of Mediterranean Sea in Egypt. Renewable Energy vol. 31, pp. 1183–202.
[15] R. Kose, M.O. Arif, O. Erbas, A. Tugcu, (2004). The analysis of wind data and wind energy potential in Kutahya, Turkey, Renewable and Sustainable Energy Reviews, vol. 8, pp. 277–288.
[16] E. C. Morgan, M. Lackner., R. M. Vogal, and L. G.Baise, (2011). Probability distributions of offshore wind speeds, Energy Conversion and Management, vol. 52, pp. 15–26.
[17] K. Mohammadi, A. Mostafaeipour, (2013), Using different methods for comprehensive study of wind turbine utilization in Zarrineh, Iran, Energy Conversion and Management, vol. 65, pp. 463-470.
[18] B. Basu, D. Tiwarı , D. Kundu, R. Prasad, (2009). Is Weibull Distribution the Most Appropriate Statistical Strength Distribution for Brittle Materials?, Ceramics International, Vol. 35 (1), pp. 237-246.
[19] M. Gokcek, A. Bayulken, S. Bekdemir, (2007). Investigation of wind characteristics and wind energy potential in Kirklareli, Turkey, Renewable Energy, vol. 32, pp. 1739–1752.
[20] A. K. Azad, M. G. Rasul, T. Yusaf, (2014). Statistical Diagnosis of the Best Weibull Methods for Wind Power Assessment for Agricultural Applications. Energies, vol. 7, pp. 3056-3085.
[21] S. H. Pishgar-Komleh, A. Keyhani, P. Sefeedpari, (2015). Wind speed and power density analysis based on Weibull and Rayleigh distributions (A case study: Firouzkooh county of Iran). Renewable and Sustainable Energy Reviews vol. 42, pp. 313–322.