ABSTRACT
LAYMAN, LUCAS MICHAEL. Information Needs of Developers for Program
Comprehension during Software Maintenance Tasks. (Under the direction of Laurie A. Williams and Robert St. Amant.)
Software engineers undertaking maintenance tasks often work on unfamiliar code, requiring developers to search for, relate, and collect information relevant to the maintenance task. The goal of this research is to create theories that describe the nature of information sought by developers and how that information is used by developers during two types of maintenance tasks: debugging (corrective maintenance) and enhancement (perfective maintenance). To meet this goal, six hypotheses are investigated regarding the navigation activities undertaken by developers to identify, relate, and collect information during software maintenance tasks.
navigation techniques were significantly shorter in duration than keyword search techniques. No statistically significant differences were observed in the amount of time developers spent collecting information in debugging and enhancement tasks. During debugging tasks, developers focused on information that controlled the state and behavior a particular element. During enhancement tasks, developers focused on how a element used other elements, rather than how an element is used by other elements.
The analysis of the code relationships motivated further study of the nature of the information gathered by developers in enhancement and debugging tasks. The information read by developers (source code, Java documentation, and web search results) was analyzed with respect to the content of the information, how the information was related to the task and code elements being investigated, and how the information was used. This qualitative analysis led to the following new theories on software maintenance:
Theory 1: Developers are less likely to progress toward completing a maintenance task when the correct implementation of new code or correct editing of existing code requires logical connections and/or evaluations of other code elements.
the system, whereas a functional concept is often identified through comparisons, similarities, and references of existing functionality.
Information Needs of Developers for Program Comprehension during Software Maintenance Tasks
by
Lucas Michael Layman
A dissertation submitted to the Graduate Faculty of North Carolina State University
In partial fulfillment of the Requirements for the degree of
Doctory of Philosophy
Computer Science
Raleigh, North Carolina 2009
APPROVED BY:
________________________________ ________________________________ Dr. Christopher B. Mayhorn Dr. Jason A. Osborne
DEDICATION
BIOGRAPHY
Lucas Layman is a native of Frostburg, Maryland in the often cold and windy Appalachians. He is the proud son of Michelle and Mike and is brother to his wonderful sister Rose. He graduated from Beall Junior-Senior High School in 1998 and moved to Baltimore to attend Loyola College in Maryland. He graduated from Loyola College with a Bachelor of Science in Computer Science and a minor in Mathematical Science in 2002. He received his Master of Science in Computer Science from North Carolina State University in 2004.
ACKNOWLEDGMENTS
We are truly the sum of our experiences, and my experiences are always attached to the people I shared them with. I cannot possibly thank everyone who has contributed to my arrival at this point, but there are several whom I must specially recognize.
To Mom and Dad. Your encouragement, reassurances and belief in me are why I am here. You provided me with the base and allowed me to sculpt the finished product. I have learned from you and by you those things that are most important in life. Words are not enough to thank you, but hopefully I can live in a way that shows you my appreciation.
To Rose. Whether you know it or not, you are my motivation. You enjoy your life, and nothing stops you from doing so. With you looking up to me, how could I fail?
To my Family. You all show me what it means to love something, and you show me how to care for those close to you. To my grandparents especially, Andre and Peg, Mary Margaret and George, I owe the love and thanks that a spoiled and loved grandchild cannot hope to pay back.
eternal optimism somehow always brought me out of troubled waters. My research and my career are owed to you, and what I have learned from my time as your student extends far beyond the walls of the laboratory.
To my friends, Adam, Aaron, Brett, Joe, Jeremiah, Elissa, Jake, Wendy and Sarah and many others, and to my labmates (current and former) Mark, Dright, Sarah, Michael, Jiang, Sarah, Stephen, Meiyappan, Jessica, Travis, Ben and Andy. You all make it worth getting up in the mornings. How in the world did this happen? A special thanks to Marie, who’s comfort and smile made these last few months possible.
To Nachi and Andy. Your constant encouragement has helped me immeasurably, and your examples of what the professional life should be like give me something to strive for in the future. Thank you for your confidence.
To Keith. Working with you ignited the spark that led me to pursue a career in research. More importantly, your practical wisdom kept me on the right course. Now I can finally feel comfortable calling you Keith instead of Dr. Gallagher.
TABLE OF CONTENTS
LIST OF TABLES... ... ix
LIST OF FIGURES ... xi
1 Introduction ... 1
2 Related Work ... 6
2.1 The psychology of rogram comprehension ... 6
2.2 Tools for cognitive assistance in programming ... 9
3 Study 1: Search Methods and Code Relationships in Maintenance Tasks ... 12
3.1 Participant selection ... 14
3.2 Target application overview ... 15
3.3 Programming environment and programming tasks ... 19
3.4 Data collection ... 22
3.5 Activity labeling... 24
3.5.1 Procedure for annotating event logs with activity labels ... 25
3.5.2 Activity label generation and refinement ... 28
3.5.3 Special activities: Editing and Reading ... 29
3.6 Activity data analysis ... 31
3.7 Navigation style analysis ... 39
3.8 Relationships of source code elements during navigation ... 43
3.8.1 Identifying static code relationships in the Paint application ... 44
3.8.2 Extracting code relations from navigation data ... 46
3.8.3 Navigation relation statistics ... 48
3.8.4 Relations followed by fast and slow navigators ... 52
3.9 Study limitations ... 55
3.9.1 Construct validity ... 56
3.9.2 Internal validity ... 59
3.9.3 External validity ... 61
3.10 Summary ... 63
4.2 Source preview in Mimec Spotlight ... 73
5 Study 2: Enhancement vs. Debugging Tasks ... 76
5.1 Participant selection ... 77
5.2 Study layout and data collection ... 78
5.3 Activity description for enhancement and debugging tasks ... 81
5.4 Navigation activities in enhancement and debugging tasks ... 87
5.4.1 Navigation time for enhancement and debugging tasks ... 89
5.4.2 Navigation style analysis ... 92
5.5 Code relationships ... 95
5.5.1 Relationships across all tasks ... 96
5.5.2 Relationships in enhancement and debugging ... 98
5.6 Information used in debugging and enhancement tasks ... 101
5.6.1 Qualitative analysis method ... 101
5.6.2 Types of information relevance ... 103
5.6.3 Relationship of information to programming task ... 107
5.6.4 Evaluation of the Mimec Spotlight ... 109
5.7 Limitations ... 112
5.7.1 Construct validity ... 112
5.7.2 Internal validity ... 113
5.7.3 External validity ... 114
5.8 Summary ... 114
6 New Theories Regarding Software Maintenance Tasks ... 117
6.1 The influence of logical requirements and cognitive load on task success ... 117
6.2 Characteristics of information used in enhancement and debugging tasks ... 119
7 Research Summary ... 122
8 References ... 127
Appendix ... 131
Appendix A - Participant questionnaire ... 132
Appendix B - Programming tasks for the Paint application ... 133
Appendix C - Programming tasks for MedReporter ... 135
Activity categorizations ... 138
Appendix E - Relation schema description ... 140
Appendix F - List of examined static code relations relations ... 144
Appendix G - Familiarization task for the Paint application ... 147
LIST OF TABLES
Table 1. Survey responses... 15
Table 2. Top 12 activities by duration ... 32
Table 3. Time spent navigating per user ... 41
Table 4. Navigation period duration statistics ... 42
Table 5. Statistics for files navigated to and static dependencies followed ... 42
Table 6. Static code relation types enumerated for the Paint application ... 45
Table 7. Top 15 most frequently observed direct static code relations during navigation ... 50
Table 8. The ten most frequently observed static code relations between starting elements and terminating element during navigation ... 49
Table 9. Navigation period statistics per user ... 53
Table 10. Ten most frequently-occurring relations for fast navigators ... 53
Table 11. Ten most frequently-occurring relations for slow navigators ... 54
Table 12. Task orderings ... 81
Table 13. Top 10 activities by duration ... 82
Table 14. Top ten activities by frequency in debugging tasks vs. enhancement tasks ... 83
Table 15. Top five activities by duration in debugging tasks vs. enhancement tasks ... 84
Table 16. Navigation time spent per user ... 88
Table 17. Navigation time per task and per task type ... 89
Table 20. Statistics for files navigated to and static dependencies followed during navigation
periods ... 92
Table 21. Navigation style duration per task type ... 93
Table 22. Navigation style file switches per task type ... 94
Table 23. Top 15 most frequently observed static code relationships during navigation ... 96
Table 24. Top 10 relations between starting source and terminus ... 97
Table 25. Top 10 most frequently occurring relations in debugging tasks ... 99
Table 26. Top 10 most frequently occurring relations in enhancement tasks ... 99
Table 27. Successes of the different information relevance types ... 104
Table 28. Successes of the different information relevance types per maintenance task type ... 106
Table 29. Task-information relationships for each task type ... 108
Table 30. Relevance type success method ... 110
Table 31. Spotlight relations followed per task type ... 111
Table 32. How is information used per task type ... 121
Table 33. List of activity labels ... 137
Table 34. Schema for describing static code relationships ... 142
Table 35. List of static code relations collected for the Paint application ... 144
LIST OF FIGURES
Figure 1. The Paint application ... 17
Figure 2. The MedReporter application ... 18
Figure 3. Eclipse screenshot ... 20
Figure 4. A Mimec event ... 23
Figure 5. Labeled event log ... 27
Figure 6. Activity DNA for Participant 8 working on the Paint application ... 35
Figure 7. Activity DNA for Participant 13 working on the Paint application ... 36
Figure 8. Activity DNA for participant 31 working on the MedReporter application ... 37
Figure 9. Activity DNA for Participant 4 ... 38
Figure 10. Navigation period example... 41
Figure 11. Example of relations in navigation history ... 48
Figure 12. The Mimec Spotlight popup with code relations for the “constructionBeginning” method... 69
Figure 13. The Mimec Spotlight view ... 70
Figure 14. Mimec Spotlight source preview ... 74
Figure 15. ActivityDNA for a debugging (top) and enhancement task (bottom) for participant 54 ... 86
1
Introduction
Most effort in professional software engineering1 is directed toward software
maintenance [2, 3, 11], which is “the process of modifying a software system or component
after delivery to correct faults, improve performance, or other attributes, or to adapt to a
changed environment” [40]. Software engineers undertaking maintenance tasks often work
on code written by another developer or code that has not recently been modified, thus
requiring the developers to both seek out and understand information relevant to the
maintenance task [33]. An important activity of software maintenance is program
comprehension: the acquisition of knowledge to understanding the architecture, design,
and/or behavior of a computer program. The speed and ease with which developers can
identify and comprehend relevant information in a software system is influenced by many
factors, including developer expertise and experience, quality of documentation, traceability
of code ownership, source code naming conventions, and the design of integrated
development environment (IDE) tools used by developers [1, 4, 5, 17, 25, 30, 41].
Assisting developers in the program comprehension activities of searching for,
relating, and collecting relevant information during a maintenance task remains an important
challenge in software engineering. To meet this challenge and to expand upon prior work,
this research focuses on the programming activities that developers engage in while
undertaking two particular types of software maintenance task: debugging a fault in the
system and enhancing the system with new functionality. Examples of programming
activities are editing source code, reading source code, reading documentation, navigating
through source code, executing the system, and performing searches through the source code.
Debugging maintenance (i.e. corrective maintenance) is formally defined as “maintenance
performed to correct faults in hardware or software” [40]. Enhancement maintenance (i.e.
perfective maintenance) is defined as “improvements in software's performance or
functionality, for example, in response to user suggestions and requests” [12]. Prior research
has identified specific information needs for debugging tasks, yet no detailed investigation
has been performed of the information needs for enhancement tasks.
The goal of this research is to create theories that describe the nature of information
sought by developers and how that information is used by developers during debugging and
enhancement maintenance tasks. To meet this goal, seven specific hypotheses are
investigated with respect to the navigation activities undertaken by developers to identify,
relate, and collect information during software maintenance tasks:
Hypothesis 1: The amount of time developers spend navigating to collect information
relevant to a maintenance task differs depending on the type of navigation method;
Hypothesis 2: Navigation periods that leverage static code relationships2 are shorter
in duration than navigation periods employing keyword searching methods;
2 A static code relationship is a programmatic link between two source code elements where one element calls
Hypothesis 3: Navigation periods that incorporate static code relationships are
shorter in duration than navigation periods employing normal navigation
methods;
Hypothesis 4: There is a difference in the specific type of code relationships followed
explicitly and implicitly by “fast” navigators” developers vs. “slow” navigators;
Hypothesis 5: The amount of time spent navigating during a maintenance task is
dependent on the type of maintenance task: enhancement or debugging;
Hypothesis 6: The number of file switches during a maintenance task is dependent on
the type of maintenance task: enhancement or debugging; and
Hypothesis 7: The specific types of code relationships followed explicitly and
implicitly during navigation depend on the type of maintenance task: enhancement
and debugging tasks.
Furthermore, attributes of the information read, collected and used by developers are
analyzed to identify systematic differences in the information used in enhancement and
maintenance tasks. By understanding the navigation practices and code relationships present
during success information collection periods, it may be possible to create a tool that brings
these relationships to the forefront, making them readily available to developers who may be
unaware of the value of these techniques and relationships. Making developers aware of
variables), or refers to a type definition (in the case of classes and enumerations). In this paper, the term static
these relationships, and facilitating the exploration of these relationships with minimal
overhead, may serve as a means to reduce the navigation time spent by all developers.
Two empirical studies are described in this dissertation. First, video captures and
IDE usage logs from ten developers performing a maintenance task were collected to identify
search patterns and code relationships exploited by developers. The data from this first study
is used to investigate Hypotheses 1-4. Based on the results of this study, an Eclipse plug-in,
the Mimec Spotlight, was created to assist developers in identifying information related to a
software maintenance task. In the second study, video captures and IDE usage logs from
eight developers performing both debugging and enhancement tasks were analyzed to
identify differences in the navigation methods and code relationships examined in
enhancement and debugging tasks. The data from this second study were used to investigate
Hypotheses 5-7. Finally, the source code information, documentation, and web resources
used by the developers in the second study were analyzed according to information content
and how the information was applied to identify differences in the nature of information used
in debugging and enhancement tasks.
The remainder of this document is organized as follows: Section 2 describes work
related to program comprehension and tools for assisting in software maintenance tasks;
Section 3 presents a study of the navigation techniques and code relationships investigated
during maintenance tasks to identify the traits of fast and successful searches for relevant
information. Section 4 describes a tool, the Mimec Spotlight, a tool created to present
the study. Section 5 presents a study comparing the navigation techniques, code
relationships, and information content used in debugging versus enhancement tasks and
evaluates the Mimec Spotlight application. This research is summarized in Section 6.
2
Related
Work
Related and motivational work that provides additional context for this research is
discussed in this chapter.
2.1
The
Psychology
of
Program
Comprehension
Maintenance tasks may begin in a variety of ways with the developer executing the
program or running test cases to surface a fault, or finding an extension point in the code
from which the process of adding functionality begins. Inevitable, the developer must
understand how all or some existing classes, functions, and even individual lines of source
code contribute to the system’s overall functionality. Brooks’ theory of the comprehension
of computer programs [4] is representative of the most widely-held beliefs surrounding
program comprehension and serves as a useful basis for the context of this research. When
developers reach a point where they must manipulate source code, Brooks observed that
developers begin by looking for “beacons” in the code that appear relevant to the
programming task. Beacons can take many forms depending on the problem-solving
strategies of individual developers and their existing knowledge of the system. Beacons may
be known methods or classes that implement some relevant functionality, lines of code that
generate output, or even names of functions or classes that may seem relevant to the
programmer’s task. For example, a developer trying to find the cause of a malformed output
file may take the function “writeLogFile” as a starting beacon due to the connotation of the
investigation, developers create hypotheses and iteratively refine or discard hypotheses by
branching out to other relevant information from that starting point. In the example where
the developer started with “writeLogFile,” suppose the developer may expand his or her
search space to include functions calling writeLogFile, or functions that set the data variables
used by writeLogFile, all in an effort to identify the origin of the fault. Locations (and
beacons) are discarded or pursued based on the individual developer’s sense of relevance.
The theory of program comprehension through iterative hypothesis refinement described by
Brooks is explicitly or implicitly assumed as the foundation for most studies of programmer
behavior related to comprehension, e.g. [17, 32]. Brooks theory of program comprehension
fits into the more general theory of “information foraging” that describes how humans
allocate time and resources, identify relevant environmental queues, and select and pursue
information in an environment where the information available adapts over time [26].
Brooks’ theory has been refined and explored in detail by a number of researchers. In
studies conducted with over 50 student and professional programmers performing coding and
design tasks, Parsons and Saunders observed that developers exhibit the “anchoring”
heuristic, wherein an initial estimate of the solution (e.g. a relevant “beacon” in Brooks’
terminology) often dominates the final solution regardless of the actual correctness or
relevance of the initial anchor point to the objectively correct solution [24]. Developers
scanning source code for word-based beacons or other cues can be confounded by the
“vocabulary problem,” where two people ascribe different words or combination of words to
understand a program based on its surface features (runtime output, source code naming
conventions) whereas more experienced programmers investigate deeper structures (control
flow, data flow) [1, 41] [22, 27]. A developer’s ability to understand a program is also
influenced by features of the program itself, such as cyclomatic complexity, class coupling,
and naming conventions [37, 38] .
These studies provide a high-level overview of the many challenges faced in program
comprehension tasks. A final study of particular importance is that of Ko et al., which
provides a general theory of how software developers search for relevant information in
maintenance tasks [17]. They studied 31 developers performing various debugging and
enhancement tasks and found that developers were often mislead by misrepresentative cues
and spent approximately 35% of their time switching between source files. Ko et al. also
found that developers explored static code relationships when finding a “relevant” piece of
information, but that searching for and collecting information was often hampered by the
design of the IDE tool that the developers were using. Ko et al. augmented existing theories
of program comprehension by observing that the seeking and relating of information are
separate cognitive activities, and that the collection/accumulation of the relevant information
in a way that is easily retrievable at a later time is critically important to the efficiency of the
maintenance task.
This dissertation expands on the above prior work in several ways. First, the static
code relationships underlying developers’ investigation of relevant information are explored.
available through a variety of automated analysis techniques, making it possible for an
automated system to analyze and present this information to a user. Second, differences
between enhancement and debugging tasks are investigated with respect to differences in the
static code relationships explored, navigation strategies, and information used by developers;
the majority of prior research has often focused on maintenance and rarely discussed
enhancement explicitly. The hypothesis that enhancement and debugging have
fundamentally different information needs, and that a solution, tool, or theory that is based on
debugging alone will be insufficient for enhancement tasks, is investigated as part of this
research.
2.2
Tools
for
Cognitive
Assistance
in
Programming
Many tools exist to facilitate and aid developers in finding relevant information based
strictly on source code data, including search tools such as Linux’s grep, auto-completion for
source syntax and element names, and program slicing [42]. Tools based on the cognitive
needs of developers are a relatively new phenomenon, but have been the subject of numerous
research programs. Kersten and Murphy created the Mylyn tool after observing that
developers often cluster files or program elements (such as methods or variables) together
cognitively as they work on a task, but that developers spent considerable time searching for
these relevant elements among irrelevant elements in the IDE [13, 14]. Mylyn is a plug-in
for the Eclipse IDE that tracks which program elements are relevant to the current task using
elements DOI value is increased, and the DOI value degrades over time if the element is not
interacted with again. Kersten and Murphy found that, by exploiting the DOI relationship in
files and reducing the number of displayed elements that users could browse through,
developers had a statistically-significantly higher productivity (as measured by the ratio of
edits to file switches) [14].
The Feature Exploration and Analysis Tool (FEAT) [28, 29] makes recommendations
of relevant code based on where the user has visited and edited code in the past and the static
dependencies between past code elements and other parts of the system. The tool offers a
perspective on the source code that is more attuned to the developer’s perspective, essentially
taking a “beacon” in the source code and performing some of the searching for the user.
Čubranić et al. expanded on the idea of “group memory” for software systems [39] to create Hipikat, a recommender system based on numerous software artifacts, such as source code
repository logs, email messages between developers, and bug reports [6, 7]. Hipikat analyzes
transaction logs of bug tracking systems, performs text-similarity analysis, and matches this
data with file revision histories to recommend source files relevant to a particular task (e.g.
fixing bug # 22225). As with FEAT, Hipikat is based on studies of how users think about
and solve software engineering tasks. However, such tools are often hampered by a
shortcoming of recommender systems in general -- that recommendations may be (and often
are) incorrect and provide numerous false positives. A recommendation system that
Another particularly relevant tool generated from studies of programmers performing
maintenance tasks is the Whyline for Java [15, 16]. Ko et al. observed that developers spend
nearly 35% of their time navigating between source files when performing a maintenance
task [17]. The constant switching between source files caused developers to lose the context
of their hypotheses, and the developers frequently revisited files rather than progressing
sequentially toward a solution. Ko et al. also observed that developers evaluated questions of
the form “why is this variable’s value 15 at this point?” or “why is this button not working?”
Ko et al. created an IDE tool, the Whyline, which allowed developers to more naturally
answer these “why” and “why not” questions by recording the execution of a program and
enabling the users to step backward through time to see how variables obtained their values.
This behavior is analogous to traditional breakpoint use, but works in reverse time. Ko et al.
found that novice developers using the Whyline on debugging tasks performed twice as fast
as expert programmers not using the Whyline [15] on the same tasks. The Whyline is limited
in that it applies primarily to debugging tasks, rather than enhancement tasks, cannot be used
with applications with non-traditional input and output channels (such as server applications),
and requires the developers to use a separate, limited IDE that lacks the commonplace
features of the Eclipse or Visual Studio IDEs.
3
Study
1:
Search
Methods
and
Code
Relationships
in
Maintenance
Tasks
As discussed in the previous section, researchers have observed that some methods of
searching for and collecting information result in more successful program comprehension
tasks in terms of both time spent and relevance [1, 17, 22, 37, 41]. This prior research is
expanded on by the study described in this section. The goal of this study is to examine the
different methods used by developers to search for and navigate to information in the source
code relevant to debugging and enhancement tasks and determine if certain methods take less
time than others. If so, then these methods and the relationships between the source code
items they uncover may be exploited to assist developers in reducing the time spent searching
for relevant information.
This study proceeds in three phases. The first phase is to identify the different
activities engaged in by developers during a maintenance task, including the different means
of searching and navigating. The second phase is to examine three search methods used by
developers in terms of the time taken to find information. The search methods are static
navigation, keyword searching, and filename navigation. The third phase is to determine if
systematic static code relationships exist between the source element from which developers
start searching and the source element which the developers copy information from or edit.
Hypothesis 1: The amount of time developers spend navigating to collect information
relevant to a maintenance task differs depending on the type of navigation method;
Hypothesis 2: Navigation periods that leverage static code relationships are shorter in
duration than navigation periods employing keyword searching methods;
Hypothesis 3: Navigation periods that incorporate static code relationships are
shorter in duration than navigation periods employing normal navigation
methods;
Hypothesis 4: There is a difference in the specific type of code relationships followed
explicitly and implicitly by “fast” navigators” developers vs. “slow” navigators;
The main sources of data in this empirical study are video recordings and logs of IDE
interactions of developers performing maintenance tasks. An IDE interaction is the selection
of an interface element or invocation of some portion of the IDE’s functionality by the
developer. Examining logs automatically generated from IDE interactions has two
advantages over examination of video recordings alone: 1) the automatically-generated logs
can provide more accurate measures of the time spent during particular tasks because of the
precision of the time when an interaction took place; and 2) the logs can identify interactions
that may have been missed by observation due to transcriber error or because of the speed at
3.1
Participant
selection
Participants for this first study were solicited from the NCSU computer science
graduate student mailing list. Interested participants visited a web site providing information
on the study, filled out an online questionnaire, and received a $20 gift certificate for
participating in the research. The study was approved by the Institutional Review Board
(IRB), and all participants signed an IRB consent form. A copy of the online questionnaire
may be found in Appendix A. Twenty-four individuals responded to the survey. Six
applicants were ineligible to participate because they were not in the Raleigh area. Of the
remaining applicants, ten were selected based on their experience with IDEs, professional
development experience, and Java experience. Problem-solving strategies may be influenced
by programming experience and IDE expertise; therefore, participants were selected with a
wide range of experience in terms of both professional programming experience and IDE
experience to obtain a sample with a variety of problem-solving methods. The survey
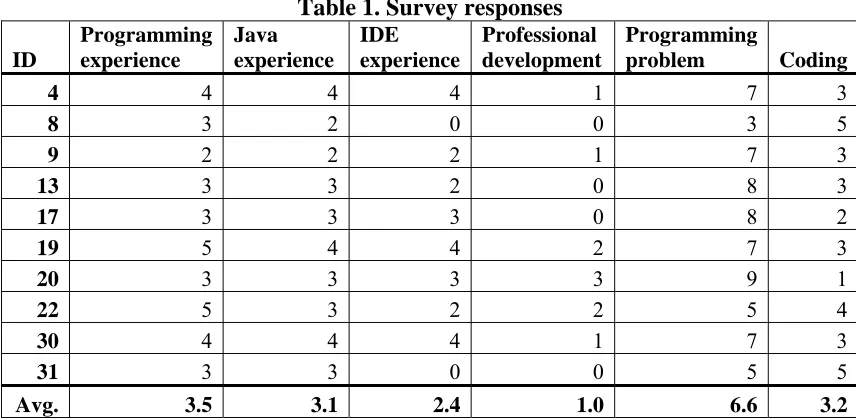
responses for the participants in this study are listed in Table 1. Values ranged from 0 (no
experience) to 5 (10 years or more of experience). All of the participants had more than one
year of Java programming experience and widely varying degrees of IDE experience. (Note:
that the experience ratings of 0-2 are relatively low and represent smaller intervals, whereas
Table 1. Survey responses ID Programming experience Java experience IDE experience Professional development Programming problem Coding
4 4 4 4 1 7 3
8 3 2 0 0 3 5
9 2 2 2 1 7 3
13 3 3 2 0 8 3
17 3 3 3 0 8 2
19 5 4 4 2 7 3
20 3 3 3 3 9 1
22 5 3 2 2 5 4
30 4 4 4 1 7 3
31 3 3 0 0 5 5
Avg. 3.5 3.1 2.4 1.0 6.6 3.2
3.2
Target
application
overview
All participants worked on one of three Java programs for a maximum of 60 minutes,
performing several debugging and enhancement tasks. The tasks and study layout are
described in more detail in Section 3.3. The participants worked on one of three Java
programs: a drawing program (Paint [16]), a simple medical records library interface
(MedReporter [18]), and an Eclipse plug-in that analyzes static analysis alerts (AWARE
[34]). The Paint application was selected because of its use in prior studies of maintenance
tasks and was given to seven of the participants (Participants 8, 9, 13, 19, 20, 22, and 30).
The MedReporter application was given to two participants (Participants 17 and 31), one of
application and the other who had worked on the Paint application previously. The Paint and
MedReporter applications are described in more detail below. The AWARE plug-in was
written originally by one of the participants (Participant 4), and this participant’s activities
consisted primarily of developing new code (i.e. not performing a debugging or enhancement
task). This participant’s data serves as an important contrast to the maintenance tasks.
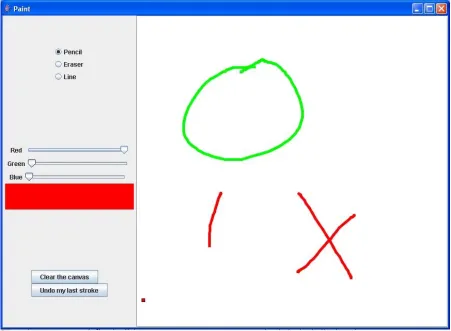
The Paint application is a 407 line-of-code (LoC) Java program that performs simple
drawing and painting functions. The participants working on the Paint application were
asked to complete several debugging and enhancement tasks (described in Section 3.3). A
screenshot of the Paint application running may be found in Figure 1. Paint is comprised of
nine classes and 38 methods and is fairly complex, making heavy use of abstraction,
polymorphism, and the Java Swing Application Programming Interface (API). However,
Paint is small enough that an experienced Java programmer could obtain an accurate picture
Figure 1. The Paint application
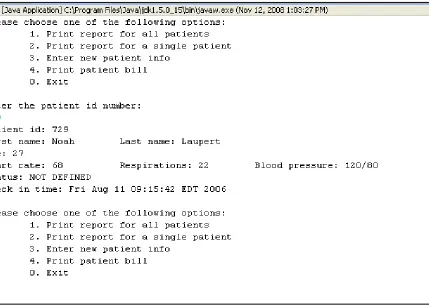
MedReporter is a 400 LoC Java program that offers various command-line menu
options to a hypothetical physician, such as printing out patient records, entering patients’
info, and more. A screenshot of the MedReporter application running may be found in
Figure 2. MedReporter is comprised of seven classes and 36 methods, but unlike Paint does
not make use of Java graphics APIs and thus requires less domain knowledge to understand.
Furthermore, MedReporter is cognitively a less complex design with nearly all processing
and polymorphism. The MedReporter program was included in this study to provide more
variety to the study data, though most of the participants were given the Paint program
because of its use in prior studies [15, 17] and to enable study comparison.
3.3
Programming
environment
and
programming
tasks
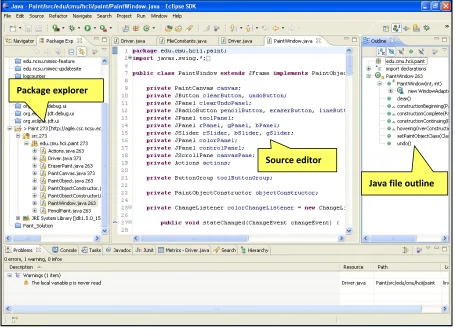
All participants were required to complete the programming tasks using the Eclipse3
IDE. A screenshot of Eclipse and the UI components relevant to the study may be found in
Figure 3. Eclipse is an open source IDE widely-used in both industry and academia for
programming in the Java language. Eclipse has extensive file navigation and search
facilities, continuous compilation (for error-checking), and auto-completion features.
Participants were allowed to use their own installations of Eclipse on their own computers, or
could optionally program on a laptop provided by the investigator. Participants using the
laptop provided by the investigator used Eclipse version 3.3 with default settings, and were
provided with a USB mouse and internet connection. Three participants (4, 17, and 30)
opted to use their own computers with their own Eclipse installations.
Figure 3. Eclipse screenshot
The participants were given the option of completing their programming tasks in their
own office or lab, or in a closed room furnished by the investigator since the purpose of the
study was not to maintain a controlled environment but to capture developers working
“naturally.” The participants were told that the study was to understand how developers go
about programming activities and that there was no “right” or “wrong” way of completing
the tasks. Participants were told that the tasks could be completed in any order they wished,
and that the participants could use any resources found in the Internet, in textbooks, or in
Package explorer
Source editor
documentation, but were discouraged (though not prohibited) from asking other individuals
for help. The investigator remained available at all times to answer questions about the
programming tasks, and participants were told to notify the investigator if they completed
their tasks before the allotted 60 minutes. The participants were not directly observed by the
investigator while performing their tasks to help alleviate any pressures the participants may
have felt from being observed by a third party and to help them work more “naturally.”
On the laptop provided by the investigator, Eclipse was given to the participants with
a project containing either the Paint application or MedReporter already open. Participants
were asked if they were familiar with how to execute and navigate through files inside
Eclipse; two participants (who answered in the negative) were shown how to execute each
application (by clicking the Run button) and shown how to navigate between source files
using the Windows-like Package Explorer (see Figure 3). Finally, the participants were
provided with the task list for their particular application. A verbatim listing of the tasks and
solutions for the Paint and MedReporter applications may be found in Appendix B and
Appendix C, respectively. The Paint application contained three debugging tasks
(YELLOW, UNDO, and SCROLL) and two enhancement tasks (THICKNESS and LINE),
while MedReporter consisted of four enhancement tasks. The enhancement tasks involved
adding or extending existing functionality, whereas the debugging tasks required correcting
3.4
Data
collection
Primary data collection was facilitated by two means. First, a plug-in called Mimec
[19], created during the course of this research to log user interactions with the Eclipse IDE,
was installed in Eclipse. Mimec attaches listeners to various parts of the Eclipse IDE, and
then records user interactions to a log file. Mimec is based on the Mylyn [14] plug-in with
numerous additions to provide more fine-grained interaction data concerning source code
edits and navigation activities. The interactions captured by Mimec include, but are not
limited to the following:
• user edits of the source file;
• interacting with menus;
• selecting files and Java elements in the Package Explorer;
• selecting Java elements in the file outline (see Figure 3);
• executing;
• switching between open source files;
• changing preferences; and
• scrolling the source code window.
These interactions are then recorded as entries in a log file. A single line in the log file
corresponds to an event – a single observation generated by one of the listeners in Mimec.
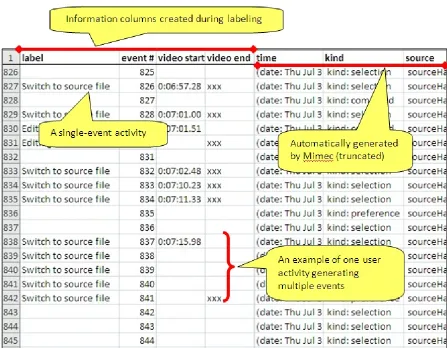
An example of an event may be found in Figure 4. An individual user interaction with
Explorer generates a minimum of three events: 1) the selection of the file in the Package
Explorer; 2) the activation of the source file in the editor; 3) the selection of the first line of
the source file in the Java editor.
Figure 4. A Mimec event
A Mimec event is comprised of five pieces of information. First, each event has a
timestamp with millisecond precision of when the event was observed by a Mimec listener.
Second, each event has an event kind, which is a Mylyn-specific classification of the event
(this categorization is ignored in our study). The target of an event is the Java element (if
any) that is the subject of the interaction, such as the name of the file selected in the Package
Explorer, the name of the file being edited, or the name of the method where the text cursor
is currently located. The origin is the part of the Eclipse IDE that generates the interaction,
such as the Package Explorer, source code editor, or menu bar. Finally, the delta attribute
contains meta-information (if any) relevant to help distinguish between events of a particular
kind. For example, minimizing and un-minimizing a source window generate identical
events with the exception of the delta attribute (e.g. both are selection events with identical
targets and origins, but with delta values of fastViewAdd vs. fastViewRemove). The number
of events generated depends largely upon a particular developer’s IDE usage habits. For
a 54-minute session by Participant 13 generated 11,385 events. The event logs are stored as
Comma-Separated Value (CSV) files.
The other source of data was video recordings of the participant’s computer screen.
Camtasia Studio4 was installed on the investigator’s laptop (or the participant’s own
computers) to video record all activities on the screen. The video capture software created a
continuous movie that captured the entire screen and was not limited to the Eclipse window.
The resulting movie files ranged from 70-130 Mb in size. The files were transferred to the
investigator’s personal computer from the provided laptop or participant’s computer
immediately after completion of the programming tasks. The event logs and video
recordings for every participant were collected immediately after the participant completed
the assigned tasks or the allotted 60 minutes had passed.
3.5
Activity
labeling
The automatically-generated event logs for each user were annotated according to the
user’s activities captured in the video recording. An activity corresponds to a single
interaction with the IDE from the standpoint of the user. Examples of activities include
Switching to a source file, Creating a new class, Editing, Reading, and Navigating search
results. A complete list of activity labels may be found in Appendix D. Whereas the event
logs are the reactions in the IDE generated upon a user action, the activities describe user
behavior. As previously mentioned, one activity can generate many events. The Mimec
plug-in cannot automatically label the events with their user activity at present since the
events themselves may not be descriptive enough to identify a particular user activity without
some additional reference (such as a video log). Automatic labeling is not used in any study
described in this dissertation.
3.5.1 Procedure for annotating event logs with activity labels
This subsection describes the procedure for annotating the event logs. The generation
and refinement of the activity labels is discussed in the next section. The process of labeling
a single user’s event log for a 60 minute recording took approximately six hours, longer for
the initial recordings as labels were being generated. In total, the participants generated 544
minutes of video, 55237 events (42860 labeled events), and 2169 activities. The analysis of
these data is discussed in Section 3.6. The steps for annotating each participant’s event log
are described below.
Step 1: Every event was labeled with a unique number (a sequential labeling from
1-N where 1-N is the total number of events in the log for a single user).
Step 2: The participant’s video recording was watched and paused whenever the
participant’s first interaction with the Eclipse IDE was observed. The events that
corresponded to this first interaction were searched for in the event log and annotated with
the appropriate activity label.
Step 3: Based on the time stamp of the first interaction event and the video time at
in the event log were generated. This made searching for events generated by user activities
observed in the video recordings much quicker.
Step 4: The video recording of the user’s programming activities was watched for
user interactions with the Eclipse IDE. When a user activity was observed in the video, the
video was paused and stepped frame-by-frame backward to the time where the interaction
was initiated. Events were annotated with up to three pieces of information: 1) the activity
label; 2) the activity’s start time; and 3) a field indicating that the activity terminated at that
event. If the user activity generated a single event, the event was labeled with the user
activity, the time of the video where the event was observed, and a marker indicating that the
activity terminated with that event as well (see Figure 5). When the user interaction
generated multiple events, each event would receive the same activity label. The first event
corresponding to the activity received the video timestamp, and the last event received a
marker identifying it as the terminating event. In the case of multiple-event activities, the
ending event was determined to be the last event that was automatically generated by the IDE
as a result of the user’s interaction.
Consider the example of switching between source files, which generates three
events: #1) the selection of the file in the Package Explorer, #2) the activation of the source
file in the editor by Eclipse, #3) the automatic selection by Eclipse of line 1 of the source file
in the Java editor. Event 1 is the only event that was generated by direct manipulation of the
IDE by the user, whereas Events 2 and 3 were automatically generated by the IDE as a result
Event 3 is marked as the end of the activity. An example of labeled activities is shown in
Figure 5.
Figure 5. Labeled event log
There were many events that were not labeled. The videos were watched and then
user activities were annotated in the event log as they were observed in the video, but no
events in the event log that did not correspond to any obvious user activity and trying to
annotate these events with a particular user activity would have generated erroneous
mappings. For example, users would sometimes click around the IDE, highlighting certain
items but without taking any obvious action on those items. This sort of activity (and
corresponding event(s)) was not labeled in the event log since the action could not readily be
defined. The clicking may have been an indication of an aborted attempt to open a source
file, or a highlight for mnemonic purposes, or some other activity.
3.5.2 Activity label generation and refinement
The activity labels were meant to capture user-level actions with a focus on physical
interaction rather than user intent. The initial set of labels (constructed from a preliminary
test-run of the Mimec plug-in not reported here) was constructed by answering the question
“what is the physical interaction initiated by the user?” while watching the recorded video.
Labels took the form “the user is editing” and “the user is switching to another source file.”
The complete set of labels in Appendix D was stable after four videos, that is, no additional
labels were required to be added to the list after viewing the recordings of users 4, 8, 9 and
13. The set of labels is by no means complete in terms of all possible user activities in the
Eclipse IDE.
Refinements of the label set were common initially, with some activities (e.g.
“Navigating”) being broken down into more specific activities (“switching to a source file,”
Refinement took place as video recordings of the programmers were watched and labels were
applied to the event logs (described in the next section). Generally, activities were refined
according to the part of the IDE that the user interacted with, that is, the event origin. This
refinement method is appropriate for two reasons: 1) by the nature of the Eclipse
architecture, different elements of the IDE represent different functionalities and user
services; and 2) a separation of activities based on the IDE part where the interaction started
is valuable for identifying activity boundaries in the event logs (though some activities, such
as opening a file, may cross multiple origins). Whenever a label was refined,
previously-labeled events were reviewed and new labels applied as necessary to ensure consistency
across all users.
3.5.3 Special activities: Editing and Reading
All activities defined in Appendix D had clearly identifiable starting and terminating
events in the event log with two exceptions: editing and reading. Editing activities were
initiated when the user made a change to the source code and persisted until the user saved
the changes to the source file, began a “Reading” activity, or performed another activity
(such as executing). Editing typically occurred in distinct blocks where the user would
implement changes, save the changes, and then execute the system. At other times, the user
would edit one part of the source file, scroll to another part (or perhaps switch to another file)
users’ edits were interrupted by another activity and when navigations or scrolling were
interim steps between related edits.
Identifying “Reading” activities was less precise. As in [17], reading activities were
defined by the user highlighting a source code element, hovering with the mouse cursor for
more than one second over source code, or pausing the scrolling of the source window. In
many ways, this estimation of Reading is conservative as the user may be reading the source
code on the screen but offering no indicators to that effect, such as when a new file is opened
and the user begins reading the code content at the top of the file. This definition of Reading
often does not account for instances of “scanning” where the user may be very rapidly
scrolling through source code in search of a source beacon. The reverse is also true, in that
the user idling over source code may not be indicative of reading, but instead of a distraction
away from the IDE. Typically, however, reading was characterized by some sort of user
activity, whether it is occasional scrolling or cursor movement in the source window.
Reading labels were conservatively applied to events; if it was unclear if the user was reading
code (e.g. the user paused only briefly over a piece of code), then no label was applied.
Finally, certain types of reading, such as looking up documentation on the Internet, generated
no events as Mimec did not record activities outside of Eclipse and was unreliable in
detecting when focus switched from Eclipse to another part of the desktop. Events that
occurred outside of Eclipse were visible in the video recordings.
Labels were applied by the principal investigator only, and were not verified by an
involved two passes. In the first pass, the events corresponding to the beginning and end of
activities were marked. In the second pass, all interim events between the beginning and end
event of an activity were filled in with the activity label. This process had a proofreading
effect on the labeling; common patterns of activity-event combinations appeared over and
over and mislabeled events stood out as breaking the patterns.
3.6
Activity
data
analysis
An overview of the summary statistics and frequencies for the different activities
observed is presented in Table 2. The statistics are calculated from summary files produced
from each event log. The summary file of an event log contains an ordered sequence of the
activities, the start time of the activity (the timestamp of the first event), the end of the
activity (the timestamp of the last event associated with that activity), the duration of the
activity, and the number of Mimec events that comprise the activity. The data in Table 2
excludes participant #4’s information. As mentioned in Section 3.2, participant #4’s
development was not one of the prescribed maintenance tasks and consisted almost
exclusively of new code development. Participant #4 spent nearly 40 minutes (85% of the
time) editing source code. This participant’s data are excluded from aggregate analysis of
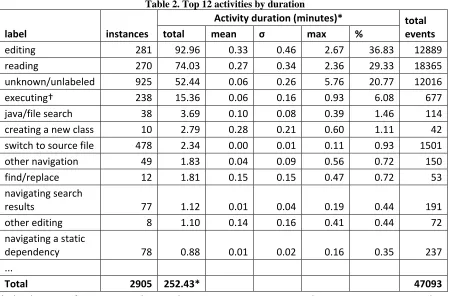
Table 2. Top 12 activities by duration
label instances
Activity duration (minutes)* total
events
total mean σ max %
editing 281 92.96 0.33 0.46 2.67 36.83 12889
reading 270 74.03 0.27 0.34 2.36 29.33 18365
unknown/unlabeled 925 52.44 0.06 0.26 5.76 20.77 12016
executing† 238 15.36 0.06 0.16 0.93 6.08 677
java/file search 38 3.69 0.10 0.08 0.39 1.46 114
creating a new class 10 2.79 0.28 0.21 0.60 1.11 42
switch to source file 478 2.34 0.00 0.01 0.11 0.93 1501
other navigation 49 1.83 0.04 0.09 0.56 0.72 150
find/replace 12 1.81 0.15 0.15 0.47 0.72 53
navigating search
results 77 1.12 0.01 0.04 0.19 0.44 191
other editing 8 1.10 0.14 0.16 0.41 0.44 72
navigating a static
dependency 78 0.88 0.01 0.02 0.16 0.35 237
...
Total 2905 252.43* 47093
* The duration of an activity is the time between its starting event and its terminating event, and duration does not include the “idle time” when no interactions are observed
† The duration of execution events does not include time spent using/testing the Paint application after it has been launched
The total duration of all observed activities, including unknown/unlabeled activities,
totaled 252.43 minutes. The total amount of time the user was idle in the IDE was 236.7
minutes – 48.4% of the time. Neither activity duration nor idle time account for time spent
outside the Eclipse IDE, such as when using a web browser.
Aside from unlabeled/unknown activities and events, the most common activities
were Editing, Reading, and Executing. Participants spent nearly 37% of their time editing
source code and 30% of their time reading code. Interestingly, 478 of the 1980 known
Navigating static dependencies, Other navigation, Navigating search results, Find/replace,
and Java/file search) account for 758 of the 1980 known activities (~38%). That accounts for
approximately 1.5 navigation activities per minute. Clearly, the participants spent
considerable effort navigating through the system in search of relevant information. Bear in
mind that the total time spent for navigation activities in Table 2 is comprised almost
exclusively of activities that take little time for the system to execute, such as switching
between source files. A more accurate picture of the effort spent navigating would also
account for the time spent reading source code; this will be investigated in detail in Section
3.7.
A number of interesting behaviors and patterns of behavior were observed in the
video recordings. A visualization of the event summaries helps to highlight the behaviors
and helps to contrast the activities of different users. To support this research, a program
called ActivityDNA was created to visualize the activities in the Mimec logs. The
ActivityDNA program produces a graph similar to a Gantt chart where the individual bars
represent categories of activities and the X-axis represents the progression of time. An
example of the activity summary visualization (called ActivityDNA) is shown in Figure 6.
The X-axis represents the progression of time from left to right, and the axis labels
correspond to the actual time the activity was observed (for Participant 8, the session lasted
from approximately 4:00pm to 5:00pm).
In ActivityDNA, the activities are grouped into eight categories (the grouping is
includes any activity that results in running the application, and Reading is comprised of
“reading” activities only. Testing/Executing activities do not often have duration since
running the Paint application resulted in opening a new desktop window where actions were
not observable by Mimec (but could be seen in the video recordings). The Navigating
category includes “Switching between source files” and “Other navigation,” Static navigation
includes “Displaying static dependencies” and “Navigating a static dependency, and
Searching includes “Java/file search” and “Find/replace”.
The activity categories are all mutually exclusive for a given point in time. If one
were to flatten the categories into a single line, no part of the line would be made of
overlapping categories. However, not every point in time between the start of the
programming session and the end would necessarily be represented on the line. Most
notably, the user manipulating a running Paint program, performing other activities outside
of Eclipse (such as browsing the Internet), or straightforward idleness would not be captured
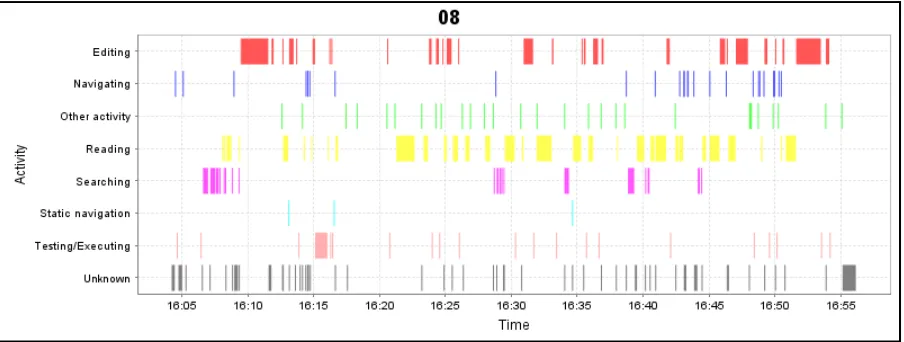
Figure 6. Activity DNA for Participant 8 working on the Paint application
The ActivityDNA for Participant 8 highlights a number of common patterns. The
developer began by executing the program to exercise the behavior described in the task list,
then spent several minutes searching, navigating, and reading before finally editing source
code related to the YELLOW task (see Appendix B). The developer then continued
navigating and reading while collecting more information relevant to the maintenance task,
before finally executing to the code (to test the changes) and refining the solution. This
pattern of behavior is in agreement with the program comprehension of Brooks [4] and the
maintenance theory of Ko [17]. Overall, the developer’s activity pattern is punctuated with
short time intervals of editing interspersed among much more frequent patterns of reading.
Though not an experienced developer according to Table 1, participant 8 was
methodical in searching, relating, and collecting information relevant to the programming
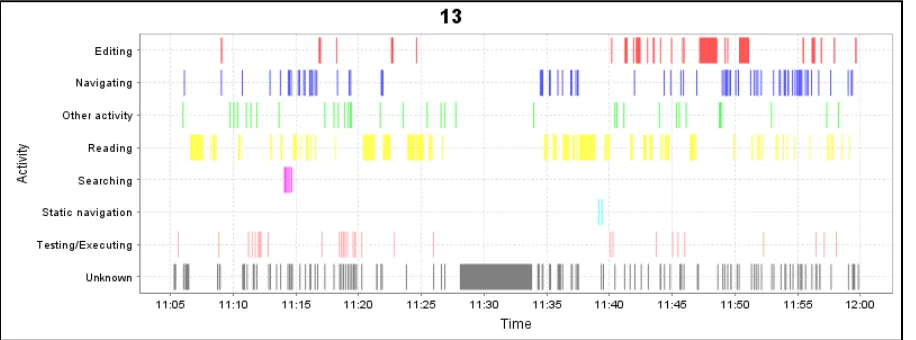
switch between source files and scan them manually. This behavior yielded an almost
“frantic” amount of file switching (particularly near the end of the session), including several
instances where the developer switched between multiple files in a row without reading or
performing any other activity. To further highlight this different, participant 13 spent 16.5%
of the time editing, whereas participant 8 above spent 33.0% of the time editing.
Figure 7. Activity DNA for Participant 13 working on the Paint application
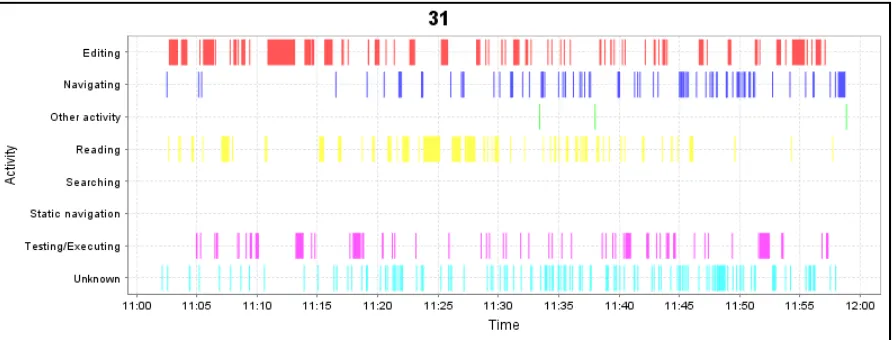
Another notable activity pattern is the classic “code-compile-fix” behavior. This is
best exemplified by participant 31 (Figure 8), who had never used Eclipse and had not
programmed in Java for some time. The participant used none of Eclipse’s searching or
static navigation capabilities, instead switching between source files manually and reading.
At one stage during the session, the developer unintentionally injected an error that caused an
exception to be thrown, which prevented the MedReporter application from running at all.
the code was made, and then the application was executed to see if the behavior changed, and
then this process was iterated over many times. The pattern of edit-execute is prevalent in
the figure below.
Figure 8. Activity DNA for participant 31 working on the MedReporter application
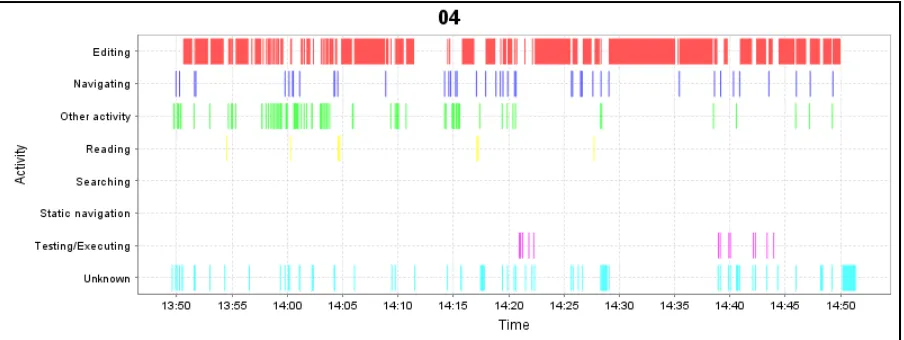
Finally, as a point of comparison, the ActivityDNA for participant 4 is shown in
Figure 9. Participant 4 was engaged in new code development on a separate project from
Paint and MedReporter – the AWARE plug-in for the Eclipse IDE which collects the output
of static analysis tools and provides some. The bulk of participant 4’s activities composed of
creating new Java classes that were used to store data elements. The developer spent over
86% of the time engaged in editing activities. This observation highlights an important
point: the features of one type of activity (such as debugging or enhancement) do not
Figure 9. Activity DNA for Participant 4
This analysis yielded several important findings which provide further justification
and motivation for the study objectives listed at the beginning of Section 3. First, nearly
one-quarter (~24%) of the observed activities were file switches, and over 1.5 navigation
activities were observed per minute5. This indicates that searching for information and
navigating between information sources was a frequently occurring event during the
maintenance tasks. Consequently, the manner in which the participants go about this
navigation and searching may have considerable impact on the time spent on the task overall.
Second, the participant engaged in new development spent a much greater proportion
of time editing (~85% of the time) and much less time reading than the users performing
maintenance tasks. While only a single example, this indicates that an analysis of behaviors
during maintenance tasks, and any subsequent results, recommendations, or conjectures, may
not necessarily be applicable outside of maintenance tasks. This observation provides a
limitation for this study.
Third, the ActivityDNA charts of the participants depict behavior during maintenance
tasks consistent with existing theories of program comprehension [4, 17]. Specifically, users
initially spent time searching for a beacon in the source code relevant to their task, then
searched for and navigated to relevant information from there before finally editing the code.
Finally, different participants exhibited different styles for navigating and searching
for information. Some participants made use of static navigation techniques, while others
relied on switching between file tabs or clicking on elements in the Package Explorer. The
ActivityDNA charts of participants who employed static navigation techniques appeared to
perform less navigation activities than the participants who did not use static navigation.
This observation provides further motivation for studying the effectiveness of different
search and navigation methods in the next subsection.
3.7
Navigation
style
analysis
As observed in Section 3.6, 758 of 1920 labeled activities were search or navigation
related (~39.5%) , indicating that the developers spent considerable effort searching for and
navigating to information necessary to perform their assigned maintenance tasks. Different
developers made use of different navigation and search facilities. Some developers made
greater use of the static navigation facilities in Eclipse, which allowed developers to easily
navigation strategy built upon such relationships was one of the hallmarks of expert
developers in previous studies [1, 22, 27, 41]. In this subsection, the three hypotheses
posited at the beginning of Section 3 are explored in detail:
Hypothesis 1: The amount of time developers spend navigating to collect information
relevant to a maintenance task differs depending on the type of navigation method;
Hypothesis 2: Navigation periods that leverage static code relationships are shorter in
duration than navigation periods employing keyword searching methods;
Hypothesis 3: Navigation periods that incorporate static code relationships are
shorter in duration than navigation periods employing normal navigation
methods;
To gain a more accurate picture of the actual time spent collecting information using
different search and navigation methods, the activity summaries were partitioned into
navigation periods. A navigation period is meant to capture the total amount of effort
expended in looking for relevant source code, including the time spent searching and reading
the code. A navigation period begins when a user initiates a navigation or search-related
task, such as switching to a source file or navigating a static dependency. The period
continues through “Reading” and unlabeled activities. The period ends when the user
engages in a different category of navigation task or performs an activity aside from reading.
For example, a user opening a source file, reading it, then switching to other source files and
reading them, followed by an edit would constitute one navigation period. A user opening a