ISSN(Online): 2319-8753 ISSN (Print) : 2347-6710
I
nternational
J
ournal of
I
nnovative
R
esearch in
S
cience,
E
ngineering and
T
echnology
(An ISO 3297: 2007 Certified Organization)
Vol. 5, Special Issue 13, October 2016
QoS Aware Vertical Handover Decision
Algorithm in Heterogeneous Wireless Network
Partha Sarathi Banerjee1, J. pal Choudhury1, S. R. Bhadrachaudhuri2
Kalyani Govt. Engg. College, Kalyani, West Bengal, India1
IIEST, Shibpur, Howrah, West Bengal, India2
ABSTRACT: The next generation wireless network is characterized by multi-interface terminals and integration of different network interfaces for providing different types of services. In such a heterogeneous environment, the most important issue is Always Best Connected (ABC) concept. It allows the best connectivity to services anywhere any time and ensures optimum level of Quality of Service (QoS). For that, a seamless inter-system handover solution is needed. One of the challenging problems for the vertical handover is the decision for a mobile node to handover between different types of networks. In this paper we propose a multi-criteria vertical handover decision algorithm for heterogeneous wireless network environment where each interface would provide different services as well as constraints. An intelligent approach based on Particle Swarm Optimization (PSO) has been used for the decision of handover to the most suitable network for a particular application.
KEYWORDS: Wireless communication, Quality of Service (QoS), traffic class, Particle Swarm Optimization (PSO),
vertical Handover
I. INTRODUCTION
Technological advancements in the area of wireless communications have provided numerous wireless network technologies such as Bluetooth, Wi-Fi, Wi-Max, GPRS and CDMA. These networks were developed individually to meet specific service requirements. They are distinguished by their own advantages and drawbacks. For example, Wi-Fi networks offers high bandwidths. But due to short coverage provided by Wi-Wi-Fi, it is suitable for short range applications such as internet connectivity from personal computer, or a game console; All these applications are subject to a successful wireless connection.
Third generation cellular networks such as UMTS, GSM and CDMA 2000 provide large coverage but the data rates offered by these networks are limited. Satellite networks offer large coverage but deployment is too expensive to be borne by the normal mobile users. Wi-Max networks which can operate in both licensed and unlicensed frequencies, offer higher bandwidth and greater range as compared to Wi-Fi based wireless systems. But it has the drawbacks of installation and operation costs and lack of quality of service.
All these wireless networks have their own merits and limitations. No single wireless network is there which can serve all types of services with equal quality. Next generation (NG) wireless networks or Heterogeneous wireless networks are the integration of various wireless networks so that the best of each of them can be provided to the user. With this interoperability, the user with its handheld mobile terminal (MT) would have complete flexibility to go for any application of its choice and that too with high QoS rating, so that users’ satisfaction is achieved by means of an Always Best Connected mode [2-4].
ISSN(Online): 2319-8753 ISSN (Print) : 2347-6710
I
nternational
J
ournal of
I
nnovative
R
esearch in
S
cience,
E
ngineering and
T
echnology
(An ISO 3297: 2007 Certified Organization)
Vol. 5, Special Issue 13, October 2016
II. RELATED WORK
Vertical handoff has so far been a wide area of research. Different algorithms considering different aspects of handoff have been proposed in ([1], [5], [6], [9]-[13], [16]). M. Kassar, B. Kervella, and G. Pujolle [5] give an overview of the vertical handoff decision strategies. Qingyang Song, Abbas Jamalipour [6] gives an idea of QoS negotiation when there is a need of vertical handoff. Shantidev Mohanty and Ian F. Akyildiz [7] discuss about cross-layer handoff which is not actually vertical handoff but they provide a good estimation technique of handoff metrics like handoff-failure probability, false-handoff-initiation probability etc. Liu Xia, Ling-ge Jiang and Chen He [11] proposed a novel fuzzy-quantification based vertical handoff algorithm with differential prediction and pre-decision method. They claim their algorithm may solve the ping-pong effect of handoff decision. Dong Ma, Maode Ma [12] derived an evaluation algorithm to estimate the condition of the available network in terms of bandwidth and packet delay. Handover decision was taken based on the result. Wang Nan, Shi Wenxiao, Fan Shaoshuai, Liu Shuxiang [13] used PSO (Particle Swarm Optimization) as a tool to decide about the initial weight assigned to the hidden layer neurons. Vasu, K , Maheshwari, S. ; Mahapatra, S. ; Kumar, C.S. [15] gives a rule based vertical handoff decision algorithm where the fuzzy-rule base system takes the decision about the target network. Jansie McNair, Fang Zhu give a comprehensive survey of vertical handoff strategies in [14]. K. Radhika, and Dr. A. Venugopal Reddy [16] proposed a vertical handoff decision strategy based on game theory.
In all these literatures, especially in ([11], [13]) some weights are assigned to the QoS parameters. The weights are assumed randomly irrespective of any extra emphasis given to the dominating parameter for a particular application. This may lead to QoS degradation.
In this paper a QoS aware PSO based vertical handover decision algorithm has been proposed where effort has been made to assign weights to the QoS parameters depending on their respective importance for a particular application.
III. METHODOLOGY
A. OVERVIEW OF HANDOVER PROCESS AND VERTICAL HANDOVER
Handover is the process of maintaining a user’s active sessions when a mobile terminal changes its connection point to the access network (called ‘‘point of attachment”), for example, a base station or an access point. Depending on the access network that the point of attachment is part of, the handover can be either horizontal or vertical [1]. A horizontal handover takes place between points of attachment supporting the same network technology, for example, between two neighboring WLANs as shown in Figure 1b..
Fig 1a Vertical Handover Fig 1b. Horizontal Handover
ISSN(Online): 2319-8753 ISSN (Print) : 2347-6710
I
nternational
J
ournal of
I
nnovative
R
esearch in
S
cience,
E
ngineering and
T
echnology
(An ISO 3297: 2007 Certified Organization)
Vol. 5, Special Issue 13, October 2016
B. HANDOVER MANAGEMENT PROCESS
There are three steps of handover management processes [5] .They are
Handover Initiation: This phase actually collects the available system information that would be needed for making the decision for handover. The information includes the Received Signal Strength (RSS), available Bandwidth, handover latency and other data from neighboring wireless networks.
Handover Decision: This phase is used to determine whether and how to perform the handover by selecting the most
suitable access network based on the information collected in the Handover Initiation phase. This module gives instructions to the execution phase about the target network for optimum handover. It is also called network or system selection.
Handover Execution: This phase is used to change networks conforming to the details resolved during the decision
phase. This phase incurs some delay due to the actual handover processed.
In this paper an algorithm has been proposed for the second phase, that is, Handover Decision phase.
C. VERTICAL HANDOVER DECISION FUNCTION
The general function of computing the merit figure [6] of network n is
Fn =En
(
n,i)
i
w
iN
p
Where pn,i is the ith QoS factor in network n, wi is its corresponding weight, En is the elimination factor of network n
and N is a normalization function. The value of En is decided by the user’s mobility, service classes and network
characteristics. For example, when the user is in the coverage of WLAN, E = 0 if the user’s velocity is more than 7 km/h (pedestrian’s maximum speed); otherwise, E=1. The purpose of normalization is to combine various QoS factors in the merit function. A logarithm-based normalization method is widely accepted by the researchers. Suppose only bandwidth and delay are considered for comparisons and the weights of these are
w
bandwidth andw
delay. According tothis concept the merit function may be of the following form
( ln ln 1 )
, ,
delay n delay bandwidth
n bandwidth n
n
p w
p w
E
F
1
,
iw
n i where’ i’ are the QoS parameters for the nth networkD. TRAFFIC CLASSES
Conversational Traffic: The typical applications of this class are VoIP and video conferencing. Real-time conversation is always performed between peers (or groups) of live (human) end-users. This is the only traffic where the required QoS characteristics are strictly given by human perception. e.g. VOIP application.
Streaming Traffic: When the user is looking at (listening to) real-time video (audio), the scheme of real-time streams applies. The real-time data flow is always aiming at a live (human) destination. It is a one-way transport. e.g. CBR application.
Interactive Traffic: When the end-user, that is either a machine or a human, is online requesting data from remote equipment (e.g. a server), this type of traffic applies. Examples of human interaction with the remote equipment are: Web browsing, database retrieval, server access. Examples of machines interaction with remote equipment are: polling for measurement records and automatic database enquiries (tele-machines). e.g. MCBR application.
Background Traffic: When the end-user, that typically is a computer, sends and receives data-files in the background, this type of data transmission is called background traffic. Examples are background delivery of e-mails, SMS, download of databases and reception of measurement records. e.g. FTP application
E. PARTICLE SWARM OPTIMIZATION (PSO)
PSO is a population-based stochastic optimization technique, developed by Dr. Eberhart & Dr. Kennedy. The problem is to determine the global optimum (maximum or minimum) of a function of n independent variables x1, x2, x3……, xn
, mathematically represented as
f
(
X
)
, whereX
= x1 ,x2 ,x3 ,...,xn is called the parameter vector. If all components
ISSN(Online): 2319-8753 ISSN (Print) : 2347-6710
I
nternational
J
ournal of
I
nnovative
R
esearch in
S
cience,
E
ngineering and
T
echnology
(An ISO 3297: 2007 Certified Organization)
Vol. 5, Special Issue 13, October 2016
for which the function value f (
X
) is either a minimum or maximum in the search range. PSO is a multi-agent parallel search technique. The initial population consists of a convenient number of “particles”; particles are conceptual entities that “fly” through the multi-dimensional search space as the algorithm progresses.Each particle P has two state variables:
1. Its current position
X
(t)2. Its current velocity
V
(t)The position vector of each particle with respect to the origin of the search space represents a candidate solution of the search problem. Each particle also has a small memory comprising:
1. Its personal best position experienced so far, denoted by
p
(t)2. The global best position found so far, denoted by
g
(t).For each particle, each component of the initial position vector is selected at random from a predetermined search range while each velocity component is initialized by choosing at random from the interval [-Vmax, Vmax] where Vmax is the
maximum possible velocity of any particle in any dimension; the initial settings for
p
(t) andg
(t) are taken asp
(0),g
(0) ,X
(0) for all particles. After the particles are initialized, the iterative optimization process begins, where the positions and velocities of all the particles are altered by the following recursive equations (1) & (2), who for the time being assumed to progress in discret (unit) steps. The equations are presented for the d-th dimension of the position and velocity of the i-th particle.Vid (t+1) = ωVid(t) + C1φ1. (pd(t) –Xid (t)) + C 2 φ2. (gd(t)-Xid(t)) ... ... ... ... ... (1)
Xid (t+1) = Xid (t) + Vid (t+1) ... ... ... ... ... (2)
where the algorithmic parameters are defined as :
ω: inertial weight factor that determines the effect of past velocity on present velocity.
C1,C2 : two constant multiplier terms known as “self confidence” and “swarm confidence” which respectively
determine the influence of
p
(t) andg
(t) on the velocity update formula.Φ1, φ2: two uniformly distributed random numbers.
In this paper weights used in the merit function are optimized so that optimum network is chosen for a particular application. Weights for different parameters would vary with respect to traffic.
IV. IMPLEMENTATION
A. SIMULATION PARAMETERS
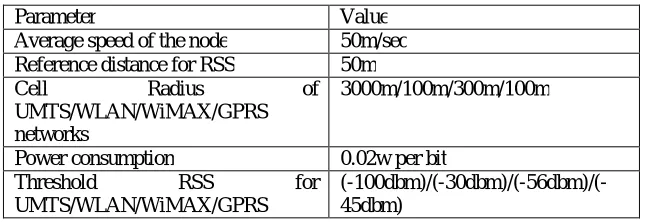
The simulation has been done in MATLAB 2009b. In this paper it is assumed that there are four overlay wireless networks. They are UMTS (Universal Mobile Telecommunication Network), WLAN(Wireless Local Area Network), GPRS (General Packet Radio System) and WiMax. MT is currently located in UMTS. Table 1 shows the simulation parameters details.
Table 1: Simulation Parameters
Parameter Value
Average speed of the node 50m/sec
Reference distance for RSS 50m
Cell Radius of
UMTS/WLAN/WiMAX/GPRS networks
3000m/100m/300m/100m
Power consumption 0.02w per bit
Threshold RSS for
UMTS/WLAN/WiMAX/GPRS
ISSN(Online): 2319-8753 ISSN (Print) : 2347-6710
I
nternational
J
ournal of
I
nnovative
R
esearch in
S
cience,
E
ngineering and
T
echnology
(An ISO 3297: 2007 Certified Organization)
Vol. 5, Special Issue 13, October 2016
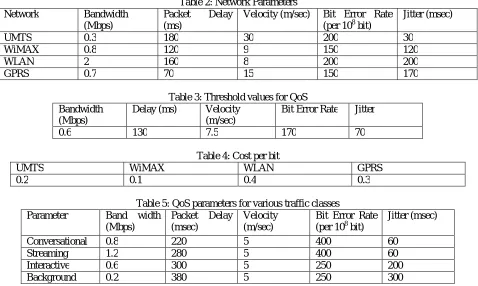
Table 2: Network Parameters
Network Bandwidth
(Mbps)
Packet Delay
(ms)
Velocity (m/sec) Bit Error Rate (per 108 bit)
Jitter (msec)
UMTS 0.3 180 30 200 30
WiMAX 0.8 120 9 150 120
WLAN 2 160 8 200 200
GPRS 0.7 70 15 150 170
Table 3: Threshold values for QoS Bandwidth
(Mbps)
Delay (ms) Velocity
(m/sec)
Bit Error Rate Jitter
0.6 130 7.5 170 70
Table 4: Cost per bit
UMTS WiMAX WLAN GPRS
0.2 0.1 0.4 0.3
Table 5: QoS parameters for various traffic classes
Parameter Band width
(Mbps)
Packet Delay (msec)
Velocity (m/sec)
Bit Error Rate (per 108 bit)
Jitter (msec)
Conversational 0.8 220 5 400 60
Streaming 1.2 280 5 400 60
Interactive 0.6 300 5 250 200
Background 0.2 380 5 250 300
Table 2 is showing the network parameters used in this simulation. Threshold parameters’ values for maintain the minimum level of QoS have been put in table 3. Cost per bit incurred by each type of network used is shown in table 4. Table 5 shows the characteristic parameter values for four traffic classes used in this paper. It is assumed that the MT is moving away from the base station of UMTS with an average speed 50m/sec. Every 5 sec the MT is sampling the received signal strength (RSS) and running the algorithm for taking the handoff decision.
B. QOS AWARE VHO ALGORITHM BASED ON PSO:
The proposed algorithm in this paper can be classified as Mobile Controlled Handoff (MCHO) algorithm. It runs in the following steps.
Step 1:
The node, equipped with multiple interfaces, will compare the RSScurr(Received Signal Strength from the current
network) with the RSSthreshold. If RSScurrent is less than RSSthreshold (mentioned in table 1) of the current network, then the
node (MT) will initiate the handoff procedure . Step 2:
The node, equipped with multiple interfaces, will collect the information about the status of the QoS parameters of the neighboring networks.
Step 3:
The parameter-values obtained on multiple interfaces are associated with different units. They need to be normalized so that they can be uniformly represented in scale [0 1]. For this purpose Eqn. 3 is used.
w
i,n= (Puser - QoSthreshold) / (Pnetwork - QoSthreshold) ………Eqn. 3Where,
a) Set of parameter values required by the user(Puser)
ISSN(Online): 2319-8753 ISSN (Print) : 2347-6710
I
nternational
J
ournal of
I
nnovative
R
esearch in
S
cience,
E
ngineering and
T
echnology
(An ISO 3297: 2007 Certified Organization)
Vol. 5, Special Issue 13, October 2016
c) Set of parameter values required for maintain a threshold quality of service below which the service will be disrupted. (QoSthreshold)
Table 2, table 3 and table 5 are used for this purpose. The resulted table after the normalization process is shown in table 6. Each row in the table 5 is considered as Puser
Table 6: Weight Matrix (
w
i,n)Network Bandwidth (Mbps) Packet Delay (ms) Velocity (m/sec) Bit Error Rate
(per 108 bit) Jitter (msec)
UMTS 0.304569 0.101523 0.182741 0.182741 0.228426
WiMAX 0.140008 0.114552 0.113292 0.113292 0.518855
WLAN 0.225303 0.121317 0.262854 0.075101 0.315425
GPRS 0.212312 0.137378 0.155695 0.069992 0.424623
Step 4:
PSO has been applied on the weight matrix. The aim is to maximize the objective function (Eqn. 4) subject to the condition that ∑
w
i,n=1. Following merit function has been has been considered as objective function or fitnessfunction of PSO.
)
ln(
max
,
,n in
i
n
w
X
E
F
……….Eqn. 4Such that ∑
w
i,n=1Where
X
i,nis the ith parameter of nth network under consideration. If the parameter leaves a positive effect on theQuality of Service then
ln(
X
i,n)
is positive else it is negative [14].w
i,nis the weight assigned for the parametern i
X
, .Step 4:
n
E
is the elimination factor.E
n depends on the difference of QoSthreshold and Pnetwork. If Pnetwork is greater thanQoSthreshold then
E
n is 1 otherwiseE
n is 0.E
n actually indicates that whether the network in consideration is qualifiedas target network for the particular application. Puser , QoSthreshold and Pnetwork are vectors consisting of [bandwidth, delay
supported, power consumption, bit error rate, jitter ].
w
i,n gives values less than one but summation ofw
i,n is 1. Theweight matrix formed with these
w
i,n values are taken as the initial values to be used in PSO. The aim is to find theoptimal set of weights for the network-parameters so that the objective function is maximized and at the same time the fittest network is selected as target of handoff. The fittest network would be associated with the optimum value of the objective function (Eqn. 4).
Step 5:
Outline of PSO based vertical handoff decision algorithm is as follows:
ISSN(Online): 2319-8753 ISSN (Print) : 2347-6710
I
nternational
J
ournal of
I
nnovative
R
esearch in
S
cience,
E
ngineering and
T
echnology
(An ISO 3297: 2007 Certified Organization)
Vol. 5, Special Issue 13, October 2016
Where r1 and r2 are random numbers between 0 and 1,
s
minis the vector of lower bound ands
maxis thevector of upper bound.
ii) Fitness value of the optimization process of the candidate solution is calculated
iii) The local best value (pbest) is searched from the fitness values hitherto calculated. The position vector
corresponding to the pbest is found i.e the parameter values corresponding to the fitness value
iv) Now the global best fitness value is obtained and designated as gbest.
v) For each particle the velocity is calculated according to (1) where
can be calculated as proposed by Shi andEberhart [17][18]
current
start
end
enditer
iter
iter
max
max
)
*
(
)
(
iter
maxis the maximum number of iteration of PSO.iter
current is the current value of the iteration.
start and
end are taken to 0.9 and 0.4 respectively. The ‘trust’ parameters c1 and c2 are assumed tobe of value 2 in (1). Position of the particles are updated according to (2).
vi) The stopping criteria considered here are the number of iteration and the minimum value of fitness obtained from QoSthreshold, whichever is reached erlier.
Step 6: PSO suggests about the fittest target network for handoff. This suggestion is passed to the handoff execution phase which actually prepares the system for handoff.
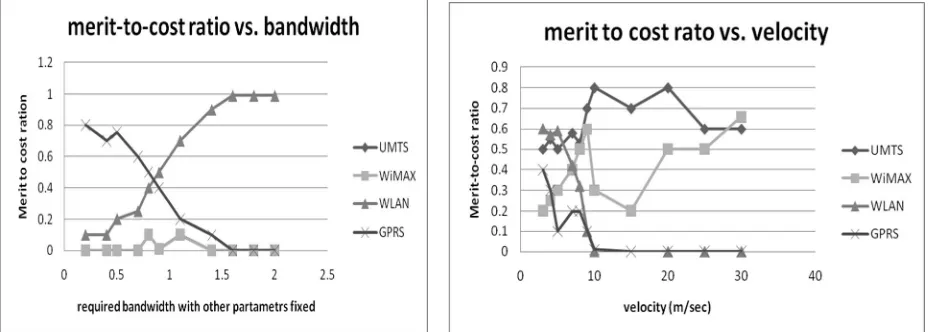
V. RESULTS
One metric called “merit-to-cost ratio” (MCR) is used for comparison of acceptability of different target networks for different traffic classes.
MCR=
network
by the
incurred
bit
per
cost
network
fittest
the
to
ing
correspond
PSO
in
function
objective
or
function
merit
the
of
value
The normalized value of this metric is used in the following figures to show the acceptability of a network on the basis of varying requirement. High value of the metric indicates more acceptability. It is seen from Fig. 2 that for conversational traffic the merit-to-cost-ratio is highest for the WLAN network provided that the velocity is less than 8km/h. The metric gives maximum value for GPRS when the application type resembles background traffic (Fig. 4). For streaming traffic UMTS network is selected if bandwidth requirement is not very high as seen Fig. 4. This is the network which supports maximum speed of the Mobile Terminal.
ISSN(Online): 2319-8753 ISSN (Print) : 2347-6710
I
nternational
J
ournal of
I
nnovative
R
esearch in
S
cience,
E
ngineering and
T
echnology
(An ISO 3297: 2007 Certified Organization)
Vol. 5, Special Issue 13, October 2016
Fig.4 : Packet delay vs merit-to-cost ratio for background traffic Fig. 5: Handoff-failure probability with varying speed of MT
The proposed algorithm is compared with the algorithm based on fuzzy rule based vertical handoff decision algorithm [15]. It is found that with increasing speed of the mobile terminal (MT) leads to a higher probability of handoff failure. Considering this aspect, it is found from Fig. 5 that the two algorithms perform almost similarly when the speed is beyond 55m/sec. The PSO based algorithm performs better below that speed. But if we consider memory requirement of an algorithm as its performance metric then the PSO based algorithm will surely outperform the fuzzy-rule based algorithm. The fuzzy-rule base system will show an exponential increase in the requirement of memory space with addition of every new QoS parameter, whereas in the PSO based algorithm every additional parameter will add an extra column of the parameter matrix.
VI. CONCLUSION
In the PSO based algorithm considered in the present paper only five QoS parameters and four probable type of networks are considered. There remains a huge set of different networks with varied range of parameters which need to be considered for a real life implementation of the algorithm. It is found that the handoff failure probability actually depends on the number of iteration of PSO algorithm. Effort is being made to make a tradeoff between these two aspects of the algorithm so that the handoff failure probability may be independent of the iteration of PSO.
RFERENCES
[1] F. Zhu and J. McNair. “Multiservice vertical handover decision algorithms”, EURASIP Journal on Wireless Communications and Networking, 2006(2):52, April 2006.
[2] Jonathan Rodriguez et al.,” A Middleware Architecture Supporting Seamless Secure Multimedia Services Across an Inter Technology Radio Access Network”, IEEE Wireless Communications, pp24-31, October 2009.
[3] E. Dahlman et al., “3G Evolution: HSPA and LTE for Mobile Broadband”, Elsevier, 2007.
[4] I. Akyldiz, J.Xie and S. Mohant, “A survey of Mobility Management in Next-Generation All- IP-Based Cellular Systems”, IEEE Wireless Communications, August 2004.
[5] M. Kassar, B. Kervella, and G. Pujolle, “An overview of vertical handover decision strategies in heterogeneous wireless networks”, Computer Communications, 31(10):2607–2620, 2008.
[6] Qingyang Song, Abbas Jamalipour,” A quality of service negotiation-based vertica handoff decision scheme in heterogeneous wireless systems”,Europian Journal of Operational Research, Elsevier, July, 2007
[7] Shantidev Mohanty and Ian F. Akyildiz, “A Cross-Layer (Layer 2 + 3) Handoff management Protocol for Next-Generation Wireless Systems”
IEEE TRANSACTIONS ON MOBILE COMPUTING, VOL. 5, NO. 10, OCTOBER 2006
[8] H.J. Wang, R. H. Katz, and J. Giese, “Policy-Enabled Handoffs across Heterogeneous Wireless Networks,” Proc. of ACM WMCSA, 1999 [9] Pramod Goyal, and S. K. Saxena, “A Dynamic Decision Model for Vertical Handoffs across Heterogeneous Wireless Networks”, World Academy of Science, Engineering and Technology 41 2008
ISSN(Online): 2319-8753 ISSN (Print) : 2347-6710
I
nternational
J
ournal of
I
nnovative
R
esearch in
S
cience,
E
ngineering and
T
echnology
(An ISO 3297: 2007 Certified Organization)
Vol. 5, Special Issue 13, October 2016
[11] Liu Xia, Ling-ge Jiang and Chen He, “A Novel Fuzzy Logic Vertical Handoff Algorithm With Aid of Differential Prediction and Pre-Decision Method”, ICC 2007 proceedings.
[12] Dong Ma, Maode Ma, “A QoS Oriented Vertical Handoff Scheme for WiMAX/WLAN Overlay Networks”, IEEE TRANSACTIONS ON PARALLEL AND DISTRIBUTED SYSTEMS, VOL. 23, NO. 4, APRIL 2012
[13] Wang Nan, Shi Wenxiao, Fan Shaoshuai, Liu Shuxiang, “PSO-FNN-based Vertical Handoff Decision Algorithm in Heterogeneous Wireless Networks”, Procedia Environmental Sciences 11 (2011) 55 – 62, ELSEVIER
[14] Jansie McNair, Fang Zhu “Vertical Handoff in fourth-Generation Multinetwork Environments”, IEEE Wireless Communications, pp. 8-15, June, 2004
[15] Vasu, K , Maheshwari, S. ; Mahapatra, S. ; Kumar, C.S. ”QoS aware fuzzy rule based vertical handoff decision algorithm for wireless heterogeneous networks”, Proceedings of National Conference on Communications (NCC), 28-30 Jan. 2011
[16] K. Radhika, Dr. A. Venugopal Reddy “Vertical Handoff Decision using Game Theory Approach for Multi-mode Mobile Terminals in Next Generation Wireless Networks”, International Journal of Computer Applications(IJCA) (0975 – 8887) Volume 36– No.11, December 2011 [17] Y. Shi and R. C. Eberhart, “A modified particle swarm optimizer,” Proc. IEEE Int. Conf. Evol. Comp., Alaska, May, 1998