CHOI, WONCHANG. Flexural Behavior of Prestressed Girder with High Strength Concrete. (Under the direction of Dr. Sami Rizkalla)
By Wonchang Choi
A dissertation submitted to the Graduate Faculty of North Carolina State University
in partial fulfillment of the requirement for the degree of
Doctor of Philosophy Civil Engineering
Raleigh, North Carolina 2006
Approved by:
Dr. Sami Rizkalla
Chair of Advisory Committee Civil Engineering
Dr. Paul Zia
Advisory Committee Civil Engineering
Dr. Amir Mirmiran Advisory Committee Civil Engineering
Wonchang Choi obtained a Bachelor’s Degree in Chemistry from Kyung Hee University, and a second Bachelor’s Degree in Civil Engineering from Hongik University, Seoul Korea. He continued his studies in structures and completed research with the use fiber reinforced polymer girder for compression members, completing his Master’s Degree in 2002.
It would have been impossible to complete this dissertation without the intellectual,
emotional and financial support and friendship of my advisor, my colleague and my family.
It is with sincere gratitude that I thank my advisor, Dr. Sami Rizkalla, for his continuous supervision and mentoring. I would also like to thank Dr. Paul Zia for providing valuable insight. It is truly an honor to work with such an outstanding man who is willing to share his wealth of knowledge and his extensive personal experience. Thanks are extended to Dr. Amir Mirmiran for providing an opportunity to join this research program.
The technical assistance provided by the staff of the Constructed Facilities Laboratory (Bill Dunleavy, Jerry Atkinson, and Amy Yonai) are greatly appreciated. Thanks are extended to all of my fellow graduate students at the Constructed Facilities Laboratory for their help and friendship. Special thanks are extended to Mina Dawood, as my officemate who was a tremendous help to encourage me.
And lastly, I sincerely thank my parent and my lovely wife. I couldn’t imagine standing here without their unconditional love and support.
LIST OF FIGURES ...v
LIST OF TABLES ...vii
1 INTRODUCTION ...1
1.1 GENERAL...1
1.2 OBJECTIVES...2
1.3 SCOPE...3
2 LITERATURE REVIEW ...6
2.1 INTRODUCTION...6
2.2 MATERIAL PROPERTIES...8
2.3 STRESS BLOCK PARAMETERS... 12
2.4 PRESTRESS LOSSES... 14
2.5 FLEXURAL BEHAVIOR OF GIRDERS WITH HIGH STRENGTH CONCRETE... 16
3 EXPERIMENTAL PROGRAM ... 18
3.1 INTRODUCTION... 18
3.2 DESIGN OF THE TEST SPECIMENS... 18
3.3 FABRICATION OF TEST SPECIMENS... 22
3.4 INSTRUMENTATION... 29
3.5 MATERIAL PROPERTIES... 35
3.6 FLEXURAL TEST DETAILS... 45
4 RESULTS AND DISCUSSION ... 54
4.1 INTRODUCTION... 54
4.2 MATERIAL PROPERTIES STUDY... 55
4.3 PRESTRESS LOSSES... 65
4.4 TRANSFER LENGTH... 72
4.5 CAMBER... 74
4.6 FLEXURAL RESPONSE... 75
5 ANALYTICAL MODEL ... 100
5.1 INTRODUCTION... 100
5.2 CODE PROVISONS... 101
5.3 SECTION ANALYSIS... 120
6 SUMMARY AND CONCLUSIONS... 135
6.1 SUMMARY... 135
6.2 CONCLUSIONS... 136
Figure 3-2 Prestressing bed: a) Elevation schematic view of prestressing bed, b) Strand
lay-out, c) Pretensioning ... 24
Figure 3-3 Sequence of girder fabrication... 26
Figure 3-4 Formwork for the 5 ft. and 1 ft. wide deck slabs ... 28
Figure 3-5 Load cell installation ... 30
Figure 3-6 Locations of weldable strain gauges ... 33
Figure 3-7 Installation of weldable strain gauge ... 34
Figure 3-8 Installation of the strain gauges attached to #3 steel rebar... 35
Figure 3-9 Specimen preparation and test set-up for elastic modulus ... 39
Figure 3-10 Test set-up for elastic modulus and modulus of rupture ... 40
Figure 3-11 Material property for prestressing strand ... 44
Figure 3-12 Test set-up schematic ... 45
Figure 3-13 Typical test set-up for nine AASHTO girder specimens ... 46
Figure 3-14 Location of LMTs to measure deflections... 49
Figure 3-15 Location of Strain and PI gages for 10PS – 5S, 14PS- 5S and 18PS-5S ... 50
Figure 3-16 Location of Strain and PI gages for 10PS–1S, 14PS-1S and 18PS-1S ... 51
Figure 3-17 Location of Strain and PI gages for 10PS-N, 14PS–N and 18PS-N... 53
Figure 4-1 Comparison of the elastic modulus between test results and predicted value... 57
Figure 4-2 Comparison between predicted E and measured E with various equations; a) AASHTO LRFD and ACI318; b)ACI363R; c) Cook’s; d) Proposed ... 59
Figure 4-3 Normal distribution for the ratio of predicted to measured elastic modulus... 62
Figure 4-4 Modulus of rupture versus compressive strength ... 64
Figure 4-5 Load-deflection behavior for 10, 14, 18PS-5S ... 76
Figure 4-6 Strain envelopes for 18PS-5S ... 78
Figure 4-7 Moment – N.A. depth location for 10PS – 5S, 14PS – 5S and 18PS – 5S ... 80
Figure 4-8 Typical failure mode for the AASHTO girder with a 5 ft. wide deck ... 81
Figure 4-9 Load-deflection behavior for 10PS – 1S, 14PS – 1S and 18PS-1S ... 84
Figure 4-10 Strain envelopes for 10PS-1S ... 86
Figure 4-11 Moment – N.A. depth location for 10PS – 1S, 14PS – 1S and 18PS – 1S ... 88
Figure 4-12 Typical failure modes for the AASHTO girder with a 1 ft. wide deck... 90
Figure 4-13 Load-deflection behavior for 10PS - N, 14PS – N and 18PS-N... 92
Figure 4-14 Strain envelopes for 18PS-N ... 94
Figure 4-15 Moment – N.A. depth location for 10PS - N, 14PS – N and 18PS - N ... 96
Figure 4-16 Typical failure modes for the AASHTO girder without deck ... 97
Figure 4-17 Ultimate strain at peak load for tested AASHTO girders ... 99
Figure 5-1 Cracking strength ratio for three different calculations ... 104
Figure 5-4 Compressive stress distribution (a) cross-section; (b) strain compatibility; (c) measured strain-stress distribution in compression zone; (d) the equivalent
rectangular stress block ... 116
Figure 5-5 Failure evaluation for each configuration ... 118
Figure 5-6 Cross-section and assumed strain profile for 18PS - 5S ... 121
Figure 5-7 Measured stress-strain behavior of 10PS-5S and a best-fit curve with analytical model... 124
Figure 5-8 Definition of the four factors adopted from Collins (1997) ... 127
Figure 5-9 Analytical modeling of the prestressing strand ... 127
Figure 5-10 Measured and predicted load deflection responses... 130
Figure 5-11 Measured and predicted load deflection responses... 131
Figure 5-12 Measured and predicted load deflection responses... 132
Table 3.2 Construction Sequence Summary ... 23
Table 3.3 Measured Data from Load Cells ... 31
Table 3.4 Order of Prestressing Strands and Elongation ... 32
Table 3.5 Detailed Mix Design for Girder Specimens... 36
Table 3.6 Concrete Properties for Girder Specimens... 37
Table 3.7 Concrete Mix Design for Deck Slab... 38
Table 3.8 Concrete Properties for Cast-in-place Deck... 38
Table 3.9 Test Results for Material Properties ... 42
Table 3.10 Compressive Strength Test for Deck Concrete ... 42
Table 3.11 Material Property for Each AASHTO Girder Specimen ... 43
Table 4.1 Range of the Collected Data ... 58
Table 4.2 Results of Statistical Analysis ... 61
Table 4.3 Elastic Shortening at Transfer ... 68
Table 4.4 Creep and Shrinkage Prediction Relationships by AASHTO LRFD ... 70
Table 4.5 Test Results for Prestressed Losses at Test Day ... 71
Table 4.6 Summary of End Slippage and Transfer Length ... 73
Table 4.7 Summary of Camber Results ... 74
Table 4.8 Observed Test Results for 10PS–5S, 14PS–5S and 18PS-5S... 76
Table 4.9 Observed Test Results for 10PS-1S, 14PS–1S and 18PS-1S... 84
Table 4.10 Observed Test Results for 10PS-N, 14PS–N and 18PS-N ... 93
Table 5.1 Comparison between Observed and Computed Cracking Strength ... 103
Table 5.2 Calculation Method for the Flexural Strength ... 106
Table 5.3 Comparison of Design Calculation ... 110
Table 5.4 Design Calculations for Composite AASHTO Girders... 112
Table 5.5 Design Calculation for Composite AASHTO Girders ... 115
Table 5.6 Design Calculation for AASHTO Girders without a Deck ... 117
Table 5.7 Failure Evaluation for All Specimens... 119
1 INTRODUCTION
1.1 GENERAL
1.1.1 High Performance versus High Strength Concrete
The performance of concrete has been improved through the use of chemical and mineral admixtures such as fly ash, slag, silica fume, and high-range water reducing agents. These admixtures have the potential to influence particular properties of concrete and, as such, influence the compressive strength, control of hardening rate, workability, and durability of the concrete. Thus, more rigid criteria are needed to define the performance of concrete.
Zia (1991), in a study undertaken through the Strategic Highway Research Program (SHRP), defines high performance concrete (HPC) by using three requirements: a maximum water-cementitious ratio less than 0.35; a minimum durability factor of 80 percent, and a minimum compressive strength. Russell (1999) states that HPC in the ACI definition is that “concrete meeting special combinations of performance and uniformity requirements that cannot always be achieved routinely using conventional constituents and normal mixing, placing, and curing practices.” Neville (4th Edition) specifies that HPC includes two major properties, high compressive strength and low permeability.
The term, high performance concrete, may be a more comprehensive expression than high
strength concrete. However, this project focuses on the behavior of high compressive
strength. Therefore, instead of high performance concrete, the term, high strength concrete
1.1.2 High Strength Concrete
Research by Carasquillo et al. (1981) on HSC highlighted the uncertainty and potential inaccuracy of using current code provisions that have been developed for normal concrete strength. Accordingly, several studies have been conducted to gain a better understanding of HSC flexural members including prestressed concrete girders. However, the definition and boundaries of HSC contain too many ambiguities to specify stringent conditions. Therefore, many specifications mainly specify the compressive strength for HSC. According to the ACI 363R State-of the Art Report on High Strength Concrete (1992), the definition of HSC is based on the compressive strength of 6,000 psi (41 MPa) or greater at the age of 28-day. However, one must note that the definition of HSC has changed over the years and will no doubt continue to change.
1.2 OBJECTIVES
The main objective of this research is to evaluate the behavior of prestressed concrete girder with high strength concrete with and without a cast-in-place normal strength deck slab. The specific objective can be summarized as follows:
needs for reassessment of the material properties of HSC using more accurate test results.
2. This research program proposes to validate the analytical models typically used to determine the flexural response of prestressed HSC AASHTO type girders with and without a cast-in-place normal strength deck. The intent of the tests is to validate the use of stress block parameters in calculating the flexural resistance of flanged sections with HSC. This experiment also investigates the effect of the presence of normal strength deck in composite action with HSC girders.
3. Evaluate the applicability of the current code equations to predict the prestress losses in HSC girders, including recently proposed equations by Tadors (2003), based on the measured prestress losses of prestressed concrete girders.
4. Provide recommendations for the design of prestressed concrete girders with HSC.
1.3 SCOPE
To study the behavior and prestress loss of prestressed high strength concrete girder, a total of nine AASHTO type II girders were tested with and without normal strength concrete deck slab.
Three girders were cast without a concrete deck. Therefore, the entire section consists of HSC only. The rest of the girders were cast with a concrete deck. The concrete decks were cast at the Constructed Facilities Laboratory (CFL) at North Carolina State University, Raleigh, NC after the girders were fabricated. The design concrete strengths for the nine girders ranged from 10,000 psi (69 MPa) to 18,000 psi (124 MPa). The concrete strength of the cast-in-place deck was in the range of 4,000 psi (28 MPa).
The flexural response of the prestressed girders was investigated in a three-phase experimental research program. In the first phase, three HSC AASHTO with three different target strength and a cast-in-place NSC deck were fabricated. This allowed the compression zone will be located within the NSC deck slab. In the second phase, included three prestressed girders with HSC and the narrow width cast-in-place NSC deck. Therefore, the compression zone consists of HSC and NSC. In the third phase, three prestressed girder with HSC without deck slab was subjected to flexure to study the behavior when the entire compression zone consisted of HSC only.
The nine girders were extensively instrumented to measure the different limit states including cracking and deflections at various loading stages, as well as prestress losses measurements.
Chapter 2 of this thesis presents a relevant literature review of the flexural behavior of prestressed AASHTO girders with HSC. The literature review includes material properties, stress block parameters, prestress losses, and the flexural behavior of HSC girders.
Chapter 3 of this thesis describes in details the experimental program, including design considerations, fabrication procedures of the prestressed AASHTO girders, instrumentation, the flexural test setup, and separate test results for each phase.
Chapter 4 summarizes the test results and discussion the material properties, transfer length, prestress losses and flexural response of the tested girders under static loading conditions.
Chapter 5 presents the analytical model for the flexural behavior of the prestressed concrete girders using HSC. A comparison of the measured and computed values is discussed.
2 LITERATURE REVIEW
2.1 INTRODUCTION
High strength concrete has been used and studied as a workable construction material for several decades. In the United States, HSC was applied to major prestressed girders in 1949. Walnut Lane Bridge in Philadelphia was the first bridge reported to use HSC in its design and construction (Russell, 1997). This bridge was constructed with a 160 ft. center main span with two 74 ft. side spans. The required strength of 5,400 psi (37 MPa) was obtained in 14 to 17 days. Zollman (1951) reported that the compressive strength at 28 days was usually high about 6,500 psi (45 MPa). ACI 363R-97 notes that concrete with a compressive strength of 5,000 psi (34 MPa) was considered to be HSC in the 1950s. However, at about that same time, the introduction of prestress design methods would have been considered to be more remarkable than the use of HSC. The development of high-range water reducing admixtures in the 1960s and further improvements of material technology increased the possibilities for HSC production in the construction industry.
Additional research (Law and Rasoulian, 1980; Cook, 1989; Adelamn and Cousins, 1990) shows that concrete compressive strength in excess of 10,000 psi (69 MPa) using regional materials can be produced by the construction industry. In addition to mix design development, an increase in concrete design compressive strength, from 6,000 psi (41 MPa) to 10,000 psi (69 MPa), results in an average 10 percent increase in span capability for prestressed girders used in routine bridge design (Adelamn and Cousins, 1990). For this type of bridge construction, it has been shown that an increase in concrete strength and stiffness can also result in increased cost effectiveness.
Concrete with a compressive strength of 10,000 psi (69 MPa) can now be routinely produced commercially. Based on HSC’s advantages, the application of prestressed girders with HSC has increased in the United States. Moreover, the need for a reassessment of current design code has broadened.
2.2 MATERIAL PROPERTIES
The material properties of HSC constitute the essential factors in the design and analysis of longer bridge spans due to the increasing use of HSC in such bridge design. A more accurate prediction methodology for the material properties of HSC is required to determine prestress losses, deflection and camber, etc. Many researchers have proposed methods for the prediction of material properties for HSC. This section addresses the major findings related to the material properties for HSC.
2.2.1 Pauw (1960)
The ACI Committee 318 Building Code (ACI 318-77) has accepted the findings of Pauw (1960) for the elastic modulus. Pauw utilized other researchers’ test results for the modulus of elasticity and derived the empirical equation for normal-weight concrete by using the least squares method based on a function of the unit weight and compressive strength of concrete. The proposed empirical modulus of elasticity, Ec, equation shows good agreement for the
normal-weight concrete. These equations are recommended in the current ACI 318 Building Code and in the AASHTO LRFD specifications. They are given as:
( )
0.5 5. 1
33 c
c w f
E = ⋅ ⋅ ′ (psi) and Equation 2-1
( )
0.5 5. 1
043 .
0 c
c w f
E = ⋅ ⋅ ′
(MPa) , Equation 2-2
where
wc = dry unit weight of concrete at time of test;
2.2.2 Carasquillo et al. (1981)
Research into HSC was conducted at Cornell University by Carasquillo et al. (1981). The ACI Committee 363’s State-of-the-Art Report of High-Strength Concrete (ACI 363R-84 1984) accepted the findings of their research as well as their proposed equations for the elastic modulus and the modulus of rupture for HSC. The Carasquillo team investigated the compressive concrete strength range from about 3,000 to 11,000 psi (21 to 76 MPa). Carasquillo et al. suggested that the ACI 318-77 equations, based on the proposal of Pauw (1960), overestimate the modulus of elasticity for HSC ranging from 6,000 psi (41 MPa) or more because the stiffness of the concrete is due to a combination of mortar and aggregate strength. The Carasquillo study also discusses the effects of coarse aggregate type and proportions on the modulus of rupture and the modulus of elasticity. However, no consideration was given to the effects of the use of different aggregates on the modulus. Regarding the Poisson’s ratio of concrete, Carasquillo et al. state that the value of Poisson’s ratio of concrete is close to 0.2 regardless of the compressive strength or the age of the test. Currently, ACI 363R-97 relates these properties to the specified compressive strength ranging from 3,000 psi (21 MPa) to 12,000 psi (83 MPa) and still accepts the Carasquillo research results. The equations are given below for the elastic modulus, Ec and modulus of
rupture, fr are;
( )
[
0.5 6]
(
)
1.5145 10
000 ,
40 c c
c f w
E = ⋅ ′ + ⋅ (psi), Equation 2-3
( )
[
0.5]
(
)
1.52320 6900
320 ,
3 c c
c f w
E = ⋅ ′ + ⋅
(Mpa), Equation 2-4
c
r f
c
r f
f =0.94 ′ (Mpa) Equation 2-6
2.2.3 Ahmad and Shah (1985)
Empirical equations for the material properties of HSC were derived from experimental data from other researchers. The research of Ahmad and Shah is limited to compressive concrete strength up to 12,000 psi (84 MPa). Ahmad and Shah found that the difference in the characteristics of the stress-strain curve between NSC and HSC is significant. They also stated that the modulus of rupture of HSC in ACI318-83 is very conservative, while the modulus of elasticity in ACI318-83 computes 20 percent higher values. Ahmad and Shah suggested new equations for the modulus of rupture and the modulus of elasticity of HSC. The equations are given below as reference.
( )
0.325 5. 2
c c
c w f
E = ⋅ ′
(psi) , Equation 2-7
( )
0.325 5. 2 5
10 385 .
3 c c
c w f
E = ⋅ − ⋅ ⋅ ′
(MPa), Equation 2-8
( )
232 c
r f
f = ′
(psi) and Equation 2-9
( )
2338 .
0 c
r f
f = ′
(MPa). Equation 2-10
2.2.4 Zia et al. (1993)
from 8,080 to 13,420 psi (55.7 to 92.5 MPa). Based on Zia et al.’s research findings, the test results correlate well with the ACI 318 equation for the elastic modulus, which is similar to the AASHTO LRFD. Zia et al. (1993) found that the equation in ACI 363R, developed by Carasquillo et al. (1981), underestimates the measured elastic modulus. For the modulus of rupture, they found that at the design age, the ratio of the observed value to the value predicted by ACI 318 is 1.06 for concrete made with fly ash and 1.15 for concrete made with silica fume. In a comparison of the modulus rupture between the measured values and those predicted by ACI 363R, the ratio is as low as 0.68.
2.2.5 Mokhtarzadeh and French (2000)
2.3 STRESS BLOCK PARAMETERS
The equivalent rectangular stress block has been widely used to determine the ultimate flexural strength of reinforced and prestressed beams and columns. Through the application of ultimate strength design theory, stress block parameters have been developed to make equivalent rectangular stress blocks that can simplify the actual stress distribution. The proposed stress block by many researches are given in Appendix A. This section presents major findings in the use of stress block parameters for predicting the ultimate flexural strength.
2.3.1 Mattock et al. (1961)
The ACI 318 and AASHTO LRFD specifications regarding the use of stress block parameters to compute flexural strength were originally developed by Mattock et al. (1961). The Mattock research used studies previously conducted by Whiney (1937) and Hognestad et al. (1995) as reference. Mattock et al. suggested the use of stress block parameters, α1 and β1,
to determine ultimate strength and α1 is taken as 0.85 of the cylinder strength; β1 is taken as
2.3.2 Nedderman (1973)
In Nedderman’s research (1973), plain concrete columns with compressive strengths up to 14,000 (98 MPa) were tested under eccentric loading conditions. Nedderman suggests that the depth of the stress block, β1 in ACI318 (ACI 318, 1971), becomes an unrealistic value at
a compressive concrete strength of 21,000 psi (147 MPa). This research also proposes the lower limits of β1 to be 0.7 with a compressive concrete strength higher than 7,000 psi (49
MPa).
2.3.3 Ibrahim et al. (1996, 1997)
In the Ibrahim research, 20 HSC columns up to 14,500 psi (100 MPa) and UHSC with the compressive concrete strength over 14,500 psi were tested that incorporates concrete strength, confinement steel, and the shape of the compression zone. The test specimens consisted of fourteen shaped sections with a rectangular cross-section and six C-shaped sections with a triangular section. A better understanding of the flexural behavior of HSC and UHSC sections without confinement or with less confinement than required in seismic regions was also sought in this test. The Ibrahim study concluded that the ACI stress block parameters (ACI 318, 1989) overestimate the moment capacity of HSC and UHSC columns in compression. The researchers proposed new stress block parameters, as follows:
c c
f
f ′
≥ ′ −
= 0.725
800 85 . 0
1
α
(MPa) and Equation 2-11
c c
f
f ′
≥ ′ −
= 0.70
400 95 . 0
1
β
2.4 PRESTRESS LOSSES
Concrete is a time-dependent material. In particular, concrete experiences creep under a sustained load and experiences shrinkage due to changes in moisture content. These physical changes increase over time. The prestress losses due to concrete creep and shrinkage result in the loss of compressive force onto the concrete. Ngab et al. (1981) measured less creep and slightly more shrinkage of HSC in comparison to NSC. The creep coefficient for HSC was 50 to 70 percent that of NSC. In a similar study, Nilson (1985) found that the ultimate creep coefficient for HSC is much less than that of NSC. This section describes findings regarding the prestress losses of full-size prestressed girders with HSC.
2.4.1 Roller et al. (1995)
A project undertaken in Louisiana investigated prestress losses in HSC girders. Two bulb-tee sections, 70 ft. (21.3 m) long and 54 in. (1372 mm) deep and designed according to AASHTO standard specifications (AASHTO 1992), were tested for long-term study. The design compressive strength at 28 days for the girders’ concrete and releasing strength was 10,000 psi (69MPa) and 6000 psi (41 MPa), respectively. The concrete strain due to prestress losses of the girders was measured using internal Carlson strain meters under the full design dead load for 18 months. Roller et al. concluded that concrete strains measured at 28 days indicate that prestress losses are significantly less that the losses calculated using the provisions found in the AASHTO standard specifications.
2.4.2 Tadros (2003)
pretensioned HSC. Tadros’ research included a review of the extensive relevant literature to determine the applicable range of concrete strengths for the AASHTO (2003) provisions for estimating prestress losses in pretensioned concrete bridge girders. Based on this information, Tadros investigated the affecting factors, such as material properties, curing, exposure, and loading conditions. He concluded that the AASHTO LRFD (2003) refined method overestimates creep because it ignores the reduction in the creep coefficient associated with the increase in concrete strength. Tadros proposed new equations for each parameter to calculate the creep coefficient and shrinkage of HSC. His research results are included in the current AASHTO LRFD specifications (2004).
2.4.3 Waldron (2004)
2.5 FLEXURAL BEHAVIOR OF GIRDERS WITH HIGH STRENGTH CONCRETE
The principle for determining flexural response has been well established by using equilibrium of force and strain compatibility conditions. As described in the literature, due to the different material characteristics of HSC, as compared to conventional strength concrete, the flexural behavior, including prestress losses, transfer length, load-deflection relationship, camber, ultimate flexural strength, and cracking load may be affected. This section describes major findings regarding the flexural response for full-size prestressed girders with HSC.
2.5.1 Shin et al. (1990)
Shin, Kamara and Ghosh (1990) tested three sets of 12 specimens with compressive strengths of 4, 12, and 15 ksi (27.6, 82.7 and 103.4 MPa). Although the specimens were clearly reinforced as columns, they were cast horizontally and cured under field conditions. The specimens were tested in flexure under two-point loading conditions. This research concluded that the equivalent rectangular stress block parameters addressed in ACI318-83 are appropriate for determining the flexural strength of HSC beams to 15 ksi (103.4MPa). Shin et al. also confirmed that there is no need for change in the ACI procedure for computing flexural strength. However, the ultimate strain of HSC is recommended to be 0.0025 as a lower bound instead of 0.003.
2.5.2 Bruce and Martin (1994)
deep and designed according to AASHTO standard specifications (AASHTO 1992), were fabricated. Three of them had a 9 ½ in. (240 mm) thick and 10 ft. (3.05 m) wide deck. Each girder specimen had a 28-day compressive concrete strength of 10,000 psi (69 MPa). Bruce and Martin concluded that the AASHTO standard specification (AASHTO 1992) is conservatively applicable for members with concrete compressive strengths up to 10,000 psi (69 MPa). Based on the findings of this research, HSC has potential benefits for highway bridge structures, including wider girder spacing and lower prestress losses. Bruce and Martin recommended the use of HSC for highway bridge structures.
2.5.3 Ahlborn, French, and Shield (2000)
3 EXPERIMENTAL PROGRAM
3.1 INTRODUCTION
This experimental research program was conducted to evaluate the flexural behavior of prestressed composite girders with high strength concrete (HSC). A total of nine prestressed AASHTO girders were fabricated and tested under static loading conditions to determine the different limit states behavior including ultimate and mode of failure of HSC girders. Each of the AASHTO girders was instrumented with internal strain gauges to measure prestress loss. Concrete cylinders for each of the AASHTO girders were also cast to determine material properties. This section will provide details related to design considerations, fabrication procedure, test set-up, loading scheme, instrumentation, and test descriptions.
3.2 DESIGN OF THE TEST SPECIMENS
A total of nine AASHTO girders with HSC were designed and tested to evaluate their flexural response. All specimens for this research program were designed in accordance with two specific design considerations.
The second design consideration is the location of the compression zone of the specimens in the flexure. Design of the girders allows three configurations of the compressive zone. The first configuration of the compressive zone is located within the top flange of the girder without the deck slab. Therefore, the strength of the concrete of the compressive zone is controlled by the HSC. The second configuration allows the neutral axis to be located within the top flange of the girder with the deck slab cast with NSC; therefore, the strength within the compressive zone is controlled by the HSC used in the girder and the normal strength concrete of the deck slab. The third type of configuration allows the neutral axis to be located within the cast-in-place deck; therefore, the flexural strength is controlled entirely by the NSC.
Depending on the strength of the concrete and the location of the compression zone, the required number of prestressing strands were 16, 18 and 20 strands for the nominal design compressive strength concrete of 10,000, 14,000, and 18,000 psi (69 to 124 MPa), respectively. All strands were straight. The design of the nine AASHTO Type II prestressed concrete girders were finalized using three design concrete strengths. Table 3.1 presents a summary and identification of each girder specimen. Typical AASHTO Type II girder sections, each shown with the order and location of strands, are given in Figure 3-1.
Table 3.1 Detailed Design of the Test Specimens Girder
Design Strength 10 ksi (69 Mpa) 14 ksi (97 Mpa) 18 ksi (124 Mpa) Section AASHTO Type II AASHTO Type II AASHTO Type II Total Length 41 ft. (12.5 m) 41 ft. (12.5 m) 41 ft. (12.5 m) Clear Span Length 40 ft. (12.2 m) 40 ft. (12.2 m) 40 ft. (12.2 m)
Strand (1/2" φ 270 k Low Relaxation)
Required Number 16 18 20
Pattern Straight Straight Straight
Deck Slab
Design Strength 4 ksi (28 Mpa) 4 ksi (28 Mpa) 4 ksi (28 Mpa)
Thickness 8 in. 8 in. 8 in.
Identification
None 10 PS - N 14 PS - N 18 PS - N
1 ft. 10 PS - 1 S 14 PS - 1 S 18 PS - 1 S
Width of the deck
slab
5 ft. 10 PS - 5 S 14 PS - 5 S 18 PS - 5 S
Dimensions
Type AASHTO
TYPE II D1 36.0 (in.)
D2 6.0
D4 3.0
D5 6.0
D6 6.0
B1 12.0
B2 18.0
B3 6.0
B4 3.0
B6 6.0
Properties
Area 369 in.2 ybottom 15.83 in.
Inertia 50,980 in.4 Weight 0.384 kip/ft.
For 18 PS-5 S, 1 S, and N For 14 PS-5 S, 1 S, and N For 10 PS-5 S, 1 S, and N Figure 3-1 Cross-section showing prestressing strand configurations
6 5 4 3 2 1
7 8 13 9 17 18 15 10 11 12
16 14
19 20
D1
D2 D4
D5 D6
B3 B4
B6
3.3 FABRICATION OF TEST SPECIMENS
Fabrication of the composite girder specimens with variable deck widths consists of two steps. First, the AASHTO girders were fabricated at a pre-cast, prestress plant. Second, the cast-in-place decks were cast on the AASHTO girders at the CFL. This section presents a description of the fabrication of the test specimens.
3.3.1 AASHTO Girder Specimens
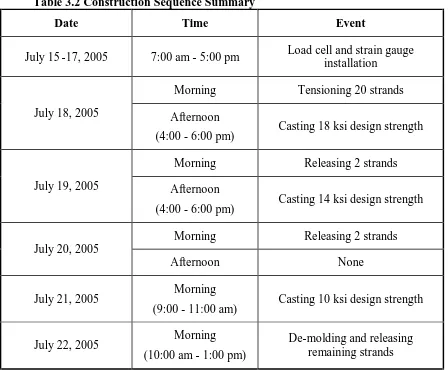
Table 3.2 Construction Sequence Summary
Date Time Event
July 15-17, 2005 7:00 am - 5:00 pm Load cell and strain gauge installation
Morning Tensioning 20 strands
July 18, 2005 Afternoon
(4:00 - 6:00 pm) Casting 18 ksi design strength
Morning Releasing 2 strands
July 19, 2005 Afternoon
(4:00 - 6:00 pm) Casting 14 ksi design strength
Morning Releasing 2 strands
July 20, 2005
Afternoon None
July 21, 2005 Morning
(9:00 - 11:00 am) Casting 10 ksi design strength
July 22, 2005 Morning
(10:00 am - 1:00 pm)
(a)
(b) (c)
Figure 3-2 Prestressing bed: a) Elevation schematic view of prestressing bed, b) Strand lay-out, c) Pretensioning
18 PS - 1 S
(MK2_18)
Dead End (Anchored End)
(WEST)
Live End (Jacking End)
(EAST)
18 PS - 5 S
(MK2_18) 18 PS - N
(MK1_18) 14 PS - 1 S
(MK2_14) 14 PS - 5 S
(MK2_14) 14 PS - N
(MK1_14) 10 PS - 1 S
(MK2_10) 10 PS - 5 S
(MK2_10) 10 PS - N
After applying prestressing force to the strands and installing the instrumentations, steel reinforcements were placed and the formwork was positioned. The three girders for each design concrete strength were cast using four batches of the same concrete mix. In order to determine the material property of each AASHTO girder, 15 concrete cylinders, 4 x 8 in. for the modulus of elasticity and compressive strength and nine 6 x 6 x 20 in. beams for the modulus of rupture, were made from each of the first three batches of concrete and cured next to the girders prior to shipping to the CFL, then air-cured in the laboratory. Additionally, the concrete supplier cast ten 4 x 8 in. concrete cylinders from each batch of mix for determining compressive concrete strength. The supplier provided the results of the compressive concrete strength at 1, 7, 14, 28, and 56 days.
The girders were vibrated using a internal vibrator while the concrete was placed. The top surface of the girders was intentionally roughened. After the girders for each design concrete strength were cast, they were then covered with burlap and plastic, and a water hose was placed on top of the girders for curing. Pictures of this procedure are provided in Figure 3-3.
gauges on the selected strands, were recorded before and after release, and the end slippage was measured at specified points, as will be described in later sections.
(a) Reinforcing (b) Casting concrete
(c) Covering with burlap (d) Curing
After the nine AASHTO Type II girders were fabricated, they were stored in the plants. Approximately 56 days after fabrication, on September 19, 2005, three girders for the 10,000 psi design strength concrete were shipped from the plant to the CFL for testing. The others also were shipped to the CFL within 3 months after fabrication. They were stored inside the laboratory.
3.3.2 Cast-in-place Deck
Approximately three months after girder fabrication, deck slabs (three 1 ft. wide and three 5ft. wide) were cast on six AASHTO girders at the CFL. The width of the deck slab was determined based on the design consideration. The 28-day nominal design compressive strength of the cast-in-place deck was specified as 4,000 psi (28 MPa). Other details, including the deck slab dimensions and reinforcement specifications for the 5 ft. and 1 ft. wide deck slabs, are presented in Appendix C.
A single 5 ft. wide cast-in-place deck was cast each week for three consecutive weeks, and three 1 ft. wide cast-in-place decks were cast at the same time during the following week. Concrete was provided by Thomas Concrete of Raleigh, NC. The measured concrete slump was 3 to 4 in. at the time of casting. The concrete deck slabs were covered with plastic for 1 day, after which the forms were removed and the beams were air cured. The completed formwork for 1 ft. and 5 ft. wide slabs is shown in Figure 3-4. Figure 3-4 (a) shows two AASHTO girders that were used temporarily to support the deck concrete.
a) 5 ft. wide deck slab
b) 1ft. wide deck slab
3.4 INSTRUMENTATION
3.4.1 AASHTO Girder Specimens
Applied prestressing force, strain, elongation, and end slippage, were measured during the fabrication process. Specifically, load cells were used to verify the applied load on the strands at the dead end of the prestressing bed. The locations of the load cells corresponds to the strands are shown in Figure 3-5 (a). Four load cells were installed on the bottom-most strands. A portable indicator, shown in Figure 3-5 (b), was used to measure the load indicated by the load cells. The bearing plate was used only for the two outside strands due to the limited space available, as shown in Figure 3-5 (c).
After the installation of the load cells, the strands were lightly tensioned to a load of 4 kips and then fully tensioned up to 31 kips. The load cells measured the applied force after jacking, during casting, curing, and at the release of the strands. Data obtained from the load cells are given in Table 3.3.
b) Installed load cell and indicator
a) Location of load cells (LC)
and of de-tensioned strands c) Bearing plate Figure 3-5 Load cell installation
LC-4
LC-3 LC-2
LC-1
1st de-tensioned and removed strands
2nd de-tensioned and removed strands
Indicator 1 2 3 4
Table 3.3 Measured Data from Load Cells
Load Cell Date
(2005) Time 1 2 3 4 Etc.
1st reading
(P.G. = 4 kips) 3.5 3.5 3.7 3.4 2nd reading
(P.G. = 10 kips) - - - 10.4
3rd reading
(P.G. = 20 kips) - - - 19.8
Jacking
4th reading
(P.G. = 30 kips) 30.5 30.9 29.5 30.8 July
18
After 18 ksi casting 30.7 30.8 29.7 30.8
Morning 30.8 31.0 29.8 31.1 1
st
de-tensioned, removed strands July
19
After 14 ksi casting 30.8 30.9 29.6 30.9
Morning 31.1 31.3 29.9 31.3 2
nd
de-tensioned, removed strands July
20
Afternoon 31.3 31.4 30 31.3
Morning 32.0 32.3 30.9 31.3
July
21 After 10 ksi casting 30.4 30.6 29.3 30.5
Morning 33.0 33.1 31.8 33.3
Afternoon 32.8 33.0 31.6 33.1
July 22
Table 3.4 Order of Prestressing Strands and Elongation Strand # Applied force
(lb.)
Measured Elongation
(in.)
Computed
force (lb.) Applied/Com.
1 31600 30 5/8 26849 1.18
2 31600 31 1/2 27616 1.14
3 31600 30 3/8 26630 1.19
4 31600 30 1/8 26411 1.20
5 31600 31 27178 1.16
6 31600 31 27178 1.16
7 31600 30 7/8 27068 1.17
8 31600 31 3/8 27507 1.15
9 31600 31 7/8 27945 1.13
10 31600 31 1/4 27397 1.15
11 31600 31 27178 1.16
12 31600 31 1/4 27397 1.15
13 31600 31 27178 1.16
14 31600 30 1/4 26520 1.19
15 31600 31 7/8 27945 1.13
16 31600 31 27178 1.16
17 31600 31 3/4 27835 1.14
18 31600 31 7/8 27945 1.13
19 31600 30 3/4 26959 1.17
During the construction of the girder specimens, as indicated in Table 3.2, two internal weldable strain gauges for each girder were attached to the selected bottom-most strands of each girder near the mid-span prior to pretensioning the strands. These gauges were used to indicate the strain of the embedded strands during the entire testing process. Welded strain gauges provide prestress losses and the strain of the strand during flexural testing. The weldable gauges were located in accordance with three phases. These locations, as shown in Figure 3-6, were duplicated for each girder according to each girder’s design strength of concrete. These gauges were located approximately at the middle of the span.
For 18 PS - 1 S For 18 PS - 5 S For 18 PS - N
Figure 3-6 Locations of weldable strain gauges
a) Welder b) Weldable strain gauge
c) Surface preparation d) After installation
Figure 3-7 Installation of weldable strain gauge
3.4.2 Cast-in-place Deck
Figure 3-8 Installation of the strain gauges attached to #3 steel rebar
3.5 MATERIAL PROPERTIES
3.5.1 Concrete Properties
Table 3.5 Detailed Mix Design for Girder Specimens NCHRP12-64 HSC Mix
Design compressive strength (psi) 10,000 14,000 18,000
Cement (lbs.) 670 703 890
Fly ash (lbs.) 150 192 180
Microsilica (lbs.) 50 75 75
#67 Granite (lbs.) 1727 1700 1700
Concrete sand (river) (lbs.) 1100 1098 917
Water (lbs.) 280 250 265
Recover (hydration stabilizer) (oz.) 26 50 50
ADVA 170 (water reducer) (oz.) 98 125 135
W/cementitious material 0.32 0.26 0.23
Table 3.6 Concrete Properties for Girder Specimens Design
Strength
Mix
Design Batch
Con. Temp.
(oF) % Air
Slump (in.)
Unit Weight (pcf)
1 91 3 8 1/2" 144.6
10 ksi MIX 1 P
3 82 3.5 8 3/4" 145.5
1 98 3.2 6 3/4" 148.5
2 100 2.9 8.75" -
14 ksi MIX 2 P
3 97 2.6 10" 148.9
1 100 2.98 7 1/2" -
2 98 1.48 10 1/2" -
18 ksi MIX 3 P
3 100 2.78 6 1/4" -
Table 3.7 Concrete Mix Design for Deck Slab
5 ft. wide deck slab 1 ft. wide deck slab
Deck cast date 10-20-2005 11-10-2005
Amount (yd.3) 5.5 3.5
#67 Stone (lb.) 4978 6335
River Sand (lb.) 3742 4740
Cement (lb.) 1628 2072
Recycle water (gal.) 106 45
200 N (oz.) 47 60
Table 3.8 Concrete Properties for Cast-in-place Deck
Identification Air Content
(%)
Slump (in.)
Unit Weight (pcf)
10 PS – 5 S 2.4 3.5 149.87
14 PS – 5 S 1.7 3 149.36
18 PS – 5 S 2 4 3/4 154.63
10, 14, and 18 PS – 1 S 1.3 4 1/2 149.84
3.5.2 Compressive Strength, Elastic Modulus, and Modulus of Rupture
grinding the cylinders provides the highest strength and the lowest coefficient of variation Zia et al. (1987). Therefore, all of the cylinders were first prepared by grinding both end surfaces to remove irregularities in the surfaces and to ensure that the ends were perpendicular to the sides of the cylinders, as shown in Figure 3-9 (a). As mentioned earlier, the girder producers also provided cylinders for measuring the compressive strength of the concrete in each girder at 1, 7, 14, 28, 56 days. Test cylinders were grinded on the both end surfaces using a hand grinder, as shown in Figure 3-9 (b). Test results for the compressive strength are given in Appendix E.
a) Grinder b) Hand grinder
Figure 3-9 Specimen preparation and test set-up for elastic modulus
from one batch of one design strength. The test set-up for the elastic modulus and modulus of rupture is shown in Figure 3-10 (a) and (b), respectively.
a) Cylinder test set-up b) Beam test set-up
Figure 3-10 Test set-up for elastic modulus and modulus of rupture
began at zero applied load and unloaded at 40 percent of the expected capacity of the specimen. The second and third loading cycles were applied up to 40 percent of the expected capacity of the specimen. Finally, the specimen was loaded to failure to obtain the compressive strength. From the measured average strain under twice loading phase, the elastic modulus was determined.
The modulus of rupture tests were carried out using the 6 x 6 x 20 in. beam specimens. The specimens were tested under four-point loading in accordance with AASHTO T 97. A 90-kip hydraulic jack mounted inside a structural steel test frame was used to apply the load. A load cell was used to measure the applied load. A spherical head and a plate/roller assembly were located beneath the load cell to distribute the load evenly on the two loading points at the top surface of the specimen. The span length of the specimen was 18 in., and the spacing between supports and the nearest loading point as well as the space between the two loading points was 6 inches. The load was applied such that the stress at the extreme bottom surface of the specimen increased at an approximate rate of 150 psi/sec.
As indicated in Table 3.10, the average 28-day compressive strength for the deck concrete reached the design strength ranging from 3450 to 5560 psi. The deck concrete is considered normal-strength concrete.
Table 3.9 Test Results for Material Properties
Mix Design Concrete Age fc(psi) E (ksi) fr(psi)
28 days 11430 5450 828
Mix 1P
(10 ksi) 56 days 11880 5750 n/a
28 days 12960 5430 813
Mix 2P
(14 ksi) 56 days 14020 5500 n/a
28 days 15870 6100 853
Mix 3P
(18 ksi) 56 days 16810 5590 n/a
( ) is the design concrete strength
Table 3.10 Compressive Strength Test for Deck Concrete
Specimen Identifications fc (psi) at 28 days Average fc (psi)
10 PS – 5 S
3880 3770 3680
3780
14 PS – 5 S
5150* 4900* 4910*
4990
18 PS – 5 S 3390
3500 3450
10, 14, and 18 PS-1 S
5570 5350 5760
As indicated, using fly ash in concrete mix results in the development of compressive concrete strength over longer time. Test results, as given in Table 3.11 for compressive strength, elastic modulus, and modulus of rupture, indicate that the compressive cylinder strengths of each AASHTO girder reached the design compressive strengths of 10,000, 14,000, and 18,000 psi, with the exception of girder 18 PS–1 S. These test results for compressive strength were expected due to the test results provided by the concrete supplier, as given in Appendix E.
Table 3.11 Material Property for Each AASHTO Girder Specimen
Specimens Age (days) fc (psi) E (ksi) fr(psi)
Girder 120 11490 5360 768
10 PS – 5 S
Deck 29 3780 2690 -
Girder 143 16160 5560 711
14 PS – 5 S
Deck 43 5340 3300 -
Girder 175 18060 5970 872
18 PS – 5 S
Deck 67 3990 2660 -
Girder 189 13190 5630 820
10 PS – 1S
Deck 77 5040 2770 -
Girder 184 15530 5440 751
14 PS- 1 S
Deck 70 5040 2770 -
Girder 199 14490 5150 680
18 PS – 1S
Deck 84 5040 2770 -
10 PS - N Girder 222 11810 5540 820
14 PS - N Girder 228 15660 5330 717
3.5.3 Prestressing Strands
Prestressing strands typically used in the girder specimens were ½ in. in diameter, 7-wire, Grade 270, low relaxation strands. The material properties of the prestressing strands were provided by the supplier. The strength-strain relationship is given in Figure 3-11.
0 6 12 18 24 30 36 42 48 54 60
0.0 0.2 0.4 0.6 0.8 1.0 1.2 1.4 1.6 1.8 2.0
Strain (%)
S
tr
e
n
g
th
(
lb
f)
Figure 3-11 Material property for prestressing strand
Ultimate breaking strength (lbf) 43,758 Load @ 1% extension (lbf) 40,348 Ultimate elongation, % 4.95
Actual area (in2) 0.1523
3.6 FLEXURAL TEST DETAILS
3.6.1 Test Set-up and-Procedure
The test setup used for the flexural tests is schematically shown in Figure 3-12. Girders were simply supported with a steel plate above a neoprene pad. The load was commonly applied for all of the girders at two locations spaced 6 ft. at mid-span. Load was applied to the girders using a 440 kip MTS closed-loop actuator. The AASHTO girder specimens were loaded and unloaded using a stroke control at a rate of 0.1in./min. prior to the cracking of the girders and reloaded using a stroke control rate of 0.1in./min. up to the yielding of the prestressing strands and a stroke control rate of 0.25 in./min. after the prestressing strands yielded. Then, the specimens were loaded up to failure.
Figure 3-12 Test set-up schematic
The first test specimen, 10 PS–5 S, which is the 10 ksi girder with a 5 ft. wide slab, indicated the possibility of rotation of the specimens at failure due to local crushing of the concrete as
Neoprene Pad
CFL Floor
480 in.
72 in. 204 in.
Steel Plate
Spread Beam
shown in Figure 3-13 (a). To prevent any instability in the test set-up, a frame was installed diagonally near the loading location. Figure 3-13 (b) indicates the supporting conditions with a 1 in. steel place above a 2 in. neoprene pad, respectively. Figure 3-13 (c) and (d) show the test set-up for the AASHTO girder specimens with 5 ft wide decks installed with and without the lateral frame, respectively. Additionally, Figure 3-13 (e) and (f) show the test set-up for AASHTO girder specimens with a 1ft wide deck and without a deck.
a) Local crushing at failure b) Support conditions
c) Test set-up for girder with 5 ft. without lateral frame
d) Test set-up for girder with 5 ft. with lateral frame
e) Test set-up for girder with 1 ft. deck with lateral frame
f) Test set-up for girder without deck with lateral frame
Figure 3-13 (continued) typical test set-up for nine AASHTO girder specimens
3.6.2 External Instrumentation
After placement on the supporting block, the girder specimens with the 1 ft. and 5 ft. wide deck slab and without the deck slab, were instrumented for measurement of displacements and strains at several locations along the beam.
3.6.2.1 Deflection Measurement Device
points, and at the mid-span of the girders. Two conventional linear transducers at the ends were used to measure the relative deflection between the concrete girder and the neoprene pad.
Figure 3-14 Location of LMTs to measure deflections
3.6.2.2 Strain Measurement Device
Strain measurement devices were placed on the top, bottom, and side surface of concrete girder to measure the strains at the various loading stage. Both electrical resistance strain gages and PI gages were installed on extreme top surface of concrete, and within constant moment zone. Additionally, PI gages were attached to the bottom and side surface of girders to obtain the strain profile at the given section. In particular, top surface instrumentations were used to determine the ultimate strain of HSC girder. For the composite AASHTO girder with a 5ft wide deck, Figure 3-15 shows the locations of both electric strain gages and PI gages. In the case of AASHTO girder with a 1ft wide deck and without deck, the width of deck is same with the flange width of AASHTO girder. The locations as shown in Figure
120 in. 84 in. 36 in.
String or Conventional LMTs
C.L.
3-16 and Figure 3-17 for both electric strain gages and PI gages represents AASHTO girders with 1ft wide deck and without deck respectively. The locations for top and bottom surface for AASHTO girder without deck are duplicated as same as Figure 3-16 (a) and (b).
a) Top surface
b) Cross section
Figure 3-15 Location of Strain and PI gages for 10PS – 5S, 14PS- 5S and 18PS-5S
19.5in.
4in. 15in.
4in. 24n.
36in. 8in.
SP1
SP2
SP3
NP1
NP2 P1 P2
P3
P4 P5 P6
SP2 SP1
60 in. 12 in.
Flange Width of Girder
P1, P3 : 8 in. PI Gages 72 in.
12 in. 12 in. 12 in. 6 in.
12 in.
12 in.
S1, S2 : Strain Gages P1
S1
P2
S2
P3
c) Bottom surface
Figure 3-15 (continued) Location of Strain and PI gages for 10PS-5S, 14PS–5S and 18PS-5S
a) Top surface
Figure 3-16 Location of Strain and PI gages for 10PS–1S, 14PS-1S and 18PS-1S
18in.
P4, P6 : 8 in. PI Gages 72in.
12in. 24in. 5in.
4in.
P4
P5
P6
P5 : 12 in. PI Gages
12in.
P1, P3 : 8 in. PI Gages 72in.
12in. 12in. 12in. 2in.
2in.
2in.
S1, S2 : Strain Gages P1
S1
P2
S2
P3
b) Cross section
c) Bottom surface
Figure 3-16 (continued) Location of Strain and PI gages for 10PS–1S, 14PS–1S and 18PS-1S
18in.
P4, P6 : 8 in. PI Gages 72in.
12in. 24in. 5in.
4in.
P4
P5
P6
P5 : 12 in. PI Gages 19.5in.
4in. 15in.
4in. 24n. 36in.
8in.
SP1
SP2
NP1 SP0
SP3 NP2
34in.
P1 P3
P4 P5 P6
P2
Figure 3-17 Location of Strain and PI gages for 10PS-N, 14PS–N and 18PS-N
3.6.3 Data Acquisition System
An OPTIM MEGADAC data acquisition system, controlled by the TCS (Test Control Software) program, was used to record data, including load, stroke, strain, and deflection for each test. Using this system, the results were graphically monitored using Microsoft Excel during the data acquisition process.
19.5in.
4in. 15in.
4in. 24in. 36in.
SP1
SP2
NP1 SP0
SP3 NP2
34in.
P1
P4 P5 P6
P2 P3
4 RESULTS AND DISCUSSION
4.1 INTRODUCTION
This chapter provides test results and the discussion regarding the flexural response of prestressed AASHTO girders with HSC.
Section 4.2 summarizes the material properties of the specimens and proposes a recommended equation for a prediction of the elastic modulus based on statistical analysis. In addition, the test results are evaluated based on a comparison of the proposed equation and previous research and current specifications.
Section 4.3 provides the measured prestress losses by the use of internal weldable strain gauges. The test results are compared with the current AASHTO LRFD specifications (2004) which contain the most recent research results for HSC, as obtained from tests conducted by Tadros (2003).
Section 4.4 discusses the measured end slippage that are used to investigate transfer length. These results are evaluated against the references, as found in AASHTO LRFD specification (2004) and Oh and kim (2000).
4.2 MATERIAL PROPERTIES STUDY
4.2.1 Elastic Modulus
The measured material properties for this study were provided in Section 3.5.2. In addition to the test results for material properties, the proposed equations for elastic modulus by the statistical analysis were briefly discussed in Section 2.2.
As published in both AASHTO LRFD (2004), which is similar to the ACI318 (2005), and ACI363R (1992), the predictive equation for elastic modulus is expressed in terms of the compressive strength and the dry unit weight of concrete. More specifically, these code provisions use the relationship of the root of the compressive strength of concrete, as seen in the Chapter 2.
However, Cook (2005) has developed a predictive equation for the elastic modulus with the following relationship:
( )
0.2453 6738. 2
c c
c w f
E = ⋅ ′ , Equation 4-1
where
wc = dry unit weight of concrete (pcf) and
f′c = specified strength of concrete (psi).
study and analytical results discussed in the following section. It is proposed that the equation for the modulus of elasticity, Ec, be revised as follows:
( )
0.33 5. 2
c c
c w f
E = ⋅ ′
. Equation 4-2
The measured elastic modulus results obtained from each specimen in this study and other researchers collected from test results by Andrew (2005) are shown in Figure 4-1 along with the current code equations, Cook’s equation and the above proposed equation for the elastic modulus. The predictive equations were generated using a unit weight of 149 pcf as an average of the measured value. It indicates clearly that the AASHTO LRFD (2004) equation overestimates the measured results in the high strength concrete. On the other hand, the elastic modulus in the ACI363R (1992) equation shows a better agreement with measured test results. In the case of the Cook and the above proposed equations, they were within the predictions by the LRFD equation and ACI363R equation. However, the Cook’s equation seems to overestimate the elastic modulus under 10,000 psi concrete compressive strength and yields relatively high value beyond 10,000 psi concrete.
However, it is difficult to judge which one provides more appropriate prediction due to the limited number of test results and collected data from other researcher. Therefore, more comprehensive comparison is required to evaluate the predictive equation for the elastic modulus over the full range of the concrete compressive strength up to 18,000 psi or more.
0 1 2 3 4 5 6 7 8 9
6,000 8,000 10,000 12,000 14,000 16,000 18,000 20,000
Compressive Strength (psi)
E
la
s
ti
c
M
o
d
u
lu
s
(
p
s
i
x
1
0
6 )
AASHTO-LRFD Data by Others *
PC Specimens at 28 Days & at 56 Days PC Specimens at Test Days
Proposed eq. ACI363R-92
Cook (2006)
AASHTO-LRFD
Proposed eq.
ACI363R Cook
Figure 4-1 Comparison of the elastic modulus between test results and predicted value
Table 4.1 Range of the Collected Data Test Data
Entries
Compressive Strength (psi)
Unit Weight (lbf)
Elastic Modulus (x106 psi)
4388 370 to 24000 90 to 175.95 0.71 to 10.78
Predicted Vs. Measured Concrete Modulus of Elasticity,
Ec = 33 · w1.5 · f'c0.5 (ACI318, AASHTO LRFD)
0 2 4 6 8 10
0 2 4 6 8 10
Measured Modulus of Elasticity, E x10^6 psi
P re d ic te d M o d u lu s o f E la s ti c it y , E x 1 0 ^ 6 p s i
90 ≤ w < 110 pcf 110 ≤ w < 120 pcf 120 ≤ w < 130 pcf
130 ≤ w < 140 pcf 140 ≤ w < 150 pcf w ≥ 150 pcf
R2=0.68
a) AASHTO LRFD and ACI318
Pre dicte d Vs. Measured Concrete Modulus of Elasticity,
Ec = (40,000 · f'c0.5+106) · (w/145)1.5 (ACI363R)
0 2 4 6 8 10
0 2 4 6 8 10
Mea sured Modulus of Elasticity, E x10^6 psi
P re d ic te d M o d u lu s o f E la s ti c it y , E x 1 0 ^ 6 p s i
90 ≤ w < 110 pcf 110 ≤ w < 120 pcf 120 ≤ w < 130 pcf
130 ≤ w < 140 pcf 140 ≤ w < 150 pcf w ≥ 150 pcf
R2=0.71
b) ACI363R
Pre dicte d Vs. Measured Concrete Modulus of Elasticity,
Ec = w2.6738 · f'c0.2453 (Cook's)
0 2 4 6 8 10
0 2 4 6 8 10
Mea sured Modulus of Elasticity, E x10^6 psi
P re d ic te d M o d u lu s o f E la s ti c it y , E x 1 0 ^ 6 p s i
90 ≤ w < 110 pcf 110 ≤ w < 120 pcf 120 ≤ w < 130 pcf
130 ≤ w < 140 pcf 140 ≤ w < 150 pcf w ≥ 150 pcf
R2=0.78
c) Cook’s equation
Predicted Vs. Mea sured Concrete Modulus of Elasticity,
Ec = w2.5 · f'c0.33 (Propose d)
0 2 4 6 8 1 0
0 2 4 6 8 10
Measured Modulus of Elasticity, E x10^6 psi
P re d ic te d M o d u lu s o f E la s ti c it y , E x 1 0 ^ 6 p s i
90 ≤ w < 110 pcf 110 ≤ w < 120 pcf 120 ≤ w < 130 pcf
130 ≤ w < 140 pcf 140 ≤ w < 150 pcf w ≥ 150 pcf
R2=0.76
d) Proposed equation
To evaluate the accuracy of the current equations and the proposed equation, a statistical analysis was conducted using the following normal distribution formula. The normal distributions of the collected data with respect to the current AASHTO LRFD (2004), ACI 363R-92, Cook’s (2005) and the proposed equation are shown in Figure 4-3 in which P(x) is the probability function, defined as follows:
(
)
22
1
( ) exp
2 2
x
P x µ
σ σ π
−
= −
, Equation 4-3
where
σ = the standard deviation, exp = the exponential function,
µ = the mean and x = the variable.
Results of the statistical analysis for the ratio of the predicted to the measured elastic modulus with respect to the various predictive equations are shown in Table 4.2.
Table 4.2 Results of Statistical Analysis
Equation Mean (m) Standard Deviation (σ) 1
(
σ 2π)
AASHTO LRFD 1.06 0.18 2.18
ACI363R 0.95 0.15 2.72
Cook’s 1.09 0.18 2.22