ABSTRACT
DEW, EMILY KEEGAN. Heritability Estimates of Metric and Nonmetric Traits in a Population of Cotton-Top Tamarins (Saguinus oedipus). (Under the direction of Dr. Ann Ross, Dr. D. Troy Case, and Dr. Dahlia Nielsen.)
Non-human primate skeletal collections are often used as a proxy for humans in anthropological research as lab-raised populations allow for control of environmental factors and have lineage information for numerous generations, which is not possible with human collections. The goals of this study are to examine heritability estimates generated from metric and nonmetric traits and assess the heritability of these traits as set forth by Cheverud and Buikstra (1982) in their study using a population of rhesus macaques. A similar study is conducted here using another population of non-human primates (cotton-top tamarins, N = 144)and comparisons of heritability estimates derived from the standard human sets of metric (Moore-Jansen et al. 1994) and nonmetric (The Smithsonian Institution) traits are made. The heritability estimates were also calculated using current statistical procedures not available to Cheverud and Buikstra at the time of their study. Furthermore, the use of standard traits will also allow the findings of this thesis to be more easily compared with the findings of other studies.
and Blangero, 1998), which uses maximum likelihood components analysis to estimate heritability and determine the statistical significance of the trait and other covariates in the model (Carson, 2006a; Carson, 2006b). Age, sex, and their interaction term were used as covariates in these analyses. SOLAR produced heritability estimates, the standard error and p-values for these estimates, and the proportion of variance due to statistically significant covariates and their p-values. Additionally, technical error of measurement (TEM) and the coefficient of reliability (R) were calculated for all metric measurements (Lewis, 1999).
Results show that overall, there are more metric traits that display greater than zero heritability estimates than there are nonmetric traits that that display greater than zero
heritability estimates. Of the 46 traits with statistically significant heritability estimates, only 6 (13%) are nonmetric traits. Comparison of the TEM and R of the standard metric
Heritability Estimates of Metric and Nonmetric Traits in a Population of Cotton-Top Tamarins (Saguinus oedipus)
by
Emily Keegan Dew
A thesis submitted to the Graduate Faculty of North Carolina State University
in partial fulfillment of the requirements for the Degree of
Master of Arts
Anthropology
Raleigh, North Carolina 2014
APPROVED BY:
_______________________________ ______________________________ Dr. Ann H. Ross Dr. Daniel T. Case
Chair of Advisory Committee
DEDICATION
BIOGRAPHY
Emily Keegan Dew first discovered physical anthropology as a field of study her senior year of high school. It was love at first sight. In 2008, she began studying at the University of North Carolina at Chapel Hill, working towards her B.A. in anthropology and determined to begin the long journey to a Ph. D. in physical anthropology, specializing in forensic anthropology.
In order to begin gaining practical experience, Emily traveled to Karak, Jordan on an archaeological dig during the summer between her freshman and sophomore years. Her experiences while on the dig, both the process of excavating and the academic environment, further solidified her determination to achieve a career in physical anthropology. She also elected to complete an Undergraduate Honors Thesis as an opportunity to prepare herself for writing her Master’s Thesis and Doctoral Dissertation in the future, to gain research
experience by designing and executing her own research project, and to supplement her classes in physical anthropology at UNC with more study focused on forensic anthropology. For her honors thesis, Emily studied the interpretation of hacking metal weapon trauma in bone. She graduated with honors in the spring of 2012 with a B.A. in anthropology and a minor in English.
ACKNOWLEDGMENTS
I’d like to thank my advisor, Dr. Ann Ross, for her guidance and support throughout the entire process of this thesis. Her mentorship and her dedication to their students and their success is unparalleled. I cannot thank her enough for all of the opportunities she has
TABLE OF CONTENTS
LIST OF TABLES ... vii
LIST OF FIGURES ... viii
INTRODUCTION ...1
Metric Traits ...1
Nonmetric Traits ...3
The Efficacy of Metric and Nonmetric Cranial Traits for Population Affinity Studies ...4
LITERATURE REVIEWED ...6
Previous Studies Concerning the Significance of Metric and Nonmetric Traits ...6
Cheverud and Buikstra ...13
PREVIOUS RESEARCH USING THE ORAU COTTON-TOP TAMARINS ...16
MATERIALS AND METHODS ...20
Materials: Cotton-top Tamarins ...20
Methods: Data Collection ...20
Methods: Statistical Analysis...32
Methods: Intra-Observer Error ...33
RESULTS ...35
Standard Metric Measurements ...36
Cheverud and Buikstra’s Metric Measurements ...38
Standard Nonmetric Traits ...40
Cheverud and Buikstra’s Nonmetric Traits ...42
Significant Heritability Estimates ...43
Trends in the Number of Heritability Estimates by Region on the Cranium ...45
Extreme Heritability Estimates ...47
Technical Error of Measurement and the Coefficient of Reliability ...50
DISCUSSION ...53
Cheverud and Buikstra ...53
Trends in the Number of Heritability Estimates by Region on the Cranium ...56
The Genetic Underpinnings of Cranial Phenotypic Variation in Humans ...56
CONCLUSION ...59
Suggestions for Further Research ...60
LIST OF TABLES
Table 4.1 Cheverud and Buikstra’s Nonmetric Traits ...21
Table 4.2 Cheverud and Buikstra’s Metric Measurements ...22
Table 4.3 Standard Nonmetric Traits ...27
Table 4.4 Standard Metric Measurements ...28
Table 5.1 Summary Statistics for Standard Metric Measurements ...36
Table 5.2 Heritability Estimates of Standard Metric Measurements ...37
Table 5.3 Summary Statistics for Cheverud and Buikstra’s Metric Measurements ...38
Table 5.4 Heritability Estimates for Cheverud and Buikstra’s Metric Measurements ...39
Table 5.5 Summary Statistics for Standard Nonmetric Traits ...40
Table 5.6 Heritability Estimates for Standard Nonmetric Traits ...41
Table 5.7 Summary Statistics for Cheverud and Buikstra Nonmetric Traits ...42
Table 5.8 Heritability Estimates for Cheverud and Buikstra’s Nonmetric Traits ...42
Table 5.9 Statistically Significant Heritability Estimates. ...44
Table 5.10 Measurements with Extreme (0 or 1) Heritability Estimates ...48
Table 5.11 TEM and R for All Measurements ...52
Table 6.1 Cheverud and Buikstra’s Nonmetric Traits and their Heritability Estimates ...54
LIST OF FIGURES
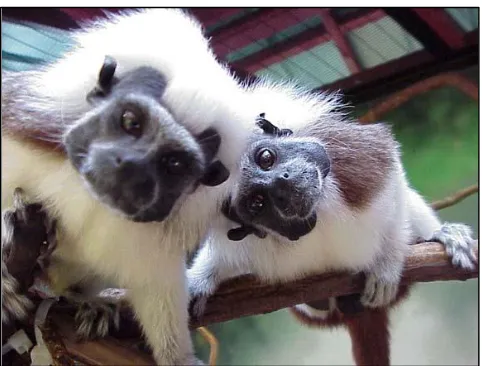
Figure 3.1 Cotton-Top Tamarins ... 16
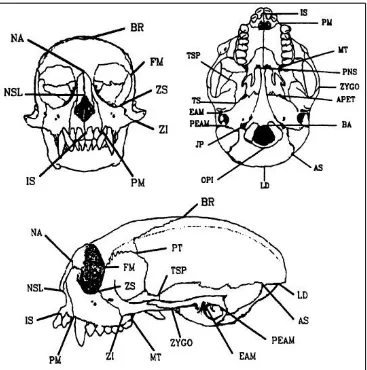
Figure 4.1 Cranial Landmarks ... 23
Figure 4.2 Measurements by Cheverud & Buikstra – anterior view ... 24
Figure 4.3 Measurements by Cheverud & Buikstra – anterior view ... 25
Figure 4.4 Measurements by Cheverud & Buikstra – inferior view ... 26
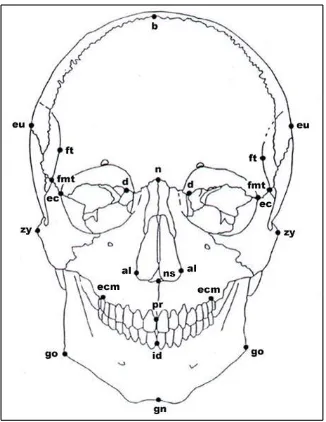
Figure 4.5 Standard Forensic Cranial Landmarks - anterior view ... 29
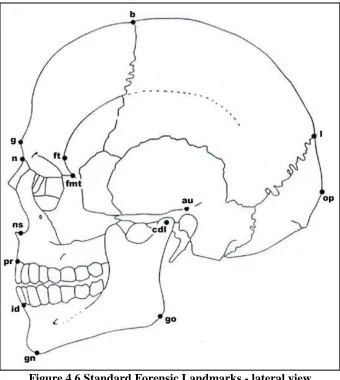
Figure 4.6 Standard Forensic Landmarks - lateral view ... 30
INTRODUCTION
The study of variation in the human skeleton has been used to investigate relationships between populations and to map the history of human evolution (Howells, 1973; Relethford, 1994, 2004; Ross et al., 2008; Ross et al., 2004a; Ross et al., 2004b). Variation in the human skeleton can be influenced by environmental and genetic factors (Ross et al., 2008; Ackermann and Cheverud, 2004; Relethford, 2004; Gravlee et al., 2003a, 2003b). These factors also often work in conjunction to create the observable differences (e.g. phenotype) between populations. Metric and nonmetric traits are two types of data that can be used to document this variability.
Metric Traits
Metric traits reflect more quantitative aspects of biological variation in the skeleton. The study of measurements of the living is called anthropometry, while measurements taken from the post-cranial skeleton are called osteometrics and on the skull are called
craniometrics. This thesis will focus solely on craniometrics. Traditional or two-dimensional craniometrics uses simple distances defined by the endpoints of a caliper and sometimes by angles defined by anatomical landmarks. However, some more recent 2D/3D alternatives include: coordinate points, surface contouring, holography, and methods that use digitizing pads, video-based systems, and 3D imaging (Pietrusewsky, 2008).
purposes. Current research, however, focuses on populations as a whole and investigating biological variation within populations rather than solely emphasizing differences between populations. There are several arguments for the continued use of metric data (Pietrusewsky, 2008). For example, the ability to use standard measures generates data with increased
accuracy and repeatability. Metric data is also well suited to statistical analysis because of the continuous and correlated nature of these measurements.
Early forays into statistical analysis of craniometric data involved univariate statistical procedures. These methods are descriptive and utilize measures of central
tendency, dispersion, and variance. However, univariate statistics are only able to investigate populations by analyzing one or two measures at a time (Pietrusewsky, 2008). Multivariate statistical procedures are a family of related mathematical procedures that allow the
investigator to simultaneously analyze multiple variables to examine affinity and differences among variables and other inferences. However, multivariate analyses make several
assumptions (Pietrusewsky, 2008). The first is multivariate normality and equality of covariances. The second assumption is that the data are of a sufficiently large sample size. For multivariate procedures, the sample must be even larger than usual, though the exact requirements are disputed. Corruccini (1975) asserts that the sample size must exceed the number of variables used, while Lachenbruch and Goldstein (1979) suggest at least three times as many individuals as the number of measurements for each sample. Classic methods of multivariate statistics include: principle component analysis and factor analysis to find underlying patterns within a group; discriminant function analysis, Mahalanobis’s
R-mode analyses that investigate relationships among individuals and variables, respectively; and cluster analyses that use already specified variants and create a dendrogram
(Pietrusewsky, 2008).
More recently, metric measurements have been used in conjunction with programs such as RMET 5.0 (Relethford, no date), FORDISC 3.0 (Ousley and Jantz, 2005), and 3D-ID (Slice and Ross, 2009) to assist in the identification of human remains. These programs compare traditional metric data (FORDISC 3.0) or 3D coordinate data (3D-ID) to databases of measurements or 3D coordinate data of individuals of known sex and ancestry and in return, provide a classification along with posterior probabilities for ancestry and sex. While the list of included anatomical landmarks has been narrowed to 34 for 3D-ID, further studies into the heritability of traits may provide the key to fine-tuning these methods.
Nonmetric Traits
Nonmetric traits are morphological variants, the qualitative variants of the skeleton. Though they are often referred to as discrete traits, nonmetric traits have an underlying continuous distribution (often called a quasi-continuous distribution) in most cases. Scoring of nonmetric traits is often more complex than simple presence or absence of the trait (Jemmott & Falsetti, 2003; Saunders & Rainey, 2008).
incomplete coalescence of elements reflecting the retention of an immature or embryonic stage (Ossenberg, 1969). However, there is no standardized classification system. Ossenberg (1969) presents a popular system, which has since been added to and edited by Saunders (1989), Schwartz (1995), and Barnes (1994). Ossenberg (1969) divides nonmetric (here: discrete) traits of the cranium into 5 groups: hyperstotic, hypostotic, supernumerary vault sutures, foramina/grooves/canals, and variations at the craniovertebral border.
In addition to a lack of standards for the classification of nonmetric cranial traits, observation and data collection for these traits remains largely unstandardized. This is due, in part, to the variety of nonmetric traits themselves. And, among other things, there is also debate over what level of descriptive specificity is most informative; whether all detailed multi-level data collection is preferable to more simple, dichotomous absent versus present decisions, and how the statistical analysis of these traits should be carried out (Carson, 2006a; Carson, 2006b).
The Efficacy of Metric and Nonmetric Cranial Traits for Population Affinity Studies
The use of metric and nonmetric cranial traits for the study of population affinity relies on the assumption that there is a direct relationship between genotype and phenotype. The complexity of the interactions among the many factors that influence metric and
LITERATURE REVIEWED
Within the study of skeletal variation, anthropologists disagree on the utility of metric versus nonmetric traits for studying heritability and the relationships between and among populations (Carpenter, 1976; Corruccini, 1974; Jantz, 1970; Wilkinson, 1971; Rightmire, 1972; Ossenberg, 1969, 1976; Berry and Berry, 1967; Pietrusewsky, 1969; Gaherty, 1970; Cheverud and Buikstra, 1982). The debate over the relative utility of metric versus nonmetric traits incorporates not only their statistical significance as indicators, but also the practical components of research such as the ease and repeatability of data collection and the ability to appropriately and effectively quantify the data for statistical analysis.
Previous Studies Concerning the Significance of Metric and Nonmetric Traits
test (which is equivalent to the parametric t-test), in addition to Spearman’s coefficient for rank correlation. In her introduction, Ossenberg stresses the importance of focusing on nonmetric traits themselves as a trajectory of study. At the time, the study of nonmetric traits and the methods by which they are studied were not established and their validity in human population studies were somewhat controversial. She also presents several warnings and cautions regarding the selection of traits for study. She concluded that the traits tested yield valid taxonomical information, but admits that her data should be used with other types of data as well.
Ossenberg’s findings and recommendations are consistent with Corruccini’s findings two years earlier. Corruccini (1974) investigated 72 discrete (nonmetric) variants using 321 adult crania, also from the Terry Collection. Of the 72 variants, only 61 had sufficient
variability for analysis. Corruccini (1974) used descriptive statistics to study sex differences, age dependence, intercorrelations, and correspondence between metric and nonmetric
analysis. He found significant sex differences (19 of 61 traits in White crania and 9 of 61 traits in Black crania) and age differences (two times as many as can be explained by random error) and while inter-trait correlation was low, it was found to be significant overall.
is not conducive to studying the complex relationships leading to skeletal variation.
However, he asserts that nonmetric traits are still useful when analyzed in conjunction with other types of data, especially in looking at extinct populations.
However, other studies have called into question the use of nonmetric traits for heritability studies at all. Carpenter (1976) directly compared nonmetric to metric traits as predictors of age, ancestry, and sex using 317 crania from the Terry Collection to study 12 metric and 15 nonmetric variables. He used a three-way MANOVA and stepwise
discriminant analysis to rank 27 variables. He tested the overall data, metric data only, nonmetric data only, and data with the best indicators of a given ancestry and sex category. Metric variables were significant sex and ancestry indicators, while nonmetric variables were not found to be significant indicators for either.
Rightmire (1972) also collected both metric and discrete data, using a series of skulls of East African origin, which he analyzed in conjunction with discrete data from a sample of South African Bantu speakers. Mahalanobis’ D2
the Venda. Though he notes that biological and linguistic data need not always agree, he cites that their agreement in this case suggests that this account of tribal relationships is most likely the most accurate. He suggests that problems with the nonmetric trait analysis may have stemmed from low frequencies of the traits as well as potential problems with the statistical method utilized (“measure of divergence”). Even though he does not judge one type of skeletal trait as more useful than the other, he states that in this study metric traits were found to provide useful information when treated with the proper statistics.
The studies above use craniometric and nonmetric traits to define phenotypic differences between human subpopulations. Another way to characterize variation is by investigating variation within a subpopulation. This can be accomplished by estimating the heritability of phenotypic traits such as craniometric and nonmetric traits. There are two commonly used measures of heritability: broad sense and narrow sense. Broad sense
heritability is defined as the proportion of the variation in phenotypic trait expression that can be attributed to genetic variation (Hamilton, 2009); it measures the extent to which
phenotype can be predicted by genotype (Falconer & Mackay, 1996). Narrow-sense heritability is the proportion of variation in phenotype tht can be explained by alleles
transmitted from parents to offspring; it quantifies the degree to which relatives resemble one another and how accurately phenotypes in one generation can predict phenotypes in the next generation (Falconer & Mackay, 1996). It is narrow-sense heritability which is most
commonly estimated in studies of within subpopulation variation.
because the villagers traditionally exhume crania and long bones from churchyard graves and carefully bleached and decorated them with the name of the individual. While the purpose is to make room for new burials, this tradition, combined with church records, allows
anthropologists the rare opportunity to collect human skeletal data from a large collection with known lineages, spanning two centuries.
Sjovold (1984) was able to use 346 skulls of the 600 remaining on display in the charnel house to calculate heritability in parent-offspring pairs and tested for significance using an F distribution at 90% (or α = 0.1) and 75% (or α = 0.25) levels of significance. In order to account for the possibility of assortative mating between parents, he calculated correlations between measurements for complete pairs of parents and tested for significance with a t-test. He derived his 29 metric measurements using cranial landmarks and traditional measurements from Howells (1973) and found that twenty-two of the measurements were statistically significantly heritable at 75% (α = 0.25). He derived 30 nonmetric traits from Berry and Berry (1967) and found that overall nonmetric traits had a relatively low heritability with a large standard deviation. In fact, only 6 of the 14 traits he was able to estimate heritability for statistically significant at the 90% level (α = 0.1). At the 75% level (α = 0.25), seven more traits were statistically significant.
parieto-occipital sutures, metopism, fronto-temporal articulation, palatine and maxillary tori. He also found the presence or absence of several foramina to have heritability greater than zero, for example on the parietal, accessory lesser palatine, zygomatico-facial region, and the
supraorbital foramen, as well as the location of the mastoid and anterior ethmoid foramen and closed or open foramen spinosum. He emphasizes throughout his discussion and conclusion that because some metric traits and some nonmetric traits have heritability estimates greater than zero does not mean that all of them do.
More recently, Carson (2006a, 2006b) investigated the heritability of metric and nonmetric traits using 298 crania from a collection from Hallstatt. She collected 44 nonmetric traits calculated as both dichotomous and continuous data (none using location) and 33 craniometric measurements. She outlines five problems regarding nonmetric data, three of which are particularly pertinent to this thesis:
1. Violation of the assumed underlying continuous distribution affects heritability estimates, but as this distribution cannot be observed, it is difficult to assess the best statistical correction.
2. Data collection of nonmetric traits assumes that these traits will be scored exactly the same by every observer, which is not necessarily true (Gualdi-Russo et al., 1999; Hallgrimsson et al., 2005).
3. Scoring nonmetric traits as present or absent fails to record variance in degrees of expression or to consider secondary thresholds of liability.
She used maximum-likelihood variance components analysis in order to
accommodate for pedigree data beyond parent-offspring pairs and found several heritability estimates in nonmetric traits to be low with large standard errors. Though ten traits were found to have heritability values different from the null hypothesis h2=0, sixteen traits had a heritability not different than zero. Carson argues that these low values call into question whether nonmetric traits should be used to study biological relationships. She also found that when assessing heritability of nonmetric traits, it is better to record traits using standardized dichotomous definitions than scoring them on a multi-level scale as this can sometimes decrease their heritability estimates. Overall, craniometric traits had higher heritability estimates than nonmetric traits.
Cheverud and Buikstra
The conclusions of the above research differ from the results of the third Cheverud and Buikstra (1982) study on nonmetric traits in a population of rhesus macaques. This thesis is a test of this third paper, which directly compares metric and nonmetric traits. However, the two earlier papers provide important context and background information for conclusions reached in the results of the third paper. Cheverud and Buikstra (1981a; 1981b; 1982) studied the same population of mother-offspring pairs of rhesus macaques in all three papers. The advantage of studying rhesus macaques rather than humans lies in the ability for more control over environmental variability and improved record-keeping regarding lineages. In the first paper (1981a), the authors calculate heritability for nonmetric traits (Falconer, 1965; 1967). With it, they found that foraminal traits have lower heritability than hyperstotic or hypostotic traits and that there is a substantial amount of variability for nonmetric cranial traits in this population. In the second paper (1981b), the authors investigate phenotypic, genetic, and environmental correlations. They found that genetic correlation patterns, which affect nonmetric trait variation, act locally on the cranium, while environmental and phenotypic correlations do not show this local “neighborhood” pattern of correlation.
quantitative genetic methods”. Cheverud and Buikstra (1982) compared distributions of heritability estimates of both metric and nonmetric traits using the Mann-Whitney U test that tests the null hypothesis that two populations (or in this case, two sets of trait data) have the same distribution (Ossenberg, 1976). They also compared hyperstotic and foraminal
nonmetric traits. In their methods, the authors note the potential for type II errors because their methods of analysis assume that the heritability estimates being analyzed are
independent of each other.
Cheverud and Buikstra (1982) concluded nonmetric traits had significantly higher heritability than metric traits, which was attributed to the high heritability estimates of hyperstotic traits such as supraorbital notch and divided hypoglossal canal. Foraminal traits, on the other hand, did not have higher heritability estimtes than nonmetric traits or metric traits. However, these results are hampered by several problems in the methods of the study. The 14 nonmetric traits analyzed were chosen due to their high heritability estimates in their two previous studies and relative lack of age and sex-related variation. In addition, the 56 metric traits they used included only 6 measurements which are also found in the list of standard craniometric measurements (Moore-Jansen et al., 1994). By contrast, the heritability of the 56 metric traits had not been estimated previously, meaning the list of 56 metric traits was not narrowed down to the most highly heritable and those with the least amount of age- and sex-related variation as the nonmetric traits had been. To account for variation not
PREVIOUS RESEARCH USING THE ORAU COTTON-TOP TAMARINS
Cheverud (1994) studied the Oak Ridge Associated Universities’ Marmoset research Center (ORAU) population of cotton-top tamarins, the same collection from which the sample for this thesis was derived. He compared the quantitative variation represented in molecular genetic data to variance in body weight. The heterozygosity for this colony was estimated at less than 1%. This estimate is low for primate species whose heterozygosity estimates typically fall between 2% and 10% (Forman et al., 1986; Shotake et al., 1991). Cheverud explains the low heterozygosity by suggesting that the colony may have undergone a “moderate bottleneck” because the founding population was comprised of 100 cotton-top tamarins. Though the genetic diversity of this sample may be less than that of wild
populations of cotton-top tamarins, their status as an endangered species leaves researchers with captive cotton-top tamarins as the only option for study.
In 1996, Cheverud investigated the quantitative genetic variability of saddleback and cotton-top tamarins. He collected 36 3D cranial landmarks from 328 cotton-top tamarin crania from this collection as well as from wild cotton-top tamarins. He extracted 39 linear cranial measurements from the 36 landmarks and used the log-likelihood function and maximum likelihood to estimate heritabilities, means, and phenotypic variances. Maximum likelihood estimates were calculated using iteration with the search procedure GEMINI (Lalouel, 1979) and the log-likelihood function below:
( ) ( ) ( ) ( ) ( ) | | ( ) ( )
where: ln(LK) is the log-likelihood, x is the N ⃰ 1 vector of measurements, u is the N*1 vector of the trait’s mean value, and N is the sample size.
Cheverud (1996) utilized a MANOVA to compare population means and investigate the statistical significance of sex and the interaction of sex with environment. He found no sex by environment interaction in the sample, but a significant difference between the sexes. Heritability estimates for the cotton-top tamarins ranged from 0.10-0.69 with 92% of
estimates statistically significantly greater than zero at the 0.05 level. The cotton-top tamarins in his sample were found to have an average heritability of 45%.
The crania of the ORAU cotton-top tamarins have also previously been used in a study of nonmetric traits (Jemmott and Falsetti, 2003). Though the study began as a master’s thesis, the findings were presented as a poster at the Annual Meeting of the American
Twenty-two traits were observed and heritability was by regressing parental phenotype values on their offspring’s values (Falconer and Mackay, 1996).
where: b is the regression coefficient and h2 is heritability
It is also noted that using the offspring of fathers is the more accurate method because they are less likely to be biased by environmental sources of covariance, but study of patrilineages would be difficult outside of a laboratory setting.
The traits used included: metopic suture, coronal ossicles, sagittal ossicles,
When pooling the left and right sides, regression of dams on offspring for accessory infraorbital foramina was significant (b = 0.194; p-value = 0.029; h2 = 0.388). When run separately, none of the regression coefficients for the three foraminal traits (infraorbital, zygomaticofacial, and mental foramina) were significant. Heritability estimates of accessory foramina were not found to be significantly different from zero. Jemmott and Falsetti (2003) suggest environmental covariates may be responsible for the manifestation of accessory foramina. The divided hypoglossal canal trait (the only basilar trait) had an incidence rate of 33.3-42 percent and heritability estimates of 0.494 and 0.839, respectively.
Thus, the purpose of this study is to compare metric and nonmetric trait heritability estimates in the ORAU population of cotton-top tamarins. This study will also compare the metric and nonmetric traits used by Cheverud and Buikstra (1981a, 1981b, 1982) to standard human forensic metric traits (Moore-Jansen et al., 1994) and the standard set of human nonmetric traits collected by the Smithsonian Institution. These comparisons will accomplish three primary goals:
1. To retest Cheverud and Buikstra’s (1982) findings on another population.
2. To calculate heritability estimates using more current statistical procedures which accommodate more detailed lineage information (Carson, 2006a; Carson, 2006b) than the procedures available to Cheverud and Buikstra (1981a, 1981b, 1982). 3. To better facilitate the comparison of these results to other studies through the use
MATERIALS AND METHODS
Materials: Cotton-top Tamarins
Like the population of rhesus macaques in Cheverud and Buikstra’s studies (1981a; 1981b; 1982), the population of cotton-top tamarins (Saguinus oedipus) utilized in this study are advantageous because the collection is comprised of several generations of tamarins, which have documented age, sex, and lineage. Cotton-top tamarins are small arboreal primates (approximately 0.5kg) found in Columbia (Jemmott and Falsetti, 2003). The collection from which the skulls for this study are derived originated at the Marmoset Research Center (ORAU) and are currently housed at the University of Tennessee at
Knoxville (Hutchison and Cheverud, 1995). The colony was founded in the mid-1960s along with other breeds of tamarins. While alive, the cotton-top tamarins were used for studies into the natural history of colon cancer (Clapp et al., 1985). It is important to note that these tests were only conducted on adults and are therefore unlikely to have affected the growth rates or morphology of the tamarins. Of the original 450 tamarins in the colony, only one third produced laboratory-born offspring. One hundred and forty-four tamarin crania were used in this study. The recorded genealogies run two to three generations deep.
Methods: Data Collection
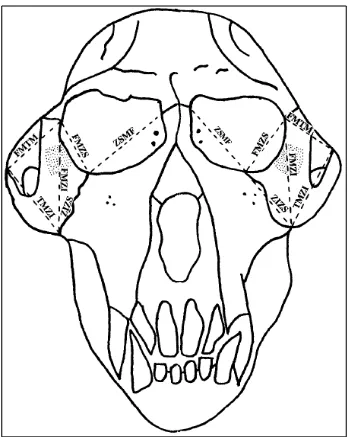
Cheverud and Buikstra (1981a). Tables 4.1 and 4.2 present the measurements and nonmetric traits used. However, because most of these measurements and traits were not standard and the descriptions given in the article are condensed, there were some difficulties in finding trait and measurement definitions in the literature.
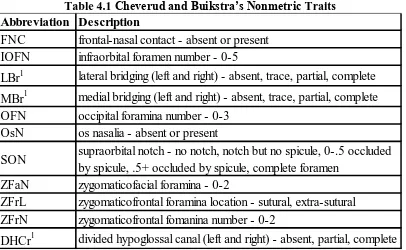
Table 4.1 Cheverud and Buikstra’s Nonmetric Traits
1
Trait is also present in The Smithsonian Institution’s nonmetric data set under the same abbreviation.
Abbreviation Description
FNC frontal-nasal contact - absent or present
IOFN infraorbital foramen number - 0-5
LBr1 lateral bridging (left and right) - absent, trace, partial, complete
MBr1 medial bridging (left and right) - absent, trace, partial, complete
OFN occipital foramina number - 0-3
OsN os nasalia - absent or present
SON supraorbital notch - no notch, notch but no spicule, 0-.5 occluded
by spicule, .5+ occluded by spicule, complete foramen
ZFaN zygomaticofacial foramina - 0-2
ZFrL zygomaticofrontal foramina location - sutural, extra-sutural
ZFrN zygomaticofrontal fomanina number - 0-2
Table 4.2 Cheverud and Buikstra’s Metric Measurements
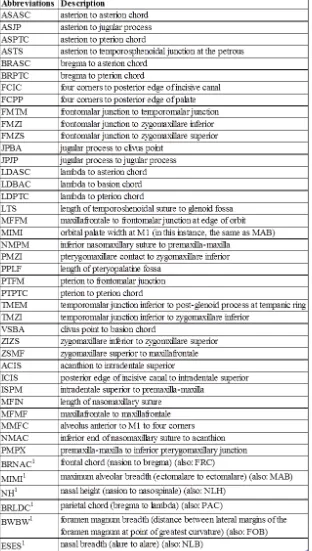
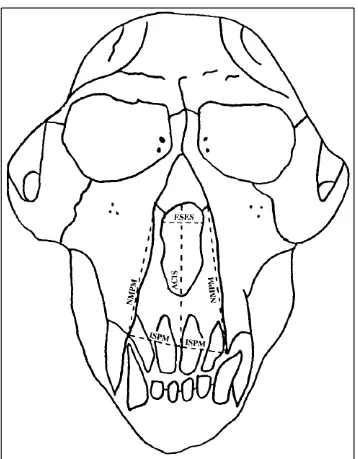
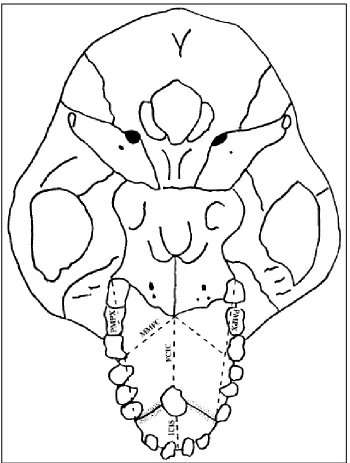
To that end I supplemented the definitions provided by Cheverud and Buikstra with anatomical information from Hershkovitz’s Living New World Monkeys (Platyrrhini): With an Introduction to Primates (1977) as well as information and illustrations from other articles published by Cheverud (Marriog et al., 2001; Cheverud and Buikstra, 1982; Cheverud, 1979; Richtsmeier et al., 1984). Figures 4.1, 4.2, 4.3, and 4.4 illustrate the landmarks and
measurements used.
The second phase of this study used standardized sets of metric measures from the forensic manual (Moore-Jansen et al., 1994) and the nonmetric traits used by Osteoware (The Smithsonian Institution), a software that is used for skeletal documentation. Identification of some of these nonmetric traits are not homologous across species and thus, a handful of traits needed to be adapted to tamarin anatomy. By using standard measures and traits for the second phases, this study allowed repeatability and provided data that can be compared to other studies. The metric and nonmetric traits used are listed in Tables 4.3 and 4.4. Figures 4.5, 4.6, and 4.7 illustrate the locations of the landmarks used for the metric traits.
Table 4.3 Standard Nonmetric Traits
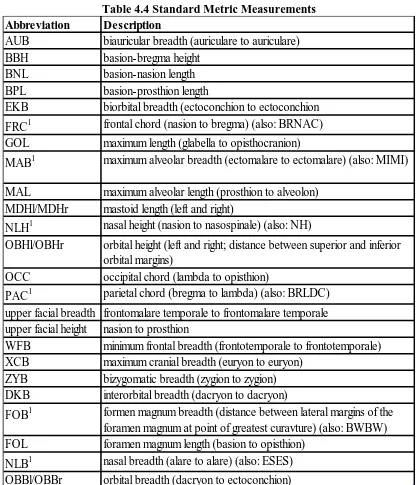
Table 4.4 Standard Metric Measurements
1Trait is also present in Cheverud and Buikstra’s (1982) craniometric data set. The alternate abbreviation is listed in the description.
Abbreviation Description
AUB biauricular breadth (auriculare to auriculare)
BBH basion-bregma height
BNL basion-nasion length
BPL basion-prosthion length
EKB biorbital breadth (ectoconchion to ectoconchion FRC1 frontal chord (nasion to bregma) (also: BRNAC) GOL maximum length (glabella to opisthocranion)
MAB1 maximum alveolar breadth (ectomalare to ectomalare) (also: MIMI) MAL maximum alveolar length (prosthion to alveolon)
MDHl/MDHr mastoid length (left and right)
NLH1 nasal height (nasion to nasospinale) (also: NH)
OBHl/OBHr orbital height (left and right; distance between superior and inferior orbital margins)
OCC occipital chord (lambda to opisthion)
PAC1 parietal chord (bregma to lambda) (also: BRLDC) upper facial breadth frontomalare temporale to frontomalare temporale upper facial height nasion to prosthion
WFB minimum frontal breadth (frontotemporale to frontotemporale) XCB maximum cranial breadth (euryon to euryon)
ZYB bizygomatic breadth (zygion to zygion) DKB interorbital breadth (dacryon to dacryon)
FOB1 formen magnum breadth (distance between lateral margins of the foramen magnum at point of greatest curavture) (also: BWBW) FOL foramen magnum length (basion to opisthion)
Methods: Statistical Analysis
The software SOLAR 7.2.5 was used to calculate heritability estimates and
descriptive statistics for both metric and binary discrete traits (Almasy and Blangero, 1998). SOLAR was created specifically for genetic variance components analysis such as
quantitative genetic analysis and covariate screening, though it is most commonly used for linkage analysis. For each trait, heritability estimates, standard error, and the corresponding p-values were calculated using maximum-likelihood components analysis and significance was declared with an alpha level of 0.05. Maximum-likelihood components analysis as applied in SOLAR uses iteration to find the model with the parameter values that best fit the data (Stone, 2004). The dependent variables age and sex and the interaction of age and sex were tested using the “polygenic –screen” command.
As Carson (2006a) notes however, SOLAR only supports continuous data and binary data; it does not support multi-level categorical data. Nonmetric traits whose scoring could not be collapsed into absent/present or could not be expressed as continuous, were dropped from the study in order to ensure that all of the heritability estimates were directly
Treatment of these nonmetric traits as continuous traits is acceptable because of the assumed underlying continuousness of nonmetric traits (Cheverud, 1979; Corruccini, 1976).
Methods: Intra-Observer Error
Twenty crania were selected to be measured a second time in order to assess intra-observer error. These crania were divided by sex, using only complete crania. This ensured that ten crania of each sex were selected and that all of the measurements could be taken on all twenty crania. Once these criteria were met, the crania were selected randomly.
Several different calculations were used to estimate and visualize intra-observer error, all of which were calculated in Microsoft Excel 2010. First, the difference between each measurement for each cranium was found. Using these differences, the technical error of measurement (TEM) was also calculated in order to estimate the standard deviation of differences in the repeated measures using Lewis’ equation (1999):
√∑
where: D is the absolute value of the difference between the two measurements on the same cranium and N is the total number of measurements taken in that set.
The coefficient of reliability was calculated using TEM (Lewis, 1999). The
error. The coefficient of reliability is also independent of the unit of measurement used. Additionally,
(( ) ( ) )
RESULTS
Standard Metric Measurements
Table 5.1 Summary Statistics for Standard Metric Measurements Measurement Count Mean (mm) Standard Deviation
GOL 143 39.51 1.51
XCB 143 26.54 0.94
ZYB 142 33.27 1.84
BBH 142 25.74 1.08
BNL 143 32.50 0.87
BPL 137 34.39 1.02
MAB 140 17.18 0.55
MAL 137 16.86 2.72
AUB 144 26.82 0.93
upper facial height 139 14.63 1.09
WFB 144 22.22 1.16
upper facial breadth 143 26.17 0.81
NLH 141 11.87 0.83
NLB 141 6.33 0.49
OBBl 144 11.28 0.42
OBBr 144 11.26 0.46
OBHl 144 10.49 0.47
OBHr 144 10.49 0.53
EKB 144 26.29 0.72
DKB 144 5.78 0.33
FRC 143 25.46 1.05
PAC 143 23.96 1.12
OCC 143 11.91 0.92
FOL 143 6.88 0.48
FOB 143 6.62 0.37
MDHl 144 4.58 0.62
Table 5.2 Heritability Estimates of Standard Metric Measurements
Measurement n Max Likelihood h2 (p-value)
SE of h2 Proportion of Variance due to Covariates (Significant Covariates, p-value)
AUB 145 0.261 (0.024) 0.145 none
BBH 143 0.199 (0.032) 0.122 none
BNL 118 0.467 (0.002) 0.187 0.079 (age, 0.038)
BPL 138 0.650 (0.0000004) 0.142 none
EKB 119 0 (0) N/A 0.069 (age, 0.015)
FRC 144 0.402 (0.002) 0.167 none
GOL 144 0.331 (0.010) 0.166 none
MAB 115 1 (0.0000202) N/A 0.077 (age, 0.0000561)
MAL 138 0.208 (0.012) 0.115 none
MDHl 145 0.428 (0.001) 0.167 none
MDHr 145 0.489 (0.0005) 0.177 none
NLH 142 0.638 (0.0002) 0.212 none
OBHr 145 0.356 (0.006) 0.162 none
OCC 118 0.467 (0.003) 0.2 0.043 (age*sex, 0.035)
PAC 144 0.229 (0.088) 0.189 none
upper facial breadth 118 0.083 (0.311) 0.177 0.110 (age, 0.008)
upper facial height 140 0.245 (0.041) 0.16 none
WFB 119 0.517 (0.004) 0.216 0.172 (age, 0.008; age*sex, 0.033)
XCB 144 0.164 (0.198) 0.207 none
ZYB 116 0.139 (0.236) 0.207 0.144 (age, 0.004)
DKB 119 0.383 (0.017) 0.195 0.156 (age, 0.0008)
FOB 144 0.416 (0.005) 0.186 none
FOL 144 0.608 (0.000002) 0.133 none
NLB 145 0.070 (0.268) 0.121 none
OBBl 145 0.087 (0.210) 0.177 none
OBBr 145 0.123 (0.215) 0.17 none
Cheverud and Buikstra’s Metric Measurements
Table 5.3 Summary Statistics for Cheverud and Buikstra’s Metric Measurements
Measurement Count Mean (mm) Standard Deviation
BRPTC 143 39.51 1.51
PTPTC 144 33.27 1.84
MFFM 144 25.74 1.08
PTFM 144 32.50 0.87
LDASC 143 12.20 0.75
ASPTC 144 16.86 2.72
BRASC 143 26.82 0.93
LDPTC 143 32.10 1.11
LDBAC 143 22.22 1.16
VSBA 139 26.17 0.81
ASJP 143 11.87 0.83
ASASC 143 20.94 0.99
JPBA 143 11.28 0.42
JPJP 143 10.49 0.47
MFMF 143 10.49 0.53
MFIN 142 26.29 0.72
ACIS 137 5.78 0.33
NMAC 140 25.46 1.05
ISPM 138 11.91 0.92
NMPM 141 6.88 0.48
PMPX 141 6.62 0.37
PPLF 143 4.58 0.62
MMFC 143 9.19 0.39
FCIC 141 7.16 0.60
ICIS 139 3.59 0.36
FCPP 143 4.72 0.59
FMZS 144 8.18 0.65
TMZI 141 4.36 0.78
FMTM 141 11.40 0.77
FMZI 144 11.42 0.74
TMEM 141 13.26 0.80
LTS 143 7.10 0.55
ASTS 143 16.17 0.80
PMZI 141 14.55 0.80
ZIZS 144 8.53 0.64
ZSMF 144 9.78 0.52
BRNAC 143 25.46 1.05
MIMI 140 17.18 0.55
NH 141 11.87 0.83
BRLDC 143 23.96 1.12
BWBW 143 6.62 0.37
Table 5.4 Heritability Estimates for Cheverud and Buikstra’s Metric Measurements
Measurement n Max Likelihood h2 (p-value)
SE of h2 Proportion of Variance due to Covariates (Significant Covariates, p-value)
ASASC 144 0.468 (0.002) 0.167 none
ASJP 144 0.290 (0.025) 0.176 none
ASPTC 119 0.292 (0.029) 0.167 0.040 (age, 0.011)
ASTS 144 0.148 (0.160) 0.16 none
BRASC 144 0.451 (0.067) 0.359 none
BRPTC 144 0.309 (0.020) 0.174 none
FCIC 142 0.161 (0.099) 0.141 none
FCPP 144 0.473 (0.0006) 0.181 none
FMTM 117 0.295 (0.082) 0.23 0.059 (age*sex, 0.034)
FMZI 119 0.069 (0.358) 0.197 0.088 (age*sex, 0.019)
FMZS 119 0.382 (0.005) 0.166 0.035 (age, 0.037)
JPBA 144 0.047 (0.311) 0.01 none
JPJP 118 0.448 (0.004) 0.195 0.034 (age, 0.023)
LDASC 118 0.651 (0.002) 0.255 0.0006 (age*sex, 0.011)
LDBAC 144 0.328 (0.025) 0.198 none
LDPTC 118 0.357 (0.033) 0.213 0.045 (age, 0.021)
LTS 144 0.245 (0.058) 0.179 none
MFFM 145 0 (0.5) N/A 0.089 (sex, 0.005)
NMPM 142 0 (0.5) N/A none
PMZI 142 0.272 (0.038) 0.167 none
PPLF 144 0.383 (0.001) 0.151 none
PTFM 119 0.374 (0.024) 0.211 0.193 (age, 0.00004)
PTPTC 119 0.147 (0.206) 0.199 0.134 (age*sex, 0.007)
TMEM 143 0.432 (0.003) 0.187 none
TMZI 117 0.271 (0.097) 0.232 0.062 (age, 0.047)
VSBA 114 0.295 (0.035) 0.187 0.096 (age*sex, 0.425)
ZIZS 145 0.378 (0.006) 0.168 none
ZSMF 145 0.084 (0.317) 0.187 none
ACIS 138 0.776 (1.62E-9) 0.122 none
ICIS 140 0.247 (0.096) 0.201 0.045 (sex, 0.025)
ISPM 113 0.262 (0.086) 0.21 0.102 (age*sex, 0.006)
MFIN 118 0 (0.5) N/A 0.081 (age*sex, 0.0007)
MFMF 119 0.372 (0.022) 0.208 0.117 (age, 0.0002)
MMFC 118 0.100 (0.303) 0.209 0.132 (age, 0.035; sex, 0.024)
NMAC 116 0.398 (0.015) 0.215 0.080 (age*sex, 0.001)
PMPX 142 0.368 (0.008) 0.175 none
BRNAC 144 0.402 (0.002) 0.167 none
MIMI 115 1 (0.0000202) N/A 0.077 (age, 0.0000561)
NH 142 0.638 (0.0002) 0.212 none
BRLDC 144 0.229 (0.088) 0.189 none
BWBW 144 0.416 (0.005) 0.186 none
Standard Nonmetric Traits
Table 5.5 Summary Statistics for Standard Nonmetric Traits Standard Nonmetric Count Present Absent
IOSL 143
SONL 142 140 2
SONR 142 139 3
SOFL 142 2 140
SOFR 142 2 140
Sag 140 4 136
MidPf 138 4 134
MFNL 141
MFNR 141
CL 142 3 139
CR 142 2 140
Table 5.6 Heritability Estimates for Standard Nonmetric Traits
Trait n Max Likelihood
h2 (p-value)
SE of h2 Proportion of Variance due
to Covariates (Significant Covariates, p-value)
CL 143 0 (0.5) N/A none
CR 143 0 (0.5) N/A none
DHCl 143 0.236 (0.074) 0.176 none
DHCr 143 0.077 (0.344) 0.198 none
IOSL 145 0 (0.5) N/A none
LBl 144 0.132 (0.111) 0.122 none
LBr 144 0.072 (0.302) 0.15 none
MBl 116 0.610 (0.008) 0.239 none
MBr 116 0.610 (0.008) 0.239 none
MFNl 143 0.351 (0.002) 0.152 none
MFNr 143 0.136 (0.166) 0.156 none
MidPf 140 0 (0.5) N/A none
PTD 144 0.283 (0.015) 0.159 none
PTL 144 0.197 (0.071) 0.153 none
Sag 142 0 (0.5) N/A none
SOFl 144 0 (0.5) N/A none
SOFr 144 0 (0.5) N/A none
SONl 144 0 (0.5) N/A none
Cheverud and Buikstra’s Nonmetric Traits
Table 5.7 Summary Statistics for Cheverud and Buikstra Nonmetric Traits
Table 5.8 Heritability Estimates for Cheverud and Buikstra’s Nonmetric Traits Trait Count Present Absent
OsN 142 26 116
FNC 140 SON 142 ZFrL 130 ZFrN 143 IOFN 143 ZFaN 144 MBr 116 OFN 98 LBr 144 DHCR 141 multi-level/continuous multi-level/continuous multi-level/continuous multi-level/continuous multi-level/continuous multi-level/continuous multi-level/continuous multi-level/continuous multi-level/continuous multi-level/continuous
Trait n Max Likelihood h2 (p-value)
SE of h2 Proportion of Variance due to Covariates (Significant Covariates, p-value)
FNC 118 0 (0.5) N/A none
IOFN 145 0.328 (0.026) 0.178 none
OFN 100 0.100 (0.267) 0.174 none
OsN 118 0.123 (0.392) 0.52 0.105 (age, 0.027)
SON 118 0.157 (0.143) 0.165 0.034 (age, 0.007)
ZFaN 119 0.075 (0.352) 0.212 0.067 (age, 0.037)
ZFrL 129 0.387 (0.017) 0.21 none
ZFrN 145 0.095 (0.220) 0.133 none
MBr 116 0.610 (0.008) 0.239 none
LBr 144 0.072 (0.302) 0.15 none
Significant Heritability Estimates
Statistical significance was calculated with alpha level p < 0.05, indicating that the heritability estimate was significantly different from the null hypothesis that h2 = 0. Of the 91 measurements and traits for which estimates were calculated, 46 were statistically
significantly greater than zero. Of these, only 19 were greater than 0.4, Carson’s (2006a) point of significance (a more stringent significance point than Cheverud and Buikstra used in their 1982 article). Of these 19, only 2 were nonmetric traits (e.g. medial bridging of the left and right sides). Of the 17 statistically significant metric traits, 6 are traits from Cheverud and Buikstra’s set, 8 are traits from the standard forensic set, and the remaining 3 are included in both sets. The standard errors for all of the traits ranged from 0.010 (jugular process to clivus point, JPBA) to 0.520 (os nasalia, OsN), though the majority of standard errors fell between 0.1 and 0.25.
Table 5.9 Statistically Significant Heritability Estimates.
1
Group names are abbreviated. SM for Standard Metric, SN for Standard Nonmetric, CM of Cheverud and Buikstra’s Metric, and CN for Cheverud and Buikstra’s Nonmetric.
2If the trait appears in both the Standard set and Cheverud and Buikstra’s set, the trait is listed by the name found in the Standard set.
Measurement / Trait
Group1 n Max Likelihood
h2 (p-value)
SE of h2 Proportion of Variance due to
Covariates (Significant Covariates, p-value)
MAB SM/CM2 115 1 (0.0000202) N/A 0.077 (age, 0.0000561)
ACIS CM 138 0.776 (1.62E-9) 0.122 none
LDASC CM 118 0.651 (0.002) 0.255 0.0006 (age*sex, 0.011)
BPL SM 138 0.650 (0.0000004) 0.142 none
NLH SM/CM2 142 0.638 (0.0002) 0.212 none
MBl SN 116 0.610 (0.008) 0.239 none
MBr SN/CN2 116 0.610 (0.008) 0.239 none
FOL SM 144 0.608 (0.000002) 0.133 none
WFB SM 119 0.517 (0.004) 0.216 0.172 (age, 0.008; age*sex, 0.033)
MDHr SM 145 0.489 (0.0005) 0.177 none
FCPP CM 144 0.473 (0.0006) 0.181 none
ASASC CM 144 0.468 (0.002) 0.167 none
OCC SM 118 0.467 (0.003) 0.200 0.043 (age*sex, 0.035)
BNL SM 118 0.467 (0.002) 0.187 0.079 (age, 0.038)
JPJP CM 118 0.448 (0.004) 0.195 0.034 (age, 0.023)
TMEM CM 143 0.432 (0.003) 0.187 none
MDHl SM 145 0.428 (0.001) 0.167 none
FOB SM 144 0.416 (0.005) 0.186 none
FRC SM/CM2 144 0.402 (0.002) 0.167 none
NMAC CM 116 0.398 (0.015) 0.215 0.080 (age*sex, 0.001)
ZFrL CN 129 0.387 (0.017) 0.210 none
DKB SM 119 0.383 (0.017) 0.195 0.156 (age, 0.0008)
PPLF CM 144 0.383 (0.001) 0.151 none
FMZS CM 119 0.382 (0.005) 0.166 0.035 (age, 0.037)
ZIZS CM 145 0.378 (0.006) 0.168 none
PTFM CM 119 0.374 (0.024) 0.211 0.193 (age, 0.00004)
MFMF CM 119 0.372 (0.022) 0.208 0.117 (age, 0.0002)
PMPX CM 142 0.368 (0.008) 0.175 none
LDPTC CM 118 0.357 (0.033) 0.213 0.045 (age, 0.021)
OBHr SM 145 0.356 (0.006) 0.162 none
MFNl SN 143 0.351 (0.002) 0.152 none
OBHl SM 145 0.350 (0.005) 0.157 none
GOL SM 144 0.331 (0.010) 0.166 none
IOFN CN 145 0.328 (0.026) 0.178 none
LDBAC CM 144 0.328 (0.025) 0.198 none
BRPTC CM 144 0.309 (0.020) 0.174 none
VSBA CM 114 0.295 (0.035) 0.187 0.096 (age*sex, 0.425)
ASPTC CM 119 0.292 (0.029) 0.167 0.040 (age, 0.011)
ASJP CM 144 0.290 (0.025) 0.176 none
PTD SN 144 0.283 (0.015) 0.159 none
PMZI CM 142 0.272 (0.038) 0.167 none
AUB SM 145 0.261 (0.024) 0.145 none
upper facial height SM 140 0.245 (0.041) 0.160 none
MAL SM 138 0.208 (0.012) 0.115 none
Trends in the Number of Heritability Estimates by Region on the Cranium
Rather than analyze heritability estiamtes by comparing the proportion of significant heritability estimates in categorical groups of nonmetric traits to each other, trends in
heritability estimates for both metric and nonmetric traits were investigated by examining the number of statistically significant heritability estimates in different regions of the cranium. Of the 45 traits which had heritability estimates statistically significantly greater than zero, 19 traits had estimates greater than 0.400 (Table 5.9). Of these 19, 9 measurements are length or height measurements rather than width measurements: acanthion to intradentale superior (ACIS), nasal height (NLH), basion-prosthion length (BPL), foramen magnum length (FOL), four corners to posterior edge of palate (FCPP), occipital chord (OCC), basion-nasion length (BNL), temporomalar junction inferior to post-glenoid process at the tympanic ring
well as medial bridging on the left and right sides (MBl and MBr). Eight measurements located in the craniofacial region were greater than 0.400 and were statistically significant (25% of the craniofacial measurements collected): maximum alveolar breadth (MAB), acanthion to intradentale superior (ACIS), basion-prosthion length (BPL), nasal height (NLH), minimum frontal breadth (WFB), four corners to posterior edge of palate (FCPP), basion-nasion length (BNL), and frontal chord (FRC). Six of these involve the naso-maxillary region (33.33% of naso-naso-maxillary related measurements collected): maximum alveolar breadth (MAB), acanthion to intradentale superior (ACIS), basion-prosthion length (BPL), nasal height (NLH), four corners to posterior edge of palate (FCPP), and basion-nasion length (BNL).
Including the significant heritability estimates which are less than 0.400, there are an additional 14 traits which are located in the craniofacial region (a total 60.53% of all
craniofacial measurements): inferior end of nasomaxillary suture to acanthion (NMAC), zygomaticofrontal foramina location (ZFrL), interorbital breadth (DKB), frontomalar
basion chord (LDBAC), clivus point to basion chord (VSBA), and asterion to jugular process chord (ASJP), and an 2 nonmetric traits: mastoid foramen number on the left side (MFNl) and palatine torus development (PTD). An additional 6 measurements are located in the naso-maxillary region (66.67% of the total naso-maxillary measurements): inferior end of nasomaxillary suture to acanthion (NMAC), interorbital breadth (DKB), premaxilla-maxilla to inferior pterygomaxillary junction (PMPX), premaxilla-maxilla to zygomaxillare inferior (PMZI), maximum alveolar length (MAL), and maxillafrontale to maxillarfrontale (MFMF).
Extreme Heritability Estimates
Table 5.10 Measurements with Extreme (0 or 1) Heritability Estimates
Finding nonmetric traits with heritability estimates of 0 is not unexpected and is consistent with Carson’s (2006a) results. On the other hand, though it is statistically feasible for a measurement to have either heritability estimate, these outcomes are realistically more likely to be due to the use of protocols designed for species other than those the
measurements were collected on; anatomical differences between humans, rhesus macaques, and cotton-top tamarins, are expected to affect the reliability of the measurements used. Though the standard craniometric measurements are designed to be homologous, as a whole, these measurements were developed for humans, and morphological variation between humans and cotton-top tamarins may create error in the data which is not explained by measurement error. Cheverud and Buikstra’s (1982) craniometric measurements were
developed for rhesus macaques and morphological differences between rhesus macaques and
Measurement /
Trait Group n
Max Likelihood
h2 (p-value) SE of h
2
Proportion of Variance due to Covariates (Significant Covariates, p-value)
EKB SM 119 0 (0.5) N/A 0.069 (age, 0.015)
MAB SM/CM 115 1 (0.0000202) N/A 0.077 (age, 0.0000561)
MFFM CM 145 0 (0.5) N/A 0.089 (sex, 0.005)
NMPM CM 142 0 (0.5) N/A none
MFIN CM 118 0 (0.5) N/A 0.081 (age*sex, 0.0007)
FNC CN 118 0 (0.5) N/A none
CL SN 143 0 (0.5) N/A none
CR SN 143 0 (0.5) N/A none
IOSl SN 145 0 (0.5) N/A none
MidPf SN 140 0 (0.5) N/A none
Sag SN 142 0 (0.5) N/A none
SOFl SN 144 0 (0.5) N/A none
SOFr SN 144 0 (0.5) N/A none
SONl SN 144 0 (0.5) N/A none
cotton-top tamarins may be introducing similar error into the measurement data. This error would be considered a component of variation in phenotype due to environmental differences and may be sufficiently high to over-power variation in phenotype caused by variation in genotype in the estimates. Maximum alveolar breadth (MAB) was the only trait which has a heritability estimate of 1.000. It is highly unlikely that this trait is actually completely determined by genetic inheritance. Another explanation for this estimate is again the use of protocols designed for a different species than the one being measured. While adult cotton-top tamarins have eight molars (four per arcade and two on each side of an arcade), adult humans can have twelve molars. MAB is taken in humans at the greatest width of the maxillary arcade, which is usually near the second molar. In cotton-top tamarins, this is generally located near the first molar (called MIMI by Cheverud and Buikstra). The
difference in arcade anatomy and molar number may have affected the heritability estimate for this measurement.
The measurements that had an estimate of 0 may also be explained by differences in morphology or error due to these morphological differences rather than measurement error. Measurements which had a heritability estimate of 0 include: biorbital breadth (EKB), maxillafrontale to frontomalar junction at the edge of the orbit (MFFM), inferior
on the cranium, variation in dacryon creates variability in where ectoconchion is marked. Perhaps Cheverud and Buikstra used landmark MF for their interorbital width measurement rather than dacryon, and they do not include a measurement across the lateral borders of the eye orbits for this reason.
However, MFFM, which is Cheverud and Buikstra’s measurement for orbit width, also had a heritability estimate of 0. Both landmarks are located at the ends or intersections of sutures, making placement of these landmarks less difficult. Cheverud and Buikstra’s heritability estimate for this measurement was fairly high (0.548, SE = 0.0913). Variation in morphology between rhesus macaques and cotton-top tamarins may be responsible for the very different heritability estimates. This may also be true of NMPM and MFIN. All three are craniofacial measurements determined by suture lines or the intersection of suture lines. Differences in these regions on rhesus macaque crania may be more variable or more heritable than in cotton-top tamarins.
Technical Error of Measurement and the Coefficient of Reliability
Because technical error of measurement (TEM) is expressed in the same units as the data collected, TEMs of measurements which measure different things cannot be compared directly. The coefficients of reliability (R) is a proportion and is used instead to compare between different measurements. For the standard measurements, R ranged from 0.545 to 0.997 with a mean of 0.918. This indicates an overall low proportion of error due to
Table 5.11 TEM and R for All Measurements
1Group names are abbreviated. SM for Standard Metric and CM of Cheverud and Buikstra’s Metric. 2If the trait appears in both the Standard set and Cheverud and Buikstra’s set, the trait is listed by the name found in the Standard set.
Measurement Group TEM (in mm) R 1-R Measurement Group TEM (in mm) R 1-R
GOL SM 0.399 0.893 0.107 ASPTC CM 0.989 0.465 0.535
XCB SM 0.187 0.977 0.023 BRASC CM 0.674 0.486 0.514
ZYB SM 0.065 0.997 0.003 LDPTC CM 0.979 0.477 0.523
BBH SM 0.149 0.945 0.055 LDBAC CM 0.666 0.334 0.666
BNL SM 0.180 0.957 0.043 VSBA CM 0.424 0.543 0.457
BPL SM 0.142 0.976 0.024 ASJP CM 0.498 0.491 0.509
MAB SM/CM2 0.102 0.945 0.055 ASASC CM 0.957 0.401 0.599
MAL SM 0.299 0.856 0.144 JPBA CM 0.281 0.634 0.366
AUB SM 0.084 0.994 0.006 JPJP CM 0.500 0.525 0.475
upper facial height SM 0.127 0.961 0.039 MFMF CM 0.273 0.355 0.645
WFB SM 0.864 0.545 0.455 MFIN CM 0.287 0.336 0.664
upper facial breadth SM 0.150 0.970 0.030 ACIS CM 0.341 0.407 0.593
NLH SM/CM2 0.270 0.833 0.167 NMAC CM 0.366 0.421 0.579
NLB SM 0.130 0.888 0.112 ISPM CM 0.234 0.294 0.706
OBBl SM 0.158 0.855 0.145 NMPM CM 0.437 0.533 0.467
OBBr SM 0.129 0.941 0.059 PMPX CM 0.298 0.489 0.511
OBHl SM 0.133 0.897 0.103 PPLF CM 0.355 0.451 0.549
OBHr SM 0.132 0.947 0.053 MMFC CM 0.267 0.383 0.617
EKB SM 0.091 0.981 0.019 FCIC CM 0.372 0.535 0.465
DKB SM 0.049 0.967 0.033 ICIS CM 0.170 0.670 0.330
FRC SM/CM2 0.155 0.961 0.039 FCPP CM 0.403 0.572 0.428
PAC SM/CM2 0.134 0.987 0.013 FMZS CM 0.302 0.788 0.212
OCC SM 0.173 0.956 0.044 TMZI CM 0.585 0.474 0.526
FOL SM 0.138 0.883 0.117 FMTM CM 0.892 0.492 0.508
FOB SM/CM2 0.124 0.919 0.081 FMZI CM 1.138 0.470 0.530
MDHl SM 0.212 0.893 0.107 TMEM CM 0.717 0.429 0.571
MDHr SM 0.204 0.862 0.138 LTS CM 0.316 0.652 0.348
BRPTC CM 0.571 0.557 0.443 ASTS CM 0.624 0.447 0.553
PTPTC CM 0.566 0.465 0.535 PMZI CM 0.554 0.496 0.504
MFFM CM 0.437 0.449 0.551 ZIZS CM 0.392 0.452 0.548
PTFM CM 0.407 0.321 0.679 ZSMF CM 0.372 0.536 0.464
DISCUSSION
The results of the heritability estimate calculations derived here suggest that metric traits are more heritable than nonmetric traits. Of the 45 significant traits, only 6 are nonmetric traits and of those only 2 have heritability estimates greater than 0.4. Of all
craniometric traits for which heritability estimates were calculated, 60.94% were statistically significant and 22.22% of all nonmetric traits were statistically significant. When dividing the results into the four sets of data: 70.37% of the standard craniometric measurements, 57.14% of Cheverud and Buikstra’s (1982) craniometric measurements, 15.79% of the Smithsonian Institution’s nonmetric traits, and 27.27% of Cheverud and Buikstra’s (1981a, 1981b, 1982) nonmetric traits were statistically significant.
Cheverud and Buikstra
model, Cheverud and Buikstra corrected for age and sex related variation by creating 7 age groups and used the sex-specific mean measurements of these age groups to standardize their metric measurements. Standard error of the heritability estimates are only given individually for the nonmetric traits and range from 0.280 to 0.516 and are overall very large. For the metric traits, Cheverud and Buikstra (1982) report the standard error of Fisher’s
z-transformations of correlation between mother and offspring to be 0.0913, meaning that any heritability estimate larger than 0.300 is statistically significantly different from 0 at an alpha level of 0.05 (Cheverud, 1982). Interestingly, the heritability estimates Os nasalia (-0.224), PMZI (-0.040), lateral pterygoid bridge-medial aspect (1.080), and position of the occipital foramen (1.120) all fall outside the typical range of heritability estimates from 0 to 1. The heritability estimates of their 1982 study are presented in Tables 6.1 and 6.2.
Table 6.1 Cheverud and Buikstra’s Nonmetric Traits and their Heritability Estimates
Trait h2 SE
Os Nasalia -0.224 0.461
Frontal-nasal contact 0.706 0.327
Supraorbital notch 0.668 0.378
Accessory supraorbital structures 0.439 0.436
Position of zygomatico-frontal foramen 0.35 0.328
Number of zygomatico-frontal foramen 0.569 0.475
Number of infra orbital-foramina 0.343 0.28
Number of zygomatico-facial foramina 0.187 0.516
Divided hypoglossal canal 0.772 0.407
Lateral pterygoid bridge-medial aspect 1.08 0.357
Position of occipital foramen 1.12 0.379
Number of occipital foramina 0.223 0.418
Infraorbital suture 0.484 0.384
Table 6.2 Cheverud and Buikstra’s Metric Traits1 and their Heritability Estimates
1Does not include arc measurements or mandibular measurements as those were not replicated in this study.
Cheverud and Buikstra selected their 56 metric measurements “to adequately represent the size and shape of individual cranial bones” in order to investigate homology, “unlike traditional craniometrics” (Cheverud and Buikstra, 1982). However, there is no assessment of the reliability or repeatability of these measurements. Table 5.11 contains the technical error of measurement (TEM) and the coefficient of reliability (R) (Lewis, 1999) for both the standard homologous metric measurements as well as Cheverud and Buikstra’s measurements collected for this study. Overall, Cheverud and Buikstra’s measurements had a much lower coefficient of reliability. All measurements were taken by the author of this thesis and all protocols for taking these measurements were learned during the same summer, implying that the author of this thesis was not more familiar with one set of protocols than
Trait h2 Trait h2 Trait h2
BRPTC 0.162 JPBA 0.444 MMFC 0.105
BRNAC 0.360 BWBW 0.096 FCIC 0.766
PTPTC 0.558 JPJP 0.246 ICIS 0.080
MFFM 0.548 MFMF 0.376 FCPP 0.228
PTFM 0.414 MFIN 0.278 FMZS 0.478
BRLDC 0.360 ACIS 0.266 TMZI 0.866
LDASC 0.340 NMAC 0.099 FMTM 0.302
ASPTC 0.051 ESES 0.262 FMZI 0.326
BRASC 0.234 ISPM 0.454 THEM 0.510
LDPTC 0.328 NMPM 0.058 LTS 0.248
LDBAC 0.508 PMPX 0.090 ASTS 0.362
VSBA 0.462 PPLF 0.592 PMZI -0.040
ASJP 0.222 NH 0.294 ZIZS 0.172
another at the time of data collection. The discrepancy between the R values of the standard measurements to those of Cheverud and Buikstra’s (1982) measurements suggests that the measurements created by Cheverud and Buikstra, whether they provide a more accurate representation of cranial shape and size or not, are less reliable than the standard
measurements.
Trends in the Number of Heritability Estimates by Region on the Cranium
The results of this study found there to be an increased number of statistically significant heritability estimates concentrated in the craniofacial region, and particularly the naso-maxillary region. These patterns are consistent with the current literature for human cranial variation (Ross et al., 2008; Ross, 2004; Ross et al., 2004). Similarly, the lack of variability in the basicranium was to be expected as the basicranium is responsible for both supporting the rest of the cranium, as well as protecting the nerves and blood vessels that are connected to the brain. In fact, both foramen magnum length (FOL) and foramen magnum breadth (FOB) were found to have high heritability estimates.
The Genetic Underpinnings of Cranial Phenotypic Variation in Humans
One of the goals of this study was to make its findings more readily comparable to those of other studies by collecting standard data sets, specifically those used for data
study of cranial variation is the understanding that the inheritance and expression of these phenotypic traits is complex. Unlike traits with simple Mendelian inheritance through single genes, such as ABO blood type, craniometric traits are continuous and have multifactorial inheritance (Kohn, 1991). They are polygenic, meaning they are influenced by many genes. Additionally, phenotype as it is observed in an individual is a product of both genotype and environmental factors and the effect of each component on phenotypic expression is variable.
overall that global craniometric variation is primarily driven by genetic drift and balanced by gene flow, that does not mean the same is true of every single craniometric trait specifically.
Another avenue of research into the heritability of cranial traits utilizes the
differential timing of growth and development of certain regions of the cranium, presuming that regions and features that complete growth earlier will be less affected by environmental factors. Kohn (1991) compared several studies and found no significant difference between neurocranial and craniofacial traits. However, this thesis found both the craniofacial and basicranial regions had high heritability estimates. These findings were consistent with the correlation between basicranium and the development of the craniofacial region suggested in the literature (Basir and Rosas, 2006; Hallgrimsson et al., 2007).
CONCLUSION
Maximum-likelihood variance components analysis of data collected from the sample population of cotton-top tamarins yielded a greater proportion of statistically significant heritability estimates than nonmetric traits. In their conclusion, Cheverud and Buikstra (1982) stated that in order to test the generality of their findings that nonmetric traits have overall higher heritability than metric traits, it would be necessary to further test the
heritability of these traits in other populations. The results of this thesis show that nonmetric traits do not have overall higher heritability than metric traits in the ORAU population of cotton-top tamarins. These results contradict the broader findings of Cheverud and Buikstra (1982). This thesis found that overall there were more craniometric traits with heritability estimates statistically significantly different from zero than nonmetric traits, which is more consistent with the literature (Carpenter, 1976; Corruccini, 1974; Rightmire, 1972;
Ossenberg, 1969, 1976; Carson, 2006a; Carson, 2006b). Patterns of significant heritability estimates in regions of the cranium derived from the results of this study is also consistent with expectations with regards to the large proportion of significant measurements
concentrated in the naso-maxillary area of the craniofacial region.
the number of infraorbital foramina as continuous data and the compression of other trait descriptions to “present” or “absent”, as Carson (2006a) suggested that recording traits as multi-level may actually decrease their heritability estimates in some cases. However, collecting data in this fashion for this thesis yielded few nonmetric traits with heritability estimates statistically significantly different from zero.
Suggestions for Further Research