Analysis of Energy-Efficient Ring Cross-Layer
Optimization Algorithm on WSN over DTN
Pavithra1, Dr.C.Viswanathan M.E, Ph.D.,2
P.G. Student, Department of ECE, GRT Institute of Engineering and Technology, Tiruvallur, Tamil Nadu, India1
Professor, Department of ECE, GRT Institute of Engineering and Technology, Tiruvallur, Tamil Nadu, India2,3
ABSTRACT: In wireless sensor networks, cross-layer optimization is a hot topic. In order to balance energy
consumption a clustering based cross-layer optimization model is established in this paper. LEACH protocol uses certain approximations and assumptions. In this paper, we tried to find what happens if these basic assumptions and approximations of LEACH are not considered. In this model, the network layer could get the related information from physical layer and the data link layer to effectively route packets. Based on the cross-layer optimization model, an energy-efficient ring cross-layer optimization algorithm is proposed and a new routing algorithm called Leach-Cross-Layer Optimization (CLO) is also proposed for a ring monitoring domain. This Leach-CLO routing algorithm is based on the typical Leach algorithm. In the test of energy consumption in two scenarios, WSN and LEACH-WSNoverDTN have no significant differences but when we check the lifetime of node which depends on energy consumption, LEACH-WSNoverDTN has early death node
KEYWORDS: LEACH, WSN over DTN, CLO Routing, Physical Layer
I. INTRODUCTION
A wireless sensor network (WSN) is a wireless network consisting of spatially distributed autonomous devices using sensors to monitor physical or environmental conditions. A WSN system incorporates a gateway that provides wireless connectivity back to the wired world and distributed nodes. The wireless protocol you select depends on your application requirements. Some of the available standards include 2.4 GHz radios based on either IEEE 802.15.4 or IEEE 802.11 (Wi-Fi) standards or proprietary radios, which are usually 900 MHz.
Engineers have created WSN applications for areas including health care, utilities, and remote monitoring. In health care, wireless devices make less invasive patient monitoring and health care possible. For utilities such as the electricity grid, streetlights, and water municipals, wireless sensors offer a lower-cost method for collecting system health data to reduce energy usage and better manage resources. Remote monitoring covers a wide range of applications where wireless systems can complement wired systems by reducing wiring costs and allowing new types of measurement applications.
II. RELATEDWORK
1) Energy Efficient Wireless Sensor Networks Using Linear-Programming Optimization of the
Communication Schedule
VladTabus, Dmitri Moltchanov, YevgeniKoucheryavy, IoanTabus, and JaakkoAstola
The new method described in this paper designs a single near-optimal Hamiltonian circuit, used to obtain multiple chains having only the terminal nodes different at different converge-casts. The optimal scheduling of the communication between the network and base station in order to maximize network lifetime, given the chosen minimum length circuit, becomes a simple linear programming problem which needs to be solved onlyonce, at the initialization stage
2) An Integer Linear Formulation Scheme For Data Collection in Wireless Sensor Network Using Mobile
Element(ME)
we divide the whole network into grids. Certain grids are critical (e.g., during a terror strike) in the sense that (a) it may not be possible for mobile elements to enter those grids, and (b) the sensor nodes in those grids are required to sense data at a higher rate due to the critically in the their surrounding environment. A subset of sensor nodes are designated as cache points such that each sensor node must deliver its sensed data to one of the cache points.
3) DACC: Dynamic Agile Congestion Control Scheme for Effective Multiple Traffic Wireless Sensor
Networks
M. Joseph Auxilius Jude and V.C. Dinesh
Toward this goal, we propose a first of a kind continuous QoE prediction engine. Prediction is based on a nonlinear autoregressive model with exogenous outputs. Our QoE prediction model is driven by three QoE-aware inputs: An objective measure of perceptual video quality, rebuffering-QoE-aware information, and a QoE memory descriptor that accounts for recency. We evaluate our method on a recent QoE dataset containing continuous time subjective scores.
Problem Statement
Many literatures have been published in order toimprove energy efficiency using different techniques butstill according to LEACH’s deficiencies level of energyremains unbalanced. The Fundamental function of a sensor network is to sense and forward packets to the desired destination or endsystem, without losses. The end system could be a base station positioned in a remote environment. In the event ofenergy constraint in a sensor network, routing protocol is then used to tract and identify the path to the destination.The established path then enables the nodes in sending and receiving data. Where the sensed data is only available toparticular segments that are unable to forward it to the desired destination due to energy constraint or depletion in thesensor nodes in those segments.
Objective
The main objective of this protocol is to establish the cost field through routing, and transmit the data through theminimum-cost path. The energy consumption, the battery life and hop count all follow the minimum cost path criteria.
III.PROPOSEDALGORITHM
Leach Based Hierarchical Routing Protocol for Monitoring
For saving the energy it is better to send the data to BS by forming the clusters in place of transmitting the data directly. LEACH is the oldest and one of the popular approach used for clustering WSNs. LEACH algorithm uses two phase in each round for clusters creation and data transfer. First phase is setup and second is steady state phase. In first phase clusters are being formed and in second data are being transferred. Algorithm works in such a way that various sensors of different categories like ordinary sensors (having good sensing capability and less communication range) and gateway sensor (having less sensing capability, strong communication range and more battery backup) are being placed under ground, nearby area of pipe line and along the pipeline. The entire sensor placed under ground will forward the sensed data directly to the sensors placed along the pipeline. Sender sensor will transmit the data to the sensor which is at the shortest distance and also in the communication range. Low-energy adaptive clustering hierarchy ("LEACH") is a TDMA-based MAC protocol which is integrated with clustering and a simple routing protocol in wireless sensor networks (WSNs). The goal of LEACH is to lower the energy consumption required to create and maintain clusters in order to improve the life time of a wireless sensor network.
PROTOCOL
LEACH is a hierarchical protocol in which most nodes transmit to cluster heads, and the cluster heads aggregate and compress the data and forward it to the base station (sink). Each node uses a stochastic algorithm at each round to determine whether it will become a cluster head in this round. LEACH assumes that each node has a radio powerful enough to directly reach the base station or the nearest cluster head, but that using this radio at full power all the time would waste energy.Nodes that have been cluster heads cannot become cluster heads again for P rounds, where P is the desired percentage of cluster heads. Thereafter, each node has a 1/P probability of becoming a cluster head again. At the end of each round, each node that is not a cluster head selects the closest cluster head and joins that cluster. The cluster head then creates a schedule for each node in its cluster to transmit its data.All nodes that are not cluster heads only communicate with the cluster head in a TDMA fashion, according to the schedule created by the cluster head. They do so using the minimum energy needed to reach the cluster head, and only need to keep their radios on during their time slot.
The specific optimization mechanism of the model is as follows:
The network layer can design the gradient of the monitoring range through the topological information provided by the physical layer, calculate the distance between each gradient, and divide the nodes into ranks in the monitoring range.
The network layer selects the nodes with higher residual energy and good distribution position as the cluster head nodes according to the residual energy information and the node density information provided by the physical layer.
The network layer makes the nodes reasonably clustered according to the signal intensity between the nodes provided by the link layer.
The link layer can reasonably use the link layer protocol according to the node clustering structure information of the network layer. The inter-cluster communication of the nodes uses the link layer protocol based on competition to improve the channel efficiency. The intra-cluster communication of the nodes uses the link layer protocol based on scheduling to reduce competition within the cluster.
In routing selection, the network layer uses the residual energy information provided by the physical layer and the link quality information provided by the link layer to make the routing choice and select the best path. During routing, if the member node is used as the relay node, when the link layer is allocated the time-slot by
The routing information can only be forwarded when the sensor node obtains the time-slot or acquired the right to use the channel through competition.
Before forwarding data, the network layer will inform the physical layer of the next hop node’s ID through routing, the physical layer calculates the optimal transmission power through the power-control technology and transmits the data using the minimum transmission power on the basis of ensuring the connectivity of the entire network.
The link layer uses the error-control technology, which refers to the channel state and link quality to ensure the correctness of transmission.
Physical Layer Optimization
MAC layer is mainly responsible for the accurate reception of data, the system can achieve a higher gain in throughput and power saving by using physical layer information to adjust the MAC layer’s control mechanism, the network layer uses the information such as channel state information (CSI), residual energy, geographical location, etc., and the transmission power of the physical layer as the basis for its routing, the network layer can transmit different rates and different priorities of data on different channels, according to the channel status information using the routing function to select the best path.Energy consumption in wireless sensor networks mainly involves sending and receiving channel listener data.
Implementation
If nodes in the network which are at some distance from the base station, the easiestand the simplest way of transmitting the sensed data to the base station is to transmit itdirectly, which may lead to quicker depletion of energy in all the nodes. The nodes at a largedistance away from the base station are depleted quicker than the nodes which are closer tothe base station as they need some extra energy to reach the farthest base station. Anotherapproach where energy is consumed in low amounts is by forming cluster heads and clustermembers using the sensor nodes in the network. Cluster members perform the sensing andcomputing the data (Data Fusion) and the cluster heads transmit the fused data to the basestation. All the nodes in the network take their chance to act as cluster heads to send the fuseddata to the base station; again the farthest cluster head needs some extra energy to send thedata to the base station.
The proposed algorithm is to form a chain using the nodes in the network to transmitdata to the base station; it has no location awareness of the sensor nodes in the network andlooks only for the closest neighbour that it can reach. Discovering a new route is difficult if anode fails, as it has a fixed path every time before it starts a new route towards the sink fortransmission. Though its approach in conserving energy is better, it lacks in maintaining focuson quality-of-service factors. For instance, it cannot resist uneven traffic distribution for allthose nodes which are not in the single-hop range, it has to make a multi-single-hop structure foradding such nodes
IV.RESULTSANDDISCUSSIONS
A Leach-CLO (Leach Cross-Layer Optimization) algorithm. Leach-CLO works in rounds; thereare six stages in the main work of each round: the stage of network initialization, the stage of choosing cluster head, the stage of clustering, the stage of inter-cluster communication, the stage of intra-cluster communication, the stage of power control. Specific steps are as follows.
1. Network initialization 2. Cluster heads election
Clustering
Cluster head node sending the cluster broadcast, member nodes receiving the cluster information, join the cluster head node to complete the establishment of the cluster.
Intra-cluster communication
The members of the cluster need to send the monitored data and the data forwarded by the agent to the cluster head node, and then the data collected by the cluster head node will be data fusion processing, remove the redundant data.
Inter-cluster communication
Figure 4.1 Node Construction and optimized path Calculation
The above figure shows the Creation of the Wireless Sensor Network.The cluster head node with better link quality should be selected to reduce the data collision and signal interference, and reduce the probability of data retransmission. At the same time, the nodes with higher residual energy are selected as the next hop of the routing to better consume the energy of the balanced network
Figure 4.2 Energy maintained by Each Nodes
0 10 20 30 40 50 60 70 80 90 100
0 20 40 60 80 100 120 140 160 180 200
Wireless Sensor Network
(m)
(m
)
0 10 20 30 40 50 60 70 80 90 100
99 99.2 99.4 99.6 99.8 100 100.2 100.4 100.6 100.8 101
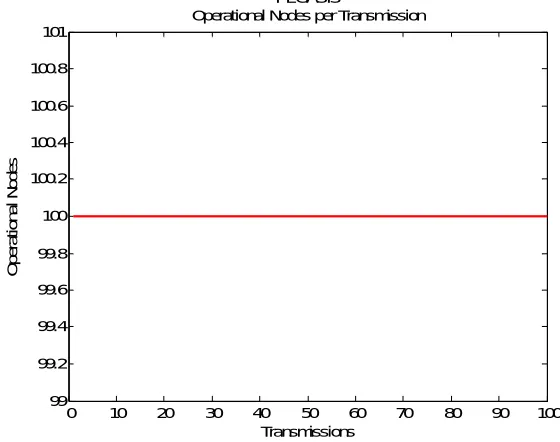
PEGASIS
Operational Nodes per Transmission
Transmissions
O
p
e
ra
ti
o
n
a
l
N
o
d
e
The above figure shows no of transmission per Operational Nodes
Figure 4.3 MinimumDistance Between Nodes
The above figure shows the minimum number of distance between the sink node and communicating nodes 0 50 100 150 200 250 300 350 400
674 676 678
angle in degrees
d is ta n c e
variation in distance with angle
0 50 100 150 200 250 300 350 400 0
2 4
angle in degrees
d is ta n c e
variation in distance with angle
0 50 100 150 200 250 300 350 400 25.94
25.96 25.98
angle in degrees
c o s t fu n c ti o n
cost function with respect to change in angle
cost function
minimum cost function
0 5 10 15 20 25 30 35 40 45
-100 0 100 200 300 400 500 600 700
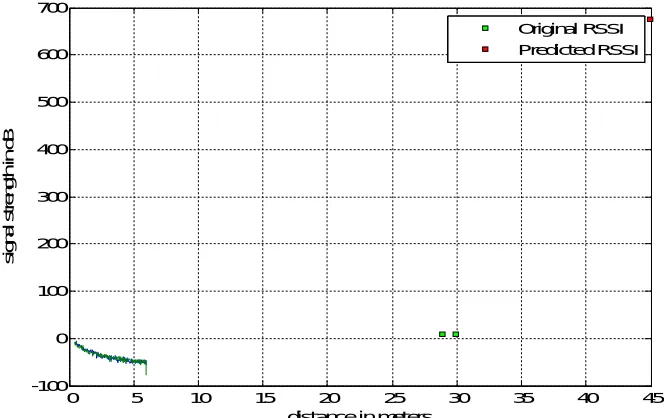
distance in meters
The above figure shows the minimum Received signal strength intensity of distance of Original and Predicted RSSI
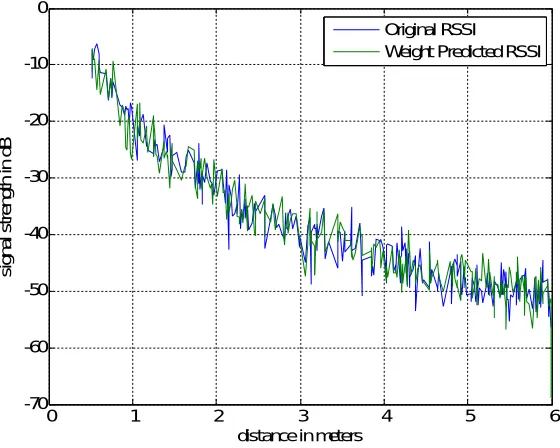
Figure 4.5 Extensions of Figure 5.4
The above figure shows the minimum Received signal strength intensity of distance of Original and DTN Weighted Predicted RSSI
V. CONCLUSIONANDFUTUREWORK
The LWSN investigated in this paper has a hybrid structure, where a limited number of backbone nodes are used to transfer information between sensor nodes and the base station. Although considerable research efforts have been performed to model and analyze conventional LWSNs without backbone nodes, LWSNs with the hybrid structure have notbeen studied systematically. This paper proposes a flexible multistate system model for the hybrid LWSNs, and an MDD-based approach to evaluate the perform ability of the LWSN at each particular performance level. As demonstrated through a detailed model complexity analysis, the suggest MDD method is more efficient than the traditional exhaustive enumeration methods. The computed perform ability measures can be important to the LWSN design. Particularly, based on the analysis data, designers can derive optimal strategies on backbone node placement and make cost-effective decisions on the number of configured backbone nodes.
REFERENCES
[1] C. de MoraisCordeiro and D. P. Agrawal, Ad Hoc and Sensor Networks: Theory and Applications, 2nd ed. Hackensack, NJ, USA: World Sci., 2011.
[2] Y. Liu, M. J. Zuo, Y.-F.Li, and H.-Z. Huang, “Dynamic reliability assessment for multi-state systems utilizing system-level inspection data,” IEEE Trans. Rel., vol. 64, no. 4, pp. 1287–1299, Dec. 2015.
[3] J. Yan, M. Zhou, and Z. Ding, “Recent advances in energy-efficient routing protocols for wireless sensor networks: A review,” IEEE Access, vol. 4, pp. 5673–5686, 2016.
[4] W. Contreras and S. Ziavras, “Low-cost, efficient output-only infrastructure damage detection with wireless sensor networks,” IEEE Trans. Syst.,Man, Cybern., Syst., to be published, doi: 10.1109/TSMC.2017.2720120.
0 1 2 3 4 5 6
-70 -60 -50 -40 -30 -20 -10 0
distance in meters
s
ig
n
a
l
s
tr
e
n
g
th
i
n
d
B
[5] I. Jawhar, N. Mohamed, and D. P. Agrawal, “Linear wireless sensor networks:Classification and applications,” J. Netw. Comput. Appl., vol. 34,no. 5, pp. 1671–1682, 2011.
[6] Z. Wang, X. Zha, and X. Qian, “The application and issues of linear wireless sensor networks,” in Proc. Int. Conf. Syst. Sci. Eng. Design Manuf. Informatization, Guiyang, China, Oct. 2011, pp. 9–12.
[7] K. Chebrolu, B. Raman, N. Mishra, P. K. Valiveti, and R. Kumar, “BriMon: A sensor network system for railway bridge monitoring,” in Proc. 6th ACM Int. Conf. Mobile Syst. Appl. Services (MobiSys), Breckenridge, CO, USA, Jun. 2008.
[8] S. Ali et al., “SimpliMote: A wireless sensor network monitoringplatform for oil and gas pipelines,” IEEE Syst. J., vol. 12, no. 1, pp. 778–789, Mar. 2018, doi: 10.1109/JSYST.2016.2597171.
[9] C. Xia, W. Liu, and Q. Deng, “Cost minimization of wireless sensor networks with unlimited-lifetime energy for monitoring oil pipelines,” IEEE/CAA J. AutomaticaSinica, vol. 2, no. 3, pp. 290–295, Jul. 2015.
[10] S. Yoon, W. Ye, J. Heidemann, B. Littlefield, and C. Shahabi, “SWATS: Wireless sensor networks for steamflood and waterflood pipeline monitoring,” IEEE Netw., vol. 25, no. 1, pp. 50–56, Jan./Feb. 2011.
[11] F. Stajano et al., “Smart bridges, smart tunnels: Transforming wireless sensor networks from research prototypes into robust engineering infrastructure,” Ad Hoc Netw., vol. 8, no. 8, pp. 872–888, 2010.
[12] I. B. Gertsbakh and Y. Shpungin, Models of Network Reliability: Analysis, Combinatorics, and Monte–Carlo. Boca Raton, FL, USA: CRC Press, 2010.
[13] N. Mohamed, J. Al-Jaroodi, I. Jawhar, and A. Eid, “Reliability analysis of linear wireless sensor networks,” in Proc. IEEE 12th Int. Symp. Netw.Comput. Appl., Cambridge, MA, USA, Aug. 2013, pp. 11–16.
[14] I. Jawhar and N. Mohamed, “A hierarchical and topological classification of linear sensor networks,” in Proc. Wireless Telecommun. Symp. (WTS), 2009, pp. 1–8.
[15] P. Zhu, J. Han, Y. Guo, and F. Lombardi, “Reliability and criticality analysis of communication networks by stochastic computation,” IEEE Netw., vol. 30, no. 6, pp. 70–76, Nov./Dec. 2016.