INVESTIGATION
The Nearly Neutral and Selection Theories
of Molecular Evolution Under the Fisher
Geometrical Framework: Substitution Rate,
Population Size, and Complexity
Pablo Razeto-Barry,*,†,‡,1Javier Díaz,* and Rodrigo A. Vásquez*,† *Instituto de Filosofía y Ciencias de la Complejidad, Santiago, Chile 7780192,†Instituto de Ecología y Biodiversidad, Departamento de Ciencias Ecológicas, Facultad de Ciencias, Universidad de Chile, Santiago, Chile 7800024, and‡Universidad Diego Portales, Vicerrectoría Académica, Santiago, Chile 8370179
ABSTRACTThe general theories of molecular evolution depend on relatively arbitrary assumptions about the relative distribution and rate of advantageous, deleterious, neutral, and nearly neutral mutations. The Fisher geometrical model (FGM) has been used to make distributions of mutations biologically interpretable. We explored an FGM-based molecular model to represent molecular evolutionary processes typically studied by nearly neutral and selection models, but in which distributions and relative rates of mutations with different selection coefficients are a consequence of biologically interpretable parameters, such as the average size of the phenotypic effect of mutations and the number of traits (complexity) of organisms. A variant of the FGM-based model that we called the static regime (SR) represents evolution as a nearly neutral process in which substitution rates are determined by a dynamic substitution process in which the population’s phenotype remains around a suboptimum equilibrium fitness produced by a balance between slightly deleterious and slightly advantageous compensatory substitutions. As in previous nearly neutral models, the SR predicts a negative relationship between molecular evolutionary rate and population size; however, SR does not have the unrealistic properties of previous nearly neutral models such as the narrow window of selection strengths in which they work. In addition, the SR suggests that compensatory mutations cannot explain the high rate offixations driven by positive selection currently found in DNA sequences, contrary to what has been previously suggested. We also developed a generalization of SR in which the optimum phenotype can change stochastically due to environmental or physiological shifts, which we called the variable regime (VR). VR models evolution as an interplay between adaptive processes and nearly neutral steady-state processes. When strong environmental fluctuations are incor-porated, the process becomes a selection model in which evolutionary rate does not depend on population size, but is critically dependent on the complexity of organisms and mutation size. For SR as well as VR we found that key parameters of molecular evolution are linked by biological factors, and we showed that they cannot befixed independently by arbitrary criteria, as has usually been assumed in previous molecular evolutionary models.
T
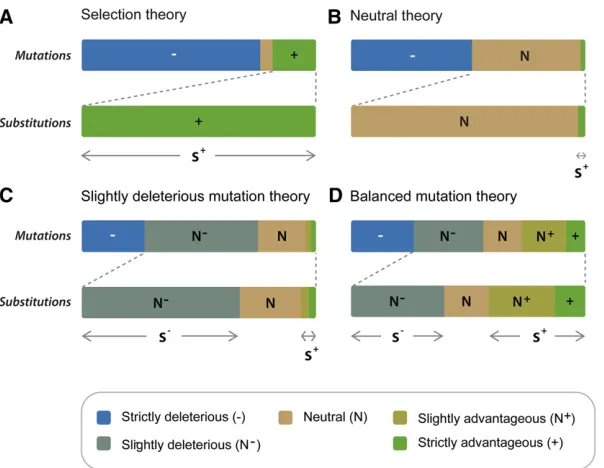
HE nearly neutral theory of molecular evolution (Ohta and Kimura 1971; Ohta 1972, 1973, 1977, 1992, 1996), as is generally understood, affirms that the vast majority of amino acid substitutions are slightly deleterious; hence, it has been called the slightly deleterious mutation theory (Figure 1C) (Ohta and Kimura 1971; Ohta 1972, 1973, 1977, 1987, 1996; Kimura 1983; Gillespie 1995, 2004;Kreitman 1996). In the original exponential “shift” model of Ohta (1977) selection coefficients are chosen at random from an exponential probability distribution, and the popu-lation meanfitness shifts back when a mutation isfixed (see also Ohta and Gillespie 1996). This model was modified by Kimura (1979), who proposed the gamma shift model, to overcome Ohta’s previous assumptions that imply a rate of substitution that is too low when population size is in-creased above moderate values (see also Nielsen and Yang 2003). Later, Ohta and Tachida (1990) and Tachida (1991) developed another kind of nearly neutral model to relax some criticized assumptions (see below), but those models Copyright © 2012 by the Genetics Society of America
doi: 10.1534/genetics.112.138628
Manuscript received January 13, 2012; accepted for publication February 28, 2012
1Corresponding author: Instituto de Filosofia y Ciencias de la Complejidad, Los Alerces
produced a very different prediction than that of slightly deleterious mutation models. In fact, Gillespie (1994, 1995) uncovered that in these later models, known as the house-of-cards or “fixed”models, only half of the substitu-tions are deleterious and the other half are advantageous (see also Tachida 1996, 2000). Thus, these kinds of nearly neutral models may be subsumed in a different category that we will call the balanced mutation theory (Figure 1D). Nevertheless, these later models were strongly criti-cized because the rate of substitution becomes 0 starting from a small effective population size (specifically, substitu-tion stops when 2Nss.4, wheressis the standard devia-tion of the selecdevia-tion coefficients, and N is the effective population size); that is, except for a narrow window of 2Nssthese models predict even lower rates of substitution than those generated by the original exponential shift model (Gillespie 1994, 1995, 1999; Ohta and Gillespie 1996). Thus the nearly neutral theory continued to emphasize the substitution of slightly deleterious mutations (Ohta 1992, 1996, 2007; Gillespie 1995, 2004; Eyre-Walker et al. 2002; Sella and Hirsh 2005; Gu 2007a,b; Harris 2010). On the other hand, selection models (Figure 1A), in which natural selection rather than genetic drift is the main force causing substitutions, commonly depend on fluctuating en-vironments that are required to continue evolution and may explain some of the empirical phenomena found in molec-ular data (Ohta and Gillespie 1996). Nevertheless, it has been recognized that there is a lack of a general model of molecular evolution that can account for all major molecular phenomena (Ohta and Gillespie 1996; Kreitman 1996; Niel-sen and Yang 2003). Here we propose that a reinterpretation of recent developments of molecular evolutionary models based on Fisher’s (1930) geometrical framework (Gu
2007a,b; Suet al. 2010; Razeto-Barryet al. 2011; Razeto-Barry and Maldonado 2011) may offer an alternative mod-eling framework that gives a better account of molecular evolutionary phenomena than previous models.
Theoretical studies of molecular evolution assume prede-fined distributions of selection coefficients of mutants (e.g., Ohta 1973, 1977; Kimura 1979; Ohta and Tachida 1990; Gillespie 1993, 1994). Thus the rate and proportion of dif-ferent types of mutations are dependent only upon the pop-ulation size and some parameters of the distribution of the selection coefficients (typicallysandss, the mean and the standard deviation of selection coefficients, respectively). However, in real processes the distribution of mutant selec-tion coefficients is determined by the operation of the evo-lutionary dynamics and therefore it should not be assumed a priori(Sella and Hirsh 2005). Moreover, choosing a spec-ified distribution is somewhatad hocbecause it lacks a clear-cut biological interpretation (Gu 2007b).
The Fisher geometrical model (FGM) has been used to make distributions of mutations biologically interpretable (Martin and Lenormand 2006a,b, 2008; Gu 2007a,b). Given a distribution of the size of phenotypic effects of mutations (r), in the FGM the distribution of mutant selection coeffi -cients is determined by geometrical relations between the number of traits of organisms and the distance to an opti-mum trait combination. In turn, this distance depends on the phenotypic traits of the population, the environmental changes (Orr 1998, 1999, 2000), and thefixed drift load of the population (Hartl and Taubes 1998; Poon and Otto 2000; Sella and Hirsh 2005; Tenaillon et al. 2007; Sella 2009), which allows exploration of relationships between parameters that may be linked to biologically interpretable factors and thus should not be independently specified by Figure 1 (A) Darwin’s (and neo-Darwinian selection) theory postulated the existence of deleterious (2) and advantageous (+) changes, but Darwin recognized the existence of neutral changes (Bernardi 2007). Deleteri-ous mutations are immediately rejected by negative (or purifying) selection and neutral mutations are neglected. All the substitutions have a positive selection coefficient s.0. (B) The neutral theory (Kimura 1968, 1983) pos-tulated the existence of an important fraction of neutral mutations (N) and a very small fraction of advantageous mutations. Neutral mutations arefixed by random drift and constitute the majority of substitutions. A very small minority of substitutions have s . 0. (C) The slightly deleterious mutation theory (Ohta 1972, 1992; Kimura 1979) is a nearly neutral theory that included mutations between neutral and advantageous (N+), as
well as between neutral and deleterious (N2). These nearly neutral mutations arefixed by random drift too, and constitute, with the neutral, the majority of substi-tutions. The majority of substitutions haves,0. (D) The balanced mutation theory also incorporates slightly del-eterious mutations (N2), but also postulates an impor-tant fraction of advantageous (compensatory) mutations
arbitrary criteria. For example, Gu (2007a,b) used the FGM to model the slightly deleterious mutation theory under the shift model framework, finding a natural explanation for Kimura’s gamma function of selection coefficients, which would be related to the numbernof phenotypic dimensions influenced by the mutations of a gene (gene pleiotropy). Thus Gu found that the gamma distribution case used by Kimura corresponds ton¼1 phenotypic dimensions and the exponential distribution of Ohta corresponds ton¼2 (Gu 2007a).
Gu’s work also allows the study of the relationship be-tween molecular evolution and population size in the FGM. However, the assumptions of Gu’s model in the FGM inherit the problems of the original shift models, which were strongly criticized because of their biologically unreasonable assumptions (Tachida 1991; Ohta 1992; Gillespie 1995; Ohta and Gillespie 1996; Razeto-Barry et al.2011). For in-stance, shift models require that all mutations be deleteri-ous. Thus, when a deleterious mutation gets fixed, all subsequent mutations must be lessfit than thefixed muta-tion. Shift models allow simplifying assumptions that were used in Gu’s work to make the problem analytically tracta-ble. However, more realistic assumptions can be approached with computer simulations (as in the house-of-cards model). Here we relaxed the assumptions of Gu’s model in the FGM and developed a model that supports a balanced mutation theory of molecular evolution, which we call the static re-gime (SR). The steady state in the FGM has been under-stood as a nearly neutral evolutionary process (Hartl and Taubes 1996; Sella and Hirsh 2005; Sella 2009) and it is in some aspects similar to the house-of-cards nearly neutral model (Ohta and Tachida 1990; Tachida 1991, 1996). We explored the possible interpretations and evolutionary con-sequences of this model through simulations in the Fisher geometrical framework both in a balanced steady state (the SR) and in an interplay between adaptive processes and balanced steady states in a randomly fluctuating environ-ment, henceforth the variable regime (VR). We found that when molecular evolution, both in a fluctuating environ-ment (VR) and in the steady state (SR), is biologically inter-preted in the FGM it does not need the arbitrary independent specification of some evolutionarily relevant parameters because they are locked in relationships that depend upon biologically interpretable factors. We found other differences with previous nearly neutral models that overcome unrealistic properties of these previous models, supporting the SR and VR as potentially good models for representing general processes of molecular evolution.
The Model
Model assumptions
The FGM represents a population as a point in ann -dimen-sional space of states, in which each axis represents a differ-ent organismal phenotypic trait and the origin represdiffer-ents
the optimum state of a population given a specific environ-mental condition (Orr 1998, 2000; Welch and Waxman 2003). Mutations are represented as random vectors iso-tropically distributed in this hyperspace (see below). Vectors that approach the origin are advantageous and those point-ing away from the optimum are deleterious; the selection coefficients of the vectors are determined according to a Gaussian fitness function centered on the optimum (which, without loss of generality, takes a fitness value of 1). Environmentalfluctuations are represented as optimum shifts (Barton 2001; Gu 2007b; Razeto-Barryet al.2011). In contrast to the nearly neutral shift models (see also Gu 2007a,b), in our model when a mutation isfixed the phe-notype of individuals in the population is modified, acquir-ing a new fitness value; thus subsequent mutations start from the new phenotypic state (Razeto-Barryet al.2011).
Given that a previously fixed mutation in a population changes the phenotypic starting point of each new mutation, the probability distributions of new mutations are shifting permanently, wandering in the Cartesian n-dimensional space. Because of their difficult analytical tractability, models in which population fitness fluctuates as a result of mutant fixations are analyzed by computer simulations (Ohta and Tachida 1990; Tachida 1991, 1996, 2000; Gillespie 1995; Razeto-Barryet al.2011). We simulated asexual populations under the assumption of weak mutation (Nu,1, whereuis the genomic mutation rate); thus the evolutionary process is depicted as a succession offixations and neglects the effects of polymorphisms. We followed the methods of Razeto-Barry et al. (2011) to model molecular evolutionary processes in the framework of the FGM but with the difference that, in contrast to previous models (Gu 2007a,b; Su et al. 2010; Razeto-Barry et al. 2011; Razeto-Barry and Maldonado 2011), the number of dimensions n is not interpreted as the number of orthogonal traits affected by mutations in a gene, but rather as the number of orthogonal traits affected by mutations in the entire organismal genome.
The usual FGM-based modeling of evolutionary processes is the analysis of a bout of adaptation after a sudden, recent environmental shift of the optimum (Orr 1998, 1999, 2000; Welch and Waxman 2003), but the fate of an adaptive bout is to reach afitness plateau (Silanderet al.2007), which is characterized by a balanced steady state in which molecular evolution does not stop (Hartl and Taubes 1996). This steady state has been studied while maintaining afixed op-timum (Hartl and Taubes 1998; Poon and Otto 2000; Sella and Hirsh 2005; Tenaillon et al.2007; Sella 2009). In the VR (distinguished from SR) we modeled temporally fl uctu-ating random optimum shifts; thus the evolutionary process was an alternation between adaptive bouts and balanced steady states that are determined by the variability of the environmental changes. Thus obviously the VR converges to the SR when environmental variability and amplitude tend to zero.
usually measured by the ratio between synonymous and nonsynonymous substitution rates (dN/dS), under the as-sumption that synonymous substitutions are almost neutral. In contrast to Gu (2007a,b) we utilized a top-down ap-proach to isotropic random vector generation (Poon and Otto 2000); that is, we directly specified only the distribu-tion of total mutadistribu-tion length and did not specify the mar-ginal distributions along each axis. Thus a change in the number of dimensions does not affect the total length of the mutation’s effects, which allows us to distinguishing be-tween the effect of dimensionality and the effect of mutation size on the molecular evolutionary rate (see Razeto-Barry et al. 2011). We followed Gu’s bottom-up approach for the random shifts of optimum values, but corrected the ampli-tudes of shifts by requiring that ampliampli-tudes be equal for different numbers of dimensions (see Razeto-Barry et al. 2011). Following Kimura (1983) and Orr (1998), the distri-bution used for mutation magnitudes was uniform.
Simulations
Simulations were performed with Monte Carlo methods by which vectors are generated randomly with a uniform distribution of vector magnitudes (from 0 to r). The total effect of a gene mutation (mutation sizerj¼ jrjj) was
mea-sured as the Euclidean distancer2
j ¼
Pn
i¼1ðzmuti 2zþiÞ
2 , where zmut
i is the value of coordinateiof the mutant,zþi is the value
of the present phenotype (wild type), and i= 1,. . .,n. As-suming for simplicity that effective and census population sizes are equal, these changes are fixed with probability pðN;sÞ ¼12e22s=12e22Ns, whereNis the effective
popula-tion size and s is the selection coefficient of the mutation (Crow and Kimura 1970).
Fitness values follow the Gaussian functionwðzÞ ¼e2z2=2, where z is the distance to the optimum point. Selection coefficients are defined ass¼ ðwmut2wþÞ=wþ, where wmut is thefitness of the mutant andw+is thefitness of the wild
type. We obtained the ratio between substitution rate and mutation rate (k/u) for different conditions, varying popu-lation size (N), complexity (number of dimensions, n), av-erage size of phenotypic effects of mutations (hereafter mutation size,r), and (defined below) amplitude (sa) and variability (t) of optimum shifts.
Random optimum shifts were simulated such that vfðv;lÞ ¼e2llv=v!, wherev andlare the number and the expected number of changes in a time interval, respec-tively. Time intervals between consecutive changes (t) fol-lowed an exponential distribution tfðt;tÞ ¼e2ð1=tÞt, where t ¼ 1/l is the expected time between optimum changes. Assuming a constant mutation rate per gene per individual per generation (u), the expected time between environmental changes is t¼t=uN (Razeto-Barry et al. 2011). To compare processes with different effective popu-lation size in environments with equivalent times between changes, we then sett}N. The amplitudes of environmen-tal changes were obtained byaðz1...;znÞ¼
ffiffiffiffiffiffiffiffiffiffiffiffiffiffiffi z2
1þ...þz2n
p
=pffiffin, wherezi
are the coordinates of the new optimum which were
inde-pendently chosen from a Gaussian distribution centered at the origin of the coordinates, i.e., zifðsaÞ ¼e2z
2
i=2s
2
a,
where sa represents the standard deviation of the ampli-tudes of environmental changes. We set aðz1;. . .;znÞ}1=
ffiffiffi
n p
to guarantee that any relationship between evolutionary rate and dimensionality will be due to the effect of dimen-sionality itself and not because of a correlation between di-mensionality and amplitude of environmental changes (see Razeto-Barryet al.2011).
Strictly advantageous substitutions are defined as sub-stitutions that comply withs.1/N,i.e., advantageous sub-stitutions fixed by positive selection; effectively neutral substitutions are defined as jsj , 1=N, i.e., substitutions fixed mainly by random drift; and strictly deleterious sub-stitutions are defined ass, 21/N,i.e., deleterious substi-tutionsfixed by drift in spite of the strong negative selection against them. When we denote mutations or substitutions withs.0 ands,0 we simply speak of“advantageous”or “deleterious,”respectively.
Results
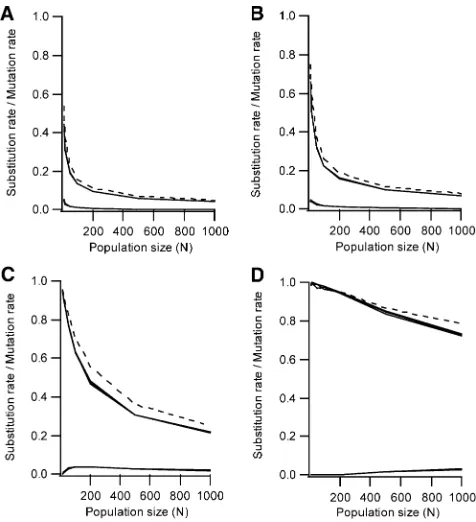
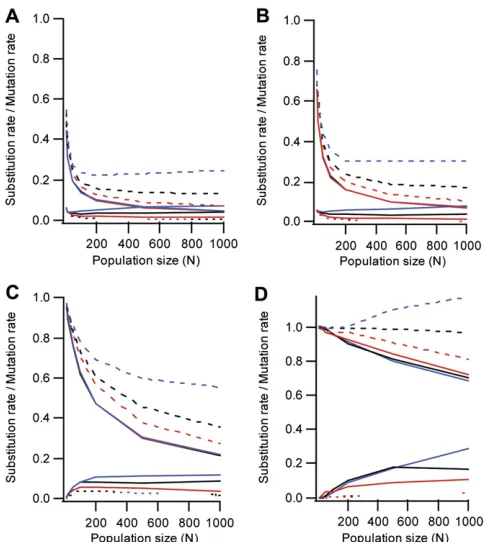
With no environmental variability (the SR), we found a negative relationship between total and effectively neu-tral, evolutionary rate and population size (Figure 5). The decrease is greater for larger mutation sizes (Figure 5). Strictly advantageous and strictly deleterious substitution rates are similar and decrease with increasing population sizes for larger mutation sizes (Figure 5, A and B), have a maximum for intermediate sizes (Figure 5C), and in-creased for small mutation sizes (Figure 5D). With environ-mental variability (the VR), the expected rate of advantageous substitutions (s .0) is greater than that of deleterious substitutions (s , 0) and the relationship be-tween evolutionary rate and population size is more com-plex (Figure 6). For small population sizes, the total evolutionary rate decreases with increase of population size except when mutation size is very small and the number of dimensions is large (Figure 6D). The decrease in total sub-stitution rate reaches a plateau with smaller population sizes when mutation size is greater (Figure 6, A and B). The value of this plateau, in which the total substitution rate remains equal for different population sizes, is larger for lower mu-tation sizes and higher number of dimensions. The strictly advantageous substitution rate increases with population size, and the increase is stronger for smaller mutation size. However, the critical population size where the strictly ad-vantageous rate exceeds the effectively neutral rate is larger for smaller mutation sizes (Figure 6, A and B).
Discussion
The SR showed similarities to the house-of-cards or“fixed” model of molecular evolution (see Ohta and Tachida 1990;
Tachida 1991), in which evolution is an alternating process with half of the substitutions being advantageous and the other half deleterious (Figure 3) (Tachida 1991; Gillespie 1994, 1995; Sella and Hirsh 2005). Most of these advanta-geous mutations would be compensatory, i.e., intragenic or intergenic mutations that restore the fitness loss due to pre-vious deleterious mutations (Poon and Otto 2000). However, the SR model overcomes some problems of the house-of-cards model. It has been claimed that the house-of-house-of-cards model is not a plausible model of molecular evolution be-cause the substitution rate is a rapidly decreasing (typically concave) function of the strength of selection (2Nss), which stops when 2Nss.4 (Tachida 1991; Gillespie 1994, 1995; Ohta and Gillespie 1996). That is, it cannot contain enough mutations that behave effectively as neutral when the popu-lation size is large (Kimura 1979, 1983). By contrast, in the SR the relationship between substitution rate and population size (and thus the strength of selection) is convex (as in the shifting models; see Gillespie 1994, 1995) and evolution does not stop even for 2Nss260 (e.g., in Figure 5Ass0.13, and when N¼ 1000,k/u0.05). Tachida (1996) showed that in the house-of-cards model substitutions continue to occur even when 2Nss¼20 if the distribution of the selection coefficients of mutations is uniform, making this model more plausible. However, the assumption of a uniform distribution is not realistic according to the current data that show lep-tokurtic selection coefficient distributions (e.g., Keightley 1994; Lynchet al.1999; Orr 2010), as in our SR. Therefore, the SR may be considered to be a plausible nearly neutral model of molecular evolution without the apparent defi cien-cies of previous models, giving new support to the balanced nearly neutral models.
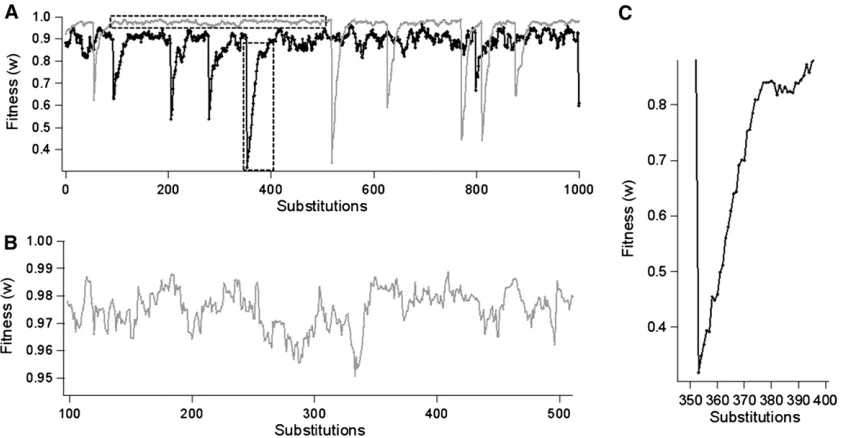
Figure 2 (A) Fitness of the evolutionary process for a sequence of substitutions with a randomly shifting optimum (variable geometric model, VR). The thick line corresponds to population size ofN¼50 (t¼5·105), and the thin line corresponds toN¼200 (t¼105). (B) Zoom of the balanced steady
This difference between the SR and house-of-cards models is explained because, in contrast to the house-of-cards model, evolution does not stop because of low strength of selection in the SR, since in the FGM it is possible to overshoot the optimum phenotypic value; i.e., mutations directed to the phenotype with highest fitness in the FGM can decrease thefitness (because they can over-shoot the optimum value) and thus more mutations can
behave as effectively neutral. Contrarily, in the house-of-cards model all mutations directed toward higher fitness confer higherfitness if they arefixed, because advantageous mutations can take unlimited positive selection coefficients. The consequence is that molecular evolution in the house-of-cards models tends to stop because the pressure toward higher fitness decreases the number of possible further ad-vantageous mutations.
The evolutionary role of compensatory mutations is not completely understood and there are few theoretical models in evolutionary biology in which compensatory mutations are explicitly incorporated (Poon et al. 2005). It has been suggested that the current evidence for a high rate of ad-vantageous mutationsfixed by positive selection,50% or more (Fayet al.2002; Bierne and Walker 2004; Eyre-Walker 2006; Bachtrog 2008), could be explained as the effect of compensatory mutations (Kondrashov et al.2002; DePristoet al.2005; Pálet al.2006; Campset al.2007). This idea was proposed earlier by Hartl and Taubes (1996) using the FGM framework, stating that in the steady state there is “selection without adaptation,” i.e., positive selection but upholding only thestatus quoin a balance between delete-rious mutations and later advantageous compensatory mutations. In contrast with this assumption, we found that the proportion of advantageous (compensatory) mutations fixed by positive selection (i.e., strictly advantageous muta-tions) is very low in the steady state (much lower than 50%; see Figure 5). The explanation for this result is that
com-pensatory mutations are abundant and thus come after one or a very small number of deleterious mutations previously fixed by drift, and thus both are of the same order of mag-nitude; i.e., both are mainly effectively neutral (see Figure 5). In other words, given that in the SR not more than 50% of substitutions are advantageous and the distribution of selection coefficients of substitutions is leptokurtic (Figure 3), necessarily only a small proportion of advantageous sub-stitutions (s.0) could be strictly advantageous (s.1/N). Thus, given the small selection coefficients of advantageous mutations, it is difficult to explain the high rate of mutations fixed by positive selection (Fayet al.2002; Bierne and Eyre-Walker 2004; Eyre-Eyre-Walker 2006; Bachtrog 2008). It is pos-sible that if compensatory mutations were very rare, on the average several deleterious substitutions could befixed be-fore an advantageous mutation compensated the previous effect of the deleterious ones. In this case, a higher propor-tion of compensatory substitupropor-tions could be of greater size and strictly advantageous. By contrast, our model assumes a high rate of compensatory mutations, which is in agree-ment with current studies (Poon and Otto 2000; Whitlock et al. 2003; Poon et al. 2005). For example, Poon et al.’s (2005) study in viruses, prokaryotes, and eukaryotes revealed Figure 4 (A) Mean selection coefficient (solid line and right scale) and
standard deviation of selection coefficients (left scale) for different muta-tion sizes (r). Dotted lines correspond to effective population sizeN¼10 and dashed lines toN¼100; there are also triangles (N¼1000) and circles (N¼10,000), which are indistinguishable. Lines are superposed for different dimensions (n¼3,n¼30) and different environmental vari-ability and amplitude (fixed and shifting optimum witht ¼104,s
a ¼
0.425). (B) Coefficient of variation of selection coefficients for different mean step sizes.N¼1000 (dashed line);N¼10 (dotted line).
Figure 5 Ratio between substitution rate and mutation rate in relation to population size for different sizes of mutation effects in the SR. (A) Av-erage sizer¼0:5 (s20:13,ss0.13). (B)r¼0:3 (s20:055,ss
0.055), (C)r¼0:1 (s20:01,ss0.13), (D)r¼0:0025 (s0,ss0).
Dashed lines correspond to the total substitution rate. The upper contin-uous lines represent to effectively neutral substitutions. The lower con-tinuous lines correspond to strictly advantageous and strictly deleterious
ðjNsj.1Þsubstitution rates, which are indistinguishable. All plots were obtained for dimensionsn¼2,n¼10, n¼ 30, but all are perfectly superposed and indistinguishable. Each simulation corresponds to 2·104
that on average there are 11.8 compensatory mutations per deleterious mutation. Our conclusions seem robust in this scenario.
Both the slightly deleterious mutation and the balanced mutation theories (Figure 1C,D) have been considered within the nearly neutral theory. In turn, the distinction between nearly neutral models and selection models seems to be somewhat unclear (see Ohta 1996; Kreitman 1996; Ohta and Gillespie 1996). The main difference between the nearly neutral and selection theories is that the former predicts a negative relationship between evolution and pop-ulation size whereas the latter predicts the contrary (Ohta 1996). The role of population size in population genetic models of molecular evolution was examined by Gillespie (1999), who defined three domains according to the rela-tionship between substitution rate and population size. In Ohta’s domain, the rate of substitution decreases with in-creasing population size, while in Kimura’s domain, the rate of substitution remains close to the mutation rate, while in Darwin’s domain, the rate of substitution increases with
in-creasing population size. Our SR verified an inverse relation-ship between the substitution rate and population size (Figure 5) (see also Gu 2007a); thus the SR falls under Ohta’s domain. Because this inverse relationship is essential to explaining the protein molecular clock under the nearly neutral theory (see Ohta 1992), the SR may also be under-stood as a nearly neutral model. However, it is important to distinguish the SR from the slightly deleterious mutation theory (Figure 1C), which is the model most commonly associated with the nearly neutral theory (Gillespie 1995, 2004; Ohta 1996). The differences between the slightly del-eterious mutation models and the SR are important in their predictions about both mutations and substitutions. There are two major differences: (i) the mutation assumptions of the SR involve a higher fraction of advantageous (mainly compensatory) mutations than the slightly deleterious mu-tation models and (ii) the predictions of the SR imply a much greater fraction of advantageous substitutions than the slightly deleterious mutation models; thus the SR predicts 50% advantageous substitutions (Figure 1D and Figure 3, right; see also Gillespie 1995; Sella and Hirsh 2005).
Furthermore, the SR can relate the evolutionary rate to the average size of phenotypic effects of mutations (muta-tion size). In the SR the total evolu(muta-tionary rate is determined mainly by the effectively neutral mutations and is greater for smaller mutation sizes (Figure 5), which is consistent with the decrease of the mean selection coefficients of larger mutations (Figure 4A). However, when the rate of strictly advantageous and strictly deleterious substitutions are de-scribed separately, we found a complex relationship with population size for different ranges of mutation sizes: a de-crease with population size for larger mutation sizes (Figure 5A,B), a maximum for intermediate sizes (Figure 5C), and an increase with population size for smaller mutation sizes (Figure 5D). This trend to increase the rate of strictly ad-vantageous substitutions (with the corresponding balance by deleterious substitutions) with population size when mu-tation size is low may be explained as follows. As mentioned before, the decrease of the evolutionary rate with population size is the commonly expected behavior under the nearly neutral framework, because larger population sizes imply strong selection against deleterious mutations, decreasing the substitution rate of deleterious mutations and thus also decreasing the rate of advantageous compensatory muta-tions. Although we found this pattern for the total molecular rate, we found that for lower mutation sizes the rate of strictly advantageous substitutions increases with popula-tion size (Figure 5D, lower curve), which is not typically predicted by nearly neutral models. This occurs because for small mutation sizes, the SR implies that a high propor-tion of nearly neutral mutapropor-tions (50%) are advantageous (Figure 3C). In this situation, the distribution of selection coefficients of mutations is symmetrical (Figure 3C) and thus the increase of population size has the effect of increas-ing the strength of selection equally for advantageous and deleterious mutations. Therefore, given that the probability Figure 6 Ratio between substitution rate and mutation ratevs.
popula-tion size for different sizes of mutapopula-tion effects in the VR. (A) Average size
r¼0:5 (s20:13,ss0.13). (B)r¼0:3 (s20:055,ss0.055), (C)
r¼0:1 (s20:01,ss 0.13), (D)r¼0:0025 (s0,ss 0). Dashed
lines correspond to the total substitution rate. The upper continuous lines correspond to neutral substitutions. The lower continuous lines corre-spond to a strictly advantageous (s.1/N) substitution rate; dotted lines correspond to a strictly deleterious (s, 21/N) substitution rate. All plots were obtained for dimensionsn¼2 (red),n¼10 (black),n¼30 (blue). Each simulation corresponds to 2·104substitutions. The environmental
variability parameters weresa¼0.85,t¼500.N, which on the average
offixation is higher for advantageous than deleterious muta-tions, the effect of the increment in the strength of selection when the distribution of mutations is symmetrical is the in-crease of the rate of strictly advantageous mutations (with the respective balance of strictly deleterious ones) (Figure 5D).
As mentioned before, contrary to previous studies of the FGM that have been focused separately on the adaptive process (Orr 1998, 1999, 2006; Welch and Waxman 2003; Griswold and Whitlock 2003) or on the steady state (Hartl and Taubes 1998; Poon and Otto 2000; Sella and Hirsh 2005; Tenaillonet al.2007; Sella 2009), the VR is a model in which there is an interplay between adaptive and bal-anced steady-state processes (Figure 2; see also Razeto-Barryet al.2011). Generally, selection models of molecular evolution assume environmental changes (Gillespie 1993; Ohta and Gillespie 1996), as for example, in the mutational landscape model (Gillespie 1984, 1991), NK model (Kauff-man 1993), TIM model (Takahataet al.1975), and SAS-CFF model (Gillespie 1991). The reason is that populations tend to evolve to a point where most mutations are deleterious through the substitution of advantageous mutations. The idea that permanent advantageous mutationfixation by pos-itive selection could occur without optimum shifts probably comes from earlyfindings in the vertebrate major histocom-patibility complex and coevolutionary processes of patho-gens that erroneously were taken as a model for the general evolution of proteins (Hughes 2007). Thus, a more general molecular evolutionary model would predict that when all mutationally accessible advantageous alleles are exhausted, the majority of newly arising mutations will be deleterious (Gillespie 1994) or nearly neutral (Hartl and Taubes 1996). Accordingly, in the VR the evolutionary rate increases due to temporal environmental fluctuations (Fig-ure 6) compared to the rate without environmentalfl uctua-tions but with the same mutation sizes (Figure 5) (see also Razeto-Barry et al. 2011, Figure 2). Given that in the VR populations reach dynamic (i.e., nonstatic) steady state after adaptive bouts, evolution does not stop without environ-mental fluctuations (contrary to other models; see Ohta 1996). Nevertheless, given that compensatory mutations cannot explain the repeated substitutions by positive selec-tion, and because positive selection tends to stop after some steps (Hughes 2007), the optimum shifts assumption is the only remaining reasonable hypothesis for maintaining a se-lection model at the molecular level.
The higher evolutionary rate in the VR compared to the SR is evidently due to an increase of strictly advantageous substitution rate (Figure 6, lower solid lines). Interestingly, this increase is greater for smaller mutation sizes, attaining values k/u . 1 (Figure 6D). Paradoxically, this does not imply that for smaller mutation sizes the evolutionary pro-cess becomes more influenced by natural selection. In fact, the rate of strictly advantageous substitutions exceeded the effectively neutral rate with larger mutation sizes even for low population size (Figure 6, A and B), but this did not
occur with smaller mutation sizes (Figure 6D). The increase of the strictly advantageous substitution rate for smaller mutation sizes occurs because the adaptive process needs a larger number of advantageous substitutions to reach the steady state (see Razeto-Barry and Maldonado 2011). Interestingly, the evolutionary rate attains a plateau that does not depend on population size, but rather on the com-plexity (number of dimensions) of organisms (Figure 6, A and B). For greater organism complexity, the evolutionary rate increases, which may be understood as a consequence of Orr’s (2000)“cost of complexity”; that is, more complex organisms spend more time in adaptive processes than less complex ones, accumulating on the average a larger number of mutations with smaller adaptive contribution (see Razeto-Barry et al. 2011; Razeto-Barry and Maldonado 2011). The independence of substitution rate and popula-tion size in the plateau is due to the fact that the increase of strictly advantageous substitutions is accurately balanced by the decrease of effectively neutral substitutions (Figure 6). As the effectively neutral substitution rate decreases mono-tonically, the strictly advantageous rate increases to a pla-teau. This is consistent with recent evidence on the rate of strictly advantageous substitution that appears to be inde-pendent of population size (Bachtrog 2008). Bachtrog (2008) found only a slightly higher rate of strictly advanta-geous substitutions in Drosophila melanogaster than in D. miranda, in spite of the latter having an effective population sizefive times smaller than the former. Furthermore, more generally this may explain why the estimated proportion of amino acid variants driven tofixation by positive selection seems to differ among species with small population sizes but not much for species with very large effective population sizes, even though these differ by several orders of magni-tude (Harris 2010, Tables 2 and 3).
a population is close to the optimum, a Gaussian fitness function is a good local approximation for many arbitrary fitness functions (Lande 1980); however, it could be less accurate under strong environmental change where the pop-ulation is not so near the optimum (Martin and Lenormand 2006a). Finally, models relaxing the assumption ofNu ,1 should be developed in the future.
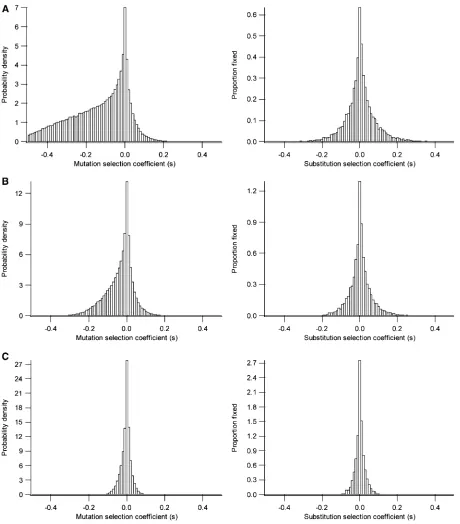
Contrary to the suggestion of Orr (1998) the uniform distribution we assumed for mutation sizes (see also Kimura 1983) is consistent with the majority of current empirical and theoretical evidence on distributions of the fitness effects of mutations. According to the majority of studies, the distributions of deleterious mutations (Keightley 1994; Lynch et al.1999) and beneficial mutations (Sanjuánet al. 2004; Kassen and Bataillon 2006; Orr 2006, 2010) are lep-tokurtic. Note that all these studies (empirical and theoret-ical) dealt with the size of the fitness effects of mutations (selection coefficients), not with the size of thephenotypic effects of mutations. As is clear in Figure 3 (left), taking a uniform distribution of mutational (phenotypic) effects (r), the distribution offitness effects (selection coefficients, s) is leptokurtic. In fact, when the average mutational size (r) is large enough (Figure 3A), the distribution ofsamong deleterious mutations is L-shaped rather than exponential, which coincides with the literature (Lynch et al. 1999), while the distribution of s among beneficial mutations is exponential-like, which also coincides with the literature (Sanjuán et al. 2004; Kassen and Bataillon 2006; Orr 2006, 2010). Note also that the exponential distribution of s arises from different mutational distributions ofr, includ-ing the uniform (Orr 2006).
In addition to the mentioned relationships among sub-stitution rate, mutation size, population size, and organis-mal complexity, some important parameters were found linked in the SR and the VR. For example, for both the SR and the VR, the absolute magnitude of the coefficient of variation of selection coefficients (ss=s) approaches one as the mean step size increases whenN$100 (e.g., Figure 4B, upper curve); that is, if the mean of the absolute value of the selection coefficients decreases, the standard deviation increases nearly in the same proportion. Recently, it has been realized that a benefit of the FGM is that it makes some of the distributions used in molecular evolution biologically interpretable (Sella and Hirsh 2005; Martin and Lenormand 2006a,b, 2008; Gu 2007a,b).A prioriassumptions of a par-ticular distribution of mutant selection coefficients have been considered inappropriate because the distribution de-termined by evolutionary dynamics will differ in important ways from distributions assumed a priori (Sella and Hirsh 2005). But another problem is that some parameters as-sumed in the general models (particularly s and ss) are crucial by themselves for other biologically relevant issues and should be determined instead of just being assumed. For example, the proportion of deleterious to advantageous mutations (determined bysandss) is crucial to estimating the probability of extinction of populations and it is
fre-quently fixed arbitrarily in the models due to the lack of other theoretical or empirical criteria to determine it (Whit-lock 2000; Whit(Whit-locket al.2003).
Other parameters are also linked in the SR. The ratio between advantageous and deleterious mutations is locked; i.e., it cannot take arbitrarily independent values. It yields a maximum value of 1 when mutation size tends to zero (Figure 3C, according to Fisher 1930). When mutation size is small, the limiting factor for the selection coefficient of deleterious and advantageous mutations is the size of muta-tions (Figure 3C), and a large proportion (50%) of nearly neutral mutations are advantageous. Interestingly, this fact was suggested verbally by Gillespie (1995) as a criticism to Ohta’s (1977, 1992) assumptions, based on Fisher’s (1930) classical result.
The results of simulations indicate that at least three of the conclusions of this study are well verified in the model. First, compensatory substitutions cannot take arbitrary values and necessarily a low proportion of compensatory substitutions are strictly advantageous. Second, the pro-portion of advantageous substitutions has a minimum of 0.5 (for very low environmental variability), and the proportion of advantageous mutations has a maximum of 0.5 (for very small mutation size). Third, the absolute magnitude of the coefficient of variation of selection coefficients approaches one. Again, these conclusions support the importance of obtaining values for these parameters by modeling the evolutionary process and not by a priori decisions (Sella and Hirsh 2005), which in turn, may give independent plau-sibility to some molecular evolutionary models rather than to others (Figure 1) when there are not enough data to judge.
Acknowledgments
We thank Associate Editor Lindi Wahl and two anonymous reviewers for their insightful suggestions. We also thank the Institute of Ecology and Biodiversity ICM-P05-002 and PFB-23-CONICYT, and FONDECYT 1090794 (R.A.V.), and the Institute of Philosophy and Complexity Science (IFICC). P.R.-B. acknowledges support from Doctoral Scholarship 21050901-CONICYT and Supporting Doctoral Thesis Schol-arship 23070216-CONICYT.
Literature Cited
Bachtrog, D., 2008 Similar rates of protein adaptation in Drosoph-ila mirandaandD. melanogaster, two species with different cur-rent effective population sizes. BMC Evol. Biol. 8: 334. Barton, N. H., 2001 The role of hybridization in evolution. Mol.
Ecol. 10: 551–568.
Bernardi, G., 2007 The neoselectionist theory of genome evolu-tion. Proc. Natl. Acad. Sci. USA 104(20): 8385–8390.
Bromham, L., and D. Penny, 2003 The modern molecular clock. Nat. Rev. Genet. 4: 216–224.
Camps, M., H. Asael, and A. L. Lawrence, 2007 Genetic con-straints on protein evolution. Crit. Rev. Biochem. Mol. Biol. 42: 313–326.
Crow, J. F., and M. Kimura, 1970 An Introduction to Population Genetics Theory. Harper & Row, New York.
DePristo, M. A., D. M. Weinreich, and D. L. Hartl, 2005 Missense meanderings in sequence space: a biophysical view of protein evolution. Nat. Rev. Genet. 6: 678–687.
Eyre-Walker, A., 2006 The genomic rate of adaptive evolution. Trends Ecol. Evol. 21(10): 569–575.
Eyre-Walker, A., P. D. Keightley, N. G. C. Smith, and D. Gaffney, 2002 Quantifying the slightly deleterious mutation model of molecular evolution. Mol. Biol. Evol. 19(12): 2142–2149. Ewens, W. J., 2004 Mathematical Population Genetics. Springer,
Philadelphia, PA.
Fay, J. C., G. J. Wyckoff, and C. I. Wu, 2002 Testing the neutral theory of molecular evolution with genomic data from Drosoph-ila. Nature 415: 1024–1026.
Fisher, R. A., 1930 Genetical Theory of Natural Selection. Claren-don Press, Oxford.
Gillespie, J. H., 1984 Molecular evolution over the mutational landscape. Evolution 38: 1116–1129.
Gillespie, J. H., 1991 The Causes of Molecular Evolution. Oxford University Press, Oxford.
Gillespie, J. H., 1993 Substitution processes in molecular evolu-tion. I. Uniform and clustered substitutions in a haploid model. Genetics 134: 971–981.
Gillespie, J. H., 1994 Substitution processes in molecular evolu-tion. III. Deleterious alleles. Genetics 138: 943–952.
Gillespie, J. H., 1995 On Ohta’s hypothesis: most amino acid sub-stitutions are deleterious. J. Mol. Evol. 40: 64–69.
Gillespie, J. H., 1999 The role of population size in molecular evolution. Theor. Popul. Biol. 55: 145–156.
Gillespie, J. H., 2004 Population Genetics, Ed. 2. Johns Hopkins Univ. Press, London.
Griswold, C. K., and M. C. Whitlock, 2003 The genetics of adap-tation: the roles of pleiotropy, stabilizing selection and drift in shaping the distribution of bidirectionalfixed mutational effects. Genetics 165: 2181–2192.
Gu, X., 2007a Stabilizing selection of protein function and distri-bution of selection coefficient among sites. Genetica 130: 93– 97.
Gu, X., 2007b Evolutionary framework for protein sequence evo-lution and gene pleiotropy. Genetics 175: 1813–1822.
Haldane, J. B. S., 1957 The cost of natural selection. J. Genet. 55: 511–524.
Harris, E. E., 2010 Nonadaptive processes in primate and human evolution. Yearb. Phys. Anthropol. 53: 13–45.
Hartl, D., and C. H. Taubes, 1996 Compensatory nearly neutral mutations: selection without adaptation. J. Theor. Biol. 182: 303–309.
Hartl, D., and C. H. Taubes, 1998 Towards a theory of evolution-ary adaptation. Genetica 103: 525–533.
Hughes, A. L., 2007 Looking for Darwin in all the wrong places: the misguided quest for positive selection at the nucleotide se-quence level. Heredity 99: 364–373.
Kassen, R., and T. Bataillon, 2006 Distribution offitness effects among beneficial mutations before selection in experimental populations of bacteria. Nat. Genet. 38: 484–488.
Kauffman, S. A., 1993 The Origins of Order. Oxford University Press, Oxford.
Keightley, P. D., 1994 The distribution of mutation effects on vi-ability inDrosophila melanogaster. Genetics 138: 1315–1322. Kimura, M., 1968 Evolutionary rate at the molecular level. Nature
217: 624–626.
Kimura, M., 1979 Model of effectively neutral mutations in which selective constraint is incorporated. Proc. Natl. Acad. Sci. USA 76: 3440–3444.
Kimura, M., 1983 The Neutral Allele Theory of Molecular Evolution. Cambridge University Press, Cambridge.
Kondrashov, A. S., S. Sunyaev, and F. A. Kondrashov, 2002 Dobzhansky–Muller incompatibilities in protein evolu-tion. Proc. Natl. Acad. Sci. USA 99: 14878–14883.
Kreitman, M., 1996 The neutral theory is dead: long live the neutral theory. Bioessays 18(8): 678–683.
Lande, R., 1980 The genetic covariance between characters main-tained by pleiotropic mutations. Genetics 94: 203–215. Lynch, M., J. Blanchard, D. Houle, T. Kibota, S. Schultz et al.,
1999 Perspective: spontaneous deleterious mutation. Evolu-tion 53: 645–663.
Martin, G., and T. Lenormand, 2006a A general multivariate ex-tension of Fisher’s geometrical model and the distribution of mutation fitness effects across species. Evolution 60(5): 893– 907.
Martin, G., and T. Lenormand, 2006b Thefitness effect of muta-tions across environments: a survey in light offitness landscape models. Evolution 60: 2413–2427.
Martin, G., and T. Lenormand, 2008 The distribution of beneficial andfixed mutationfitness effects close to an optimum. Genetics 179: 907–916.
Nielsen, R., and Z. Yang, 2003 Estimating the distribution of se-lection coefficients from phylogenetic data with applications to mitochondrial and viral DNA. Mol. Biol. Evol. 20(8): 1231– 1239.
Nunney, L., 2003 The cost of natural selection revisited. Ann. Zool. Fenn. 40: 185–194.
Ohta, T., 1972 Evolutionary rate of cistrons and DNA divergence. J. Mol. Evol. 1: 150–157.
Ohta, T., 1973 Slightly deleterious mutant substitutions in evolu-tion. Nature 246: 96–98.
Ohta, T., 1977 Extension of the neutral mutation drift hypothesis, pp. 148–167 inMolecular Evolution and Polymorphism, edited by M. Kimura. National Institute of Genetics, Mishima, Japan. Ohta, T., 1987 Very slightly deleterious mutations and the
molec-ular clock. J. Mol. Evol. 26: 1–6.
Ohta, T., 1992 The nearly neutral theory of molecular evolution. Annu. Rev. Ecol. Syst. 23: 263–286.
Ohta, T., 1996 The current significance and standing of neutral and nearly neutral theoies. BioEssays 18(8): 673–694. Ohta, T., 2007 Drift and selection in evolving interacting systems,
pp. 285–298 in Structural Approaches to Sequence Evolution, chap. 13, edited by U. Bastolla, M. Porto, H. E. Roman, and M. Vendruscolo. Springer, Berlin/Heidelberg.
Ohta, T., and J. H. Gillespie, 1996 Development of neutral and nearly neutral theories. Theor. Popul. Biol. 49: 128–142. Ohta, T., and M. Kimura, 1971 On the constancy of the
evolution-ary rate of cistrons. J. Mol. Evol. 1: 18–25.
Ohta, T., and H. Tachida, 1990 Theoretical study of near neutral-ity. I. Heterozygosity and rate of mutant substitution. Genetics 126: 219–229.
Orr, A. H., 1998 The population genetics of adaptation: the dis-tribution of factorsfixed during adaptive evolution. Evolution 52(4): 935–949.
Orr, A. H., 1999 The evolutionary genetics of adaptation: a simu-lation study. Genet. Res. Camb. 74: 207–214.
Orr, A. H., 2000 Adaptation and the cost of complexity. Evolution 54: 13–20.
Orr, A. H., 2006 The distribution of beneficial fitness effects among beneficial mutations in Fisher’s geometric model of ad-aptation. J. Theor. Biol. 238: 279–285.
Pál, C., B. Papp, and M. J. Lercher, 2006 An integrated view of protein evolution. Nat. Rev. Genet. 7: 337–348.
Poon, A., and S. P. Otto, 2000 Compensating for our load of mutations: freezing the meltdown of small populations. Evolu-tion 54: 1467–1479.
Poon, A., B. H. Davis, and L. Chao, 2005 The coupon collector and the suppressor mutation: estimating the number of compensa-tory mutations by maximum likelihood. Genetics 170: 1323– 1332.
Razeto-Barry, P., and K. Maldonado, 2011 Adaptive cis-regulatory changes may involve few mutations. Evolution 65(11): 3332– 3335.
Razeto-Barry, P., J. Díaz, D. Cotoras, and R. A. Vásquez, 2011 Molecular evolution, mutation size and gene pleiotropy: a geometric reexamination. Genetics 187(3): 877–885. Sanjuán, R., A. Moya, and S. F. Elena, 2004 The distribution of
fitness effects caused by single-nucleotide substitutions in an RNA virus. Proc. Natl. Acad. Sci. USA 101: 8396–8401. Sella, G., 2009 An exact steady-state solution of Fisher’s
geomet-ric model and other models. Theor. Popul. Biol. 75: 30–34. Sella, G., and A. E. Hirsh, 2005 The application of statistical
phys-ics to evolutionary biology. Proc. Natl. Acad. Sci. USA 102(27): 9541–9546.
Silander, O. K., O. Tenaillon, and L. Chao, 2007 Understanding the evolutionary fate offinite populations: the dynamics of mu-tational effects. PLoS Biol. 5(4): e94.
Su, Z., Y. Zeng, and X. Gu. 2010 A preliminary analysis of gene pleiotropy estimated from protein sequences. J. Exp. Zool. 314B: 115–122.
Tachida, H., 1991 A study on a nearly neutral mutation model in
finite populations. Genetics 128: 183–192.
Tachida, H., 1996 Effects of the shape of distribution of mutant effect in nearly neutral mutation models. J. Genet. 75(1): 33– 48.
Tachida, H., 2000 Molecular evolution in a multisite nearly neu-tral mutation model. J. Mol. Evol. 50: 69–81.
Takahata, N., K. Ishii, and H. Matsuda, 1975 Effect of temporal
fluctuation of selection coefficient on gene frequency in a popu-lation. Proc. Natl. Acad. Sci. USA 72: 4541–4545.
Tenaillon, O., O. K. Silander, J. P. Uzan, and L. Chao, 2007 Quantifying organismal complexity using a population genetic approach. PLoS ONE 2: e217.
Welch, J. J., and D. Waxman, 2003 Modularity and the cost of complexity. Evolution 57(8): 1723–1734.
Whitlock, M. C., 2000 Fixation of new alleles and the extinction of small populations: drift load, beneficial alleles, and sexual selection. Evolution 54: 1855–1861.
Whitlock, M. C., C. K. Grisworld, and A. D. Peters, 2003 Compensating for the meltdown: the critical effective size of a population with deleterious and compensatory muta-tions. Ann. Zool. Fenn. 40: 169–183.