HSO and PSO framework
Priyanka Katuri
M.Tech Scholar, Dept. of Computer Science and System Engineering, Andhra University College of Engineering (A),
Visakhapatnam, AP, India
ABSTRACT: In this paper, a multilevel thresholding (MT) algorithm based on the harmony search optimization (HSO) is introduced and compared with PSO. HSO is an evolutionary method which is inspired in musicians improvising new harmonies while playing. Different to other evolutionary algorithms, HSO exhibits interesting search capabilities still keeping a low computational overhead. The proposed algorithm encodes random samples from a feasible search space inside the image histogram as candidate solutions, whereas their quality is evaluated considering the objective functions that are employed by the Otsu’s or Kapur’s methods. Guided by these objective values, the set of candidate solutions are evolved through the HSO operators until an optimal solution is found. PSO is effectively a better techniques as it optimises the search to obtain the global best solution. Experimental results demonstrate the high performance is obtained is using the PSO method for the segmentation of digital images.
KEYWORDS: Multi Level thresholding, Harmony search optimization, Particle swam optimization, MR images.
I.INTRODUCTION
Segmentation is the most widely studied topic in computer vision. There are two types of approaches to deal with this problem: model-free methods (bottom-up fashion) and knowledge-based methods (top-down fashion). Model-free methods are often based on clustering, aiming at grouping together pixels with consistent visual properties according to a certain similarity criterion. Knowledge-driven methods, on the other hand, assume that the space of admissible solutions is constrained, and they seek a solution that is a compromise between the one produced from the observations and the one expressed in the model space.
Popular examples in the context of model-free segmentation refer to the mean-shift algorithm [Comaniciu 2002], variational formulations such as the Mumford-Shah framework [Mumford 1989] and its level set variant [Chan 2001, Paragios 2002], or graph-based methods including normalized cuts [Shi 2000], graph-cuts [Boykov 2006] etc. Due to the lack of assumptions on the geometric form of the object of interest, these methods are free in terms of admissible solutions, which is a desired property in certain cases but also an undesirable one since it can lead to erroneous results due to intensity variability, occlusions, noise presence, etc.
reference image associated with a ground truth segmentation. The segmentation of the target image is obtained by warping the atlas segmentation based on the deformation field from registration. In this context, choosing the atlas used as prior for the segmentation is very important. Thus, multi-atlas segmentation approaches with more sophisticated atlas construction techniques have been developed to capture shape variations of the object of interest. Since atlas-based segmentation is highly dependent on registration which is another active topic in computer vision, we will not discuss this type of approaches in details and we refer the reader to [Rohlfing 2005].
In recent years image processing has been applied to different areas as engineering, medicine, agriculture, and so forth. Since most of such implementations use a TH methodology, several techniques had been studied. Generally, TH methods are divided into parametric and nonparametric [2–5]. Parametric approaches need to estimate values of a probability density function to model each class. The estimation process is time consuming and computationally expensive.
On the other hand, the TH nonparametric employs several criteria such as the between-class variance, the entropy, and the error rate [6–8] in order to verify the quality of a th value. These metrics could also be used as optimization functions since they result as an attractive option due their robustness and accuracy. There exist two classical thresholding methods. The first, proposed by Otsu in [6] that maximizes the variance between classes while the second method, submitted by Kapur et al. in [7], uses the maximization of the entropy to measure the homogeneity among classes. Their efficiency and accuracy have been already proved for a bi-level segmentation [4]. Although they can be expanded for MT, their computational complexity increases exponentially when a new threshold is incorporated [5].
As an alternative to classical methods, the MT problem has also been handled through evolutionary optimization methods. In general, they have demonstrated to deliver better results than those based on classical techniques in terms of accuracy, speed, and robustness. Numerous evolutionary approaches have been reported in the literature. Hammouche et al. in [9] provides an interesting survey of how different evolutionary algorithms are used to solve the Kaptur’s and Otsu’s problems. The study uses four classical evolutionary algorithms to test their efficiency in MT. Such methods include differential evolution (DE) [10], simulated annealing (SA) [11], and tabu search (TS) [12]. Genetic algorithms (GA) [13], inspired on the biological evolution, have been also used for solving segmentation tasks. One interesting example is presented in [14], where a GA-based algorithm is combined with Gaussian models for multilevel thresholding. Other similar works, such as that of Yin [15] proposes an improved GA for optimal thresholding. In the approach, it is used as a learning strategy to increase the speed of convergence.
Evolutionary approaches inspired on swarm behavior, such as particle swarm optimization (PSO) [16] and artificial bee colony (ABC) [17], have been employed to face the segmentation problem. In [18], bothmethods are used to find the optimal multilevel threshold points by using the Kapur’s entropy as fitness function.
Finally, in [19], the optimal segmentation threshold values are determined by using the bacterial foraging algorithm (BFA). Such method aims to maximize the Kapur’s and Otsu’s objective functions by considering a set of operators that are based on the social foraging behavior of the bacteria EscherichaColli. On the other hand, the harmony search optimization(HSO) introduced by Geem et al.
II. IMAGE MULTILEVEL THRESHOLDING (MT)
Thresholding is a process in which the pixels of a gray scale image are divided in sets or classes depending on their intensity level ( ). For this classification it is necessary to select athreshold value (th) and follow the simple rule of
where{th1, th2, . . . , th , th +1, th } represent different thresholds. The problem for both bilevel and MT is to select the th values that correctly identify the classes. Although, Otsu’s and Kapur’s methods are well-known approaches for determining such values, both propose a different objective function which must be maximized in order to find optimal threshold values, just as it is discussed below.
A. Between-Class Variance (Otsu’s Method)
This is a nonparametric technique for thresholding proposed by Otsu [6] that employs the maximum variance value of the different classes as a criterion to segment the image. Taking the intensity levels from a gray scale image or from each component of a RGB (red, green, and blue) image, the probability distribution of the intensity values is computed as follows:
where is a specific intensity level (0 ≤ ≤ − 1), is the component of the image which depends if the image is gray scale or RGB, whereas NP is the total number of pixels in the image. (histogram) is the number of pixels that corresponds to the intensity level in .The histogram is normalized within a probability distribution Ph . For the simplest segmentation (bilevel) two classes are defined as
where 0(th) and 1(th) are probabilities distributions for 1 and 2, as it is shown by
It is necessary to compute mean levels 0 and 1 that define the classes using (10). Once those values are calculated, the Otsu variance between classes 2 is calculated using (11) as
follows:
to compute the variances and their respective elements. The objective function (th) in (13) can thus be rewritten for multiple thresholds as follows:
whereTH= [th1, th2, . . . , th(n−1)], is a vector containing multiple thresholds and the variances are computed through
And, for the mean values
Similar to the bilevel case, for the MT using the Otsu’s method, corresponds to the image components, RGB =1, 2, 3, and gray scale = 1.
B. Entropy Criterion Method (Kapur’s Method)
where the entropies H1 and H2 are computed by the following model:
Similar to the Otsu’s method, the entropy-based approach can be extended for multiple threshold values; for such a case, it is necessary to divide the image into classes using the similar number of thresholds. Under such conditions, the new objective function is defined as:
Each entropy is computed separately with its respective th value, so (21) is expanded for entropies:
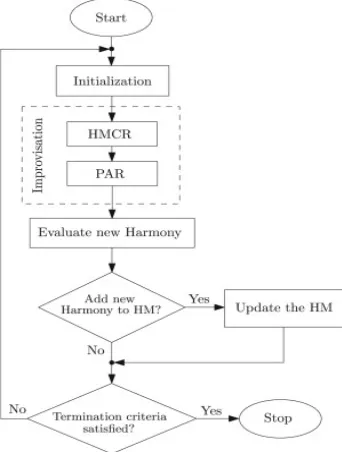
III. MULTILEVEL THRESHOLDING USING HARMONY SEARCH ALGORITHM (HSMA)
A. Harmony Representation.
Fig 1. HSA Frame work
Therefore, the complete population is represented as
whereTrefers to the transpose operator, HMS is the size of the harmony memory, is the element of HM, and c =1, 2, 3 is set for RGB images while c = 1 is chosen for gray scale images. For this problem, the boundaries of the search space are set to l = 0 and u = 255, which correspond to image intensity levels.
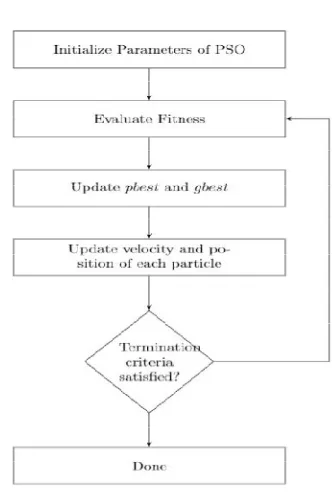
B. Swarm Intelligence:Swarm intelligence (SI) is the collective behavior of decentralized, self-organized systems, natural or artificial. The concept is employed in work on artificial intelligence. The expression was introduced by Gerardo Beni and Jing Wang in 1989, in the context of cellular robotic systems. SI systems consist typically of a population of simple agents or boids interacting locally with one another and with their environment. The inspiration often comes from nature, especially biological systems. The agents follow very simple rules, and although there is no centralized control structure dictating how individual agents should behave, local, and to a certain degree random, interactions between such agents lead to the emergence of "intelligent" global behavior, unknown to the individual agents. Examples in natural systems of SI include ant colonies, bird flocking, animal herding, bacterial growth, fish schooling and microbial intelligence.
Fig 2. Flow Chart of PSO Optimization
When a particle takes part of the population as its topological neighbors, the second best value is a local best and is called lbest. Neighborhood bests allow parallel exploration of the search space and reduce the susceptibility of PSO to falling into local minima, but slow down convergence speed.
IV. RESULTS AND DISCUSSION
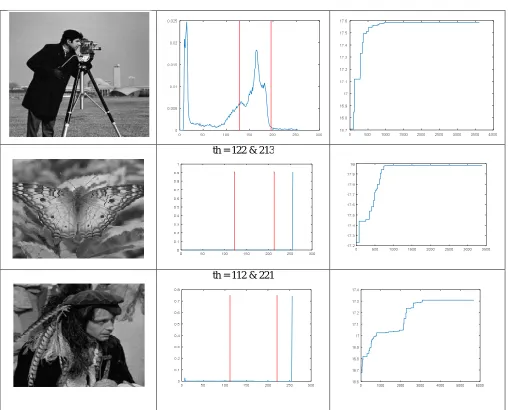
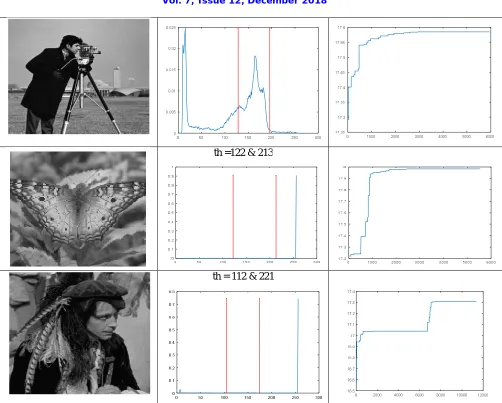
HSO Kapur :
The resultant image obtained after applying the HSO using kapur
method
Histogram of image after applying 2 thresholds values on original image(Gray level on X-axis &
Frequency on Y-axis)
Convergence curve for hso using kapur method (Number of iterations on X-axis & Objective function values on Y-axis).
th = 101 & 163
th = 99 & 173
th = 122 & 213
th = 112 & 221
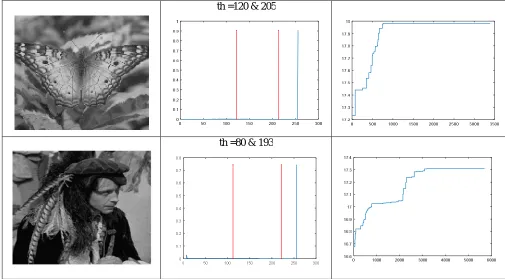
HSO Otsu:
The resultant image obtained after applying the HSO using otsu method
Histogram of image after applying 2 threshold values on original image(Gray level on X-axis & Frequency on Y-axis)
Convergence curve for hso using otsu method (number of iterations on X-axis & Objective function values on Y-axis.
th =100 & 157
th = 114 & 180
th =80 & 193
Table 2: Results obtained after applying HSO using Otsu over Lena, Baboon, Camera man, Butterfly and Hunter images
PERFORMANCE ANALYSIS TABLE USING HSO:
HSO STD MEAN PSNR
KAPUR CASE 1(Lena)
0.0263 17.68 14.4167
KAPUR CASE 2(Baboon)
0.0364 18.35 13.6241
KAPUR CASE 3(Camera man)
0.1791 17.5231 13.625
KAPUR CASE 4(Butterfly)
0.1928 17.8947 14.9466
KAPUR CASE 5(Hunter)
0.1666 17.1730 16.324
OTSU CASE 1(Lena)
OTSU CASE 2(Baboon)
4.14 2.4430e+03 12.546
OTSU CASE 3(Camera man)
2.3025 3.6514e+03 17.24
OTSU CASE 4(Butterfly)
0.6378 1.7486e+03 13.764
OTSU CASE 5(Hunter)
0.386 6.6196e+03 12.776
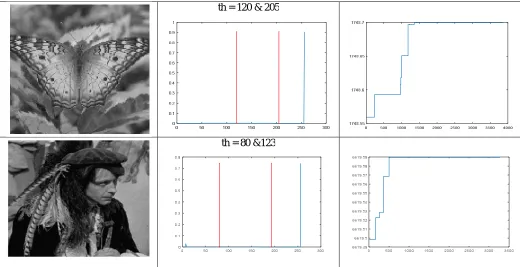
PSO Kapur:
The resultant image obtained after applying the PSO using kapurs
method
Histogram of image after applying 2 threshold values on original image(Gray level on X-axis &
Frequency on Y-axis)
Convergence curve for pso using kapurs method (Number of iterations on X-axis
and Objective function values on Y-axis).
th =101 & 163
th =99 &173
th =122 & 213
th = 112 & 221
PSO Otsu:
The resultant image obtained after applying the PSO using otsu method
Histogram of image after applying 2 threshold values on original image(Gray level on X-axis & Frequency on Y-axis)
Convergence curve for pso using otsu method with number of iterations on X-axis and Objective function values on Y-axis.
th = 100 & 157
th =114 & 180
th = 80 &123
Table 4: Results obtained after applying PSO using Otsu over Lena, Baboon, Camera man, Butterfly and Hunter images
PERFORMANCE ANALYSIS TABLE USING PSO:
PSO STD MEAN PSNR
KAPUR
CASE 1 (Lena) 0.8521 18.9350 15.0300
KAPUR
CASE 2 (Baboon) 0.4193 20.093 13.9126
KAPUR
CASE 3(Camera man) 0.0459 19.0980 14.7366
KAPUR
CASE 4( Butterfly) 0.2028 17.9868 16.8880
KAPUR
CASE 5(Hunter) 0.1826 17.6546 18.241
OTSU
CASE 1(Lena) 7.245 1.7434e+03 15.66
OTSU
CASE 2(Baboon) 4.5120 2.4446e+03 13.4507
OTSU
CASE 3(Camera man) 2.405 3.6523e+03 18.55
OTSU
CASE 4( Butterfly) 0.7364 1.7597e+03 15.1349
OTSU
VI. CONCLUSION
The proposed approach has been compared to other techniques that implement different optimization algorithms like GA and BF. The efficiency of the algorithm has been evaluated in terms of the PSNR index and the STD value. Experimental results provide evidence on the outstanding performance, accuracy, and convergence of the proposed algorithm in comparison to other methods. Although the results offer evidence to demonstrate that the standard HSO method can yield good results on complicated images, the aim of our paper is not to devise an MT algorithm that could beat all currently available methods, but to show that harmony search algorithms and Particle swarm optimization algorithm is compared and, PSO can be effectively considered as an attractive alternative for this purpose.
REFERENCES
[1] R. C. Gonzalez and R. E. Woods, Digital Image Processing, Addison Wesley, Reading, Mass, USA, 1992.
[2] R. Guo and S. M. Pandit, “Automatic threshold selection based on histogram modes and a discriminant criterion,” MachineVision and Applications, vol. 10, no. 5-6, pp. 331–338, 1998.
[3] N. R. Pal and S. K. Pal, “A review on image segmentation techniques,” Pattern Recognition, vol. 26, no. 9, pp. 1277–1294, 1993.
[4] P. K. Sahoo, S. Soltani, and A. K. C. Wong, “A survey of thresholding techniques,” Computer Vision, Graphics and ImageProcessing, [5] W. Snyder, G. Bilbro, A. Logenthiran, and S. Rajala, “Optimal thresholding: a new approach,” Pattern Recognition Letters, vol. 11, no. 12, [6] N. Otsu, “A threshold selection method from gray-level histograms,” IEEE Transactions on Systems, Man, Cybernetics, vol. 9, no. 1[7] J. N. Kapur, P. K. Sahoo, and A. K. C.Wong, “A new method for gray-level picture thresholding using the entropy of the histogram,” Computer Vision, Graphics, & Image Processing, vol. 29, no. 3, pp. 273–285, 1985.
[8] J. Kittler and J. Illingworth, “Minimum error thresholding,” Pattern Recognition, vol. 19, no. 1, pp. 41–47, 1986.
[9] K. Hammouche, M. Diaf, and P. Siarry, “A comparative study of various meta-heuristic techniques applied to the multilevel thresholding problem,” Engineering Applications of ArtificialIntelligence, vol. 23, no. 5, pp. 676–688, 2010.
[10] R. Storn and K. Price, “Differential evolution—a simple and efficient heuristic for global optimization over continuous spaces,” Journal of Global Optimization, vol. 11, no. 4, pp. 341– 359, 1997.
[11] S. Kirkpatrick, C. D. Gelatt, Jr., and M. P. Vecchi, “Optimization by simulated annealing,” Science, vol. 220, no.4598,pp. 671–680, 1983. [12] F. Glover, “Tabu Search—part I,” ORSA Journal on Computing, vol. 1, article 3, pp. 190–206, 1989.
[13] J. H. Holland, Adaptation in Natural and Artificial Systems, University of Michigan Press, Ann Arbor, Mich, USA, 1975.
[14] C. Lai and D. Tseng, “A hybrid approach using Gaussian smoothing and genetic algorithm for multilevel thresholding,” International Journal of Hybrid Intelligent Systems, vol. 1, pp. 143–152, 2004.
[15] P.-Y. Yin, “A fast scheme for optimal thresholding using genetic algorithms,” Signal Processing, vol. 72, no. 2, pp. 85–95, 1999.