Median Based Sorting - Prediction and Dynamic
Prediction Error Histogram Shifting Technique
For Reversible Watermarking
S. N. Kore, N. M. Mathpati
Associate Professor, Department of Electronics, Walchand College of Engineering, Sangli, Maharashtra, India M.Tech Student, Department of Electronics, Walchand College of Engineering, Sangli, Maharashtra, India
ABSTRACT: Reversible digital watermarking is used to successfully recover the cover image as well as hidden information with minimum distortion. Reversible watermarking techniques have very sensitive application domains such medical and military fields where integrity of cover image is very important. In this paper, we are using median based predictor to predict the cover image which does not have any effect of watermark insertion. Use of Local variance is very effective to reduce distortion. Instead of expanding prediction errors, we are using Dynamic prediction error histogram shifting to embed information for smaller payload data. Our algorithm provides high embedding capacity with minimum distortion.
KEYWORDS: Median based sorting and prediction, Dynamic prediction error histogram shifting, Local Variance I. INTRODUCTION
Digital Watermarking is used to prove ownership and in content authentication by inserting useful information in multimedia objects such as image, audio and video. In Digital image watermarking, visible or invisible watermark is embedded into image but while extracting watermark cover image is distorted. Here we need Reversible watermarking which is able to extract information as well as recover the cover image. The main difference between simple and reversible watermarking is distortion free restoration of cover image. Reversible watermarking is useful in sensitive fields like military and medical as well as in temper detection
There are several algorithms proposed for Reversible watermarking. In Difference expansion [3] based algorithm, the difference of two adjacent pixels is expanded to embed secret bit. The old pair of pixels is replaced with new pair. Location map is created for extraction. The drawback of difference expansion technique is to embed compressed location map with the payload.
In 2006, a reversible data hiding technique [7] was proposed which is based on histogram shifting. Two bins are selected from frequency histogram, one is of peak value and other is of zero value. The bins which are next to peak value bin up to zero value bin are shifted by one so as to create space next to selected peak value bin. Watermark with value ‘1’ is embedded into that space. Drawback of this technique is limited embedding capacity. For extraction, whole image is scanned sequentially and both previously peak value and increased by one value are tracked. Now, watermark ‘0’ and watermark ‘1’ are extracted from them. After that, subtract by one for values greater than previous peak value up to zero value bin.
The rest of the paper is organized as follows. There is overview of some prediction based reversible watermarking techniques in section II. The proposed algorithm is explained in detail in section III. In section IV, we provide our experimental results and comparison with some previous techniques. Conclusion and future scope is explained in section V.
II. PREDICTION BASED REVERSIBLE WATERMARKING
There are various methods of reversible watermarking using prediction error and they are based on the correlation of neighbourhood pixels for gray scale images. In Median Edge Detector (MED) method [5], the prediction value of a pixel P is calculated using its three neighbours as shown
P Q
R S
Fig. 1. Pixel neighborhood for MED
=
( , ) ≤ ( , )
( , ) ≥ ( , )
+ − ℎ
The prediction error E = P – is expanded by inserting message bit b and the watermarked prediction-error ‘ ’is given by
= 2 +
Range of pixel values in gray scale image is within 0 to 255, so embedding watermark in some pixels may cause overflow or underflow. To embed watermark into prediction error without causing underflow and overflow following condition must satisfy
+ = ≤254 ≥0
≥0 < 0
After embedding watermark into prediction error, the watermarked pixel intensity ‘ ’ is obtained using the following mathematical expression:
= +
At the detection side, first the location map is extracted and decompressed. Then, the watermarked bits are extracted along with the recovery of the cover image using following equations respectively.
= + 2
= − −
Fig. 2. Overview of prediction based reversible watermarking
III. PROPOSED REVERSIBLE WATERMARKING TECHNIQUE
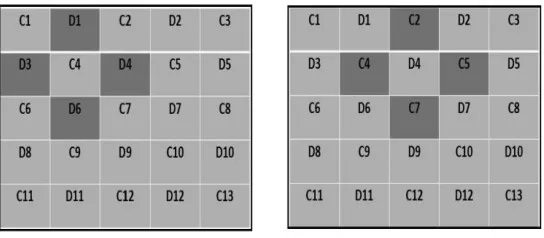
Median based Sorting and Prediction (MSAP):In proposed technique, median based predictor is used which depends on the correlation of neighborhood pixels in gray scale image. This predicted image does not have any effect on watermarking process. Predicted image is same at sending and receiving side. Prediction error is calculated and watermark is embedded within histogram of prediction error instead of expanding prediction error. The locations of Cross pixels and Dot pixels during embedding are as shown in figure 3.
Fig. 3. Location map for data embedding, C:Cross pixels, D: Dot pixels
Prediction of pixels:Gray scale value is predicted by calculating median of its adjacent pixel values. Pixel neighborhood is highly correlated so median of adjacent neighborhood gives good prediction. All pixels of the image are divided into two sets: the Cross set and Dot set. A pixel can be predicted from four neighboring pixels as shown in figure 3. Cross pixel C4 is predicted using four neighboring Dot pixels D1, D3, D4 and D 6. After embedding payload into Cross pixels, Dot pixels are predicted. Dot pixel D 4 is predicted using four neighboring Cross pixels C2, C4, C5 and C7. Median is calculated using following procedure:
1. If i<j<k, then median of {i,j,k} is j.
2. If i<j<k<l, then median of {i,j,k,l} is {(j + k) 2⁄ }
Hence median of n pixel values is {i,j,…,n} 1. If n is odd, then median is pixel value.
2. If n is even, then median is average of value and its next value.
Prediction value of pixel P(i,j) is
≈( , ) = ( ( , + 1), ( + 1, ), ( , −1), ( −1, ))
Prediction error: Prediction error is the difference between the original pixel value and predicted pixel value. Equation of prediction error is as follows:
= − ≈
Choice of pixels for embedding data:Those pixels with minimum local variance [9] are selected for watermarking. Local variance is calculated using neighboring pixels, same as for prediction. Local variance μ, for each cell can be
computed from the neighboring pixelsV, ,V ,,V, and V , as follows:
, = ∑ ( − )
Where, = , − , , = , − , , = , − , , = , − , and
=( + + + )
4
The values of local variance are remains unchanged during embedding and extraction process. Prediction errors are sorted according to ascending order of local variances of pixels. Pixels with smaller variance values are better for data hiding. Thus, the embedding process starts from the pixel with the smallest variance value.
Prediction error is then expanded to hide payload bits. . If prediction error is ‘2’ and binary equivalent of ‘2’ is ‘010’. After embedding payload bit ‘1’, it becomes ‘0101’ that is ‘5’.
= 2 +
Where is expanded prediction error, E is prediction error and b is the payload bit. After that the original pixel value P is changed to as
= +
Two threshold values T and T are defined by analyzing payload size. Tis the negative threshold value, and T is the positive threshold value. The predicted errors not belonging to [T , T ] are going to be shifted to make room for the expansion.Overflow and underflow condition is checked before expanding prediction error.
0≤ + ≤255
At detection side, Recovery of watermarked bit and cover image is as follows:
=
= +
Where, % sign represents mod operation.
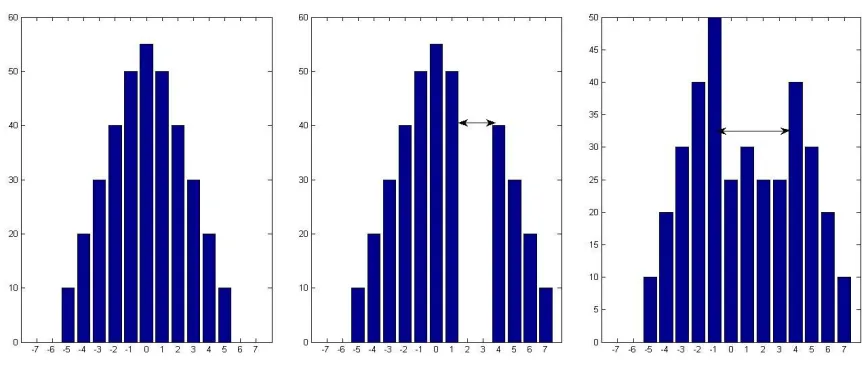
Fig. 4. Example of histogram shift method
Dynamic prediction error histogram shifting: Histogram of prediction error values consists positive as well as negative values so 2 thresholds are defined {K,-K}.K and –K values should be close to zero. K is for positive prediction error values and –K is for negative prediction error values. The values next to K and –K are shifted by {K+1} and {-K-1} respectively in histogram. For making space in prediction error histogram, K and -K value is added in original image. After that scan image sequentially and pixels which are within the range of chosen prediction error values are considered for inserting watermark.
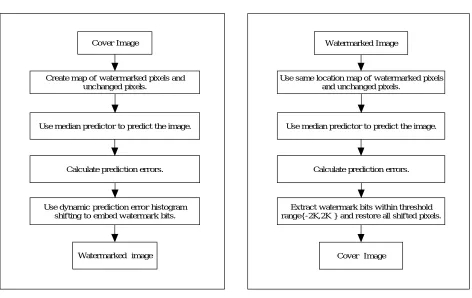
For inserting ‘0’, prediction error value within the threshold, pixel value remains same but for inserting ‘1’ prediction error value is added by K if it is a positive value and -K if it is a negative value. To achieve this K and -K values are added in original image. Flowchart of proposed embedding technique is as shown in figure 5.
For overflow and underflow, location map is created and compressed in bit stream. The compressed bit stream is put before payload while embedding.
Extraction of watermark:The same location map is used at detection side which is used at the time of sending. Using that locations as well as median predictor predicted image is calculated. This predicted image is same as that in sending side. {2K,-2K} thresholds are used for extraction of watermark.
Create map of watermarked pixels and unchanged pixels.
Cover Image
Calculate prediction errors. Use median predictor to predict the image.
Use dynamic prediction error histogram shifting to embed w atermark bits.
Watermarked image
Use same location map of watermarked pixels and unchanged pixels.
Watermarked Image
Calculate prediction errors. Use median predictor to predict the image.
Extract watermark bits within threshold range{-2K,2K } and restore all shifted pixels.
Cover Image
Fig. 5. Flowchart of proposed embedding and Extraction technique
IV.EXPERIMENTAL RESULTS AND DISCUSSION
Performance evaluation of reversible watermarking:The peak signal-to-noise ratio (PSNR) is used to measure the distortion between the host image and the watermarked image.
= 10 (255 )
Where MSE is the mean squared error between watermarked image and host image.
=
∑
,, ,( ( , )
−
( , ) )
)
Where N and M are number of rows and columns of host image. I and are host image and watermarked image. The embedding or payload size is measured as the number of payload bits embedded per pixel of host image which is called as Bit per pixel(BPP).
Experimental results: The proposed technique was implemented in MATLAB. Test images of size 512×512 are used to check performance. The standard test images Lena, Baboon, Airplane and Barbara are used. Test images are shown in figure 6.
Fig. 6. Test images i) Lena ii) Baboon iii) Airplane iv) Barbara
Embedding Capacity verses PSNR Comparison for Lena, Baboon and Airplane and Barbara test images using median based SAP are shown in figure 7.Airplane test image is showing better results than other test images. In Airplane image co-relation between neighbourhood pixel is high, so it gives good prediction. Good predicted image gives small prediction errors with less variation. Large amount of small prediction error increases PSNR values and embedding capacity as well. However in Baboon test image, co-relation between neighbourhood pixel is very less so it is giving less PSNR and has less emb edding capacity.
Results obtained for Lena test image (512×512) using MSAP are shown below in Table I.
Bit per pixel (BPP)
Payload bits PSNR (dB)
0.05 13107 56.2166 0.1 26214 53.7628 0.15 39322 51.8145 0.2 52429 50.3663 0.3 78643 46.5933 0.4 104858 44.7176
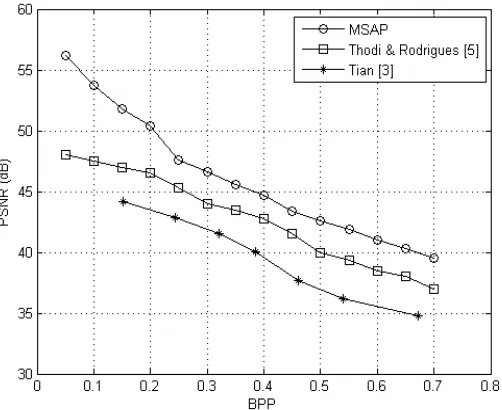
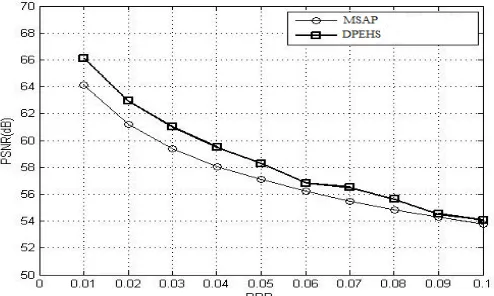
MSAP technique is compared with other methods. Figure 8 shows comparison with other methods for Lena test image. Tian [3] used difference expansion method to hide dataand Thodi& Rodrigues [5] used Median edge detector for prediction and expansion of prediction error to hide data. Combination of good predictor and expansion of prediction error with sorting technique certainly gives better results in MSAP.
Fig. 8. Embedded capacity vs PSNR (dB)
Fig. 9. Embedded capacity vs PSNR (dB) for Lena test image
V. CONCLUSION
In this paper, we used median based predictor, Expansion of prediction error and dynamic prediction error histogram shifting on standard images Lena, baboon, Airplane, Barbara which are gray scale images and having dimensions 512×512. Median based predictor uses spatial correlation of neighbourhood pixels to predict the pixel value. Dynamic prediction error histogram shifting is effective for small prediction error values. Our method achieves less distortion with minimum computations. Our method achieves up to 0.1 bit per pixel embedding capacity. DPEHS improved PSNR for MSAP.
REFERENCES
1. Naskar, R.; Chakraborty, R.S., "Reversible watermarking utilising weighted median-based prediction," Image Processing, IET , vol.6, no.5, pp.507,520, July 2012
2. Coatrieux, G.; Wei Pan; Cuppens-Boulahia, N.; Cuppens, F.; Roux, C., "Reversible Watermarking Based on Invariant Image Classification and Dynamic Histogram Shifting," Information Forensics and Security, IEEE Transactions on , vol.8, no.1, pp.111,120, Jan. 2013
3. Tian, J.: ‘Reversible data embedding using a difference expansion’, IEEE Trans. Circuits Syst. Video Technol., 2003, 13, (8), pp. 890–896
4. Tian, J.: ‘Reversible watermarking by difference expansion’. Proc.Workshop on Multimedia and Security, December 2002, pp. 19–22
5. D. M. Thodi and J. J. Rodriquez, “Expansion embedding techniques forreversible watermarking,” IEEE Trans. Image Process. , vol. 16, no. 3, pp. 721–730, Mar. 2007.
6. L. Luo, Z. Chen, M. Chen, X. Zeng, and Z. Xiong, “Reversible image watermarking using interpolation technique,” IEEE Trans. Inf. Forensics Security, vol. 5, no. 1, pp. 187–193, Mar. 2010.
7. Z. Ni, Y. Q. Shi, N. Ansari, and S. Wei, “Reversible data hiding,” IEEETrans. Circuits Syst. Video Technol., vol. 16, no. 3, pp. 354–362, Mar.2006.
8. Celik, M.U., Sharma, G., Tekalp, A.M., Saber, E.: ‘Lossless generalized-LSB data embedding’, IEEE Trans. Image Process., 2005, 14, (2), pp. 253-266.
9. SACHNEV,H.J.KIM,J.NAM,S.SURESH, AND Y.-Q.SHI,“REVERSIBLEWATERMARKING ALGORITHM USING SORTING
AND PREDICTION,”IEEETRANS.CIRCUIT SYST.VIDEO TECHNOL., VOL.19, NO.7, PP.989–999,JUL.2009. BIOGRAPHY
Sunil N Koreis an Associate Professor in the Electronics Engineering Department, Walchand College of Engineering, Sangli, Maharashtra, India. He received Master of Electronics Engineering (M.E. - ELN) degree in a year 1992 from Shivaji University, Kolhapur, MS, India. His research interests are Computer Networks; Signal Processing and Algorithms, etc.