| INVESTIGATION
A High-Resolution Map of Meiotic Recombination in
Cryptococcus deneoformans
Demonstrates Decreased
Recombination in Unisexual Reproduction
Cullen Roth,*,†Sheng Sun,‡R. Blake Billmyre,†,‡Joseph Heitman,‡and Paul M. Magwene*,1 *Department of Biology and†University Program in Genetics and Genomics, Duke University, Durham, North Carolina 27708 and
‡Department of Molecular Genetics and Microbiology, Duke University Medical Center, Durham, North Carolina 27710
ORCID IDs: 0000-0003-4934-6160 (C.R.); 0000-0002-7659-2589 (P.M.M.)
ABSTRACTMultiple species within the basidiomycete genusCryptococcuscause cryptococcal disease. These species are estimated to affect nearly a quarter of a million people leading to 180,000 mortalities, annually. Sexual reproduction, which can occur between haploid yeasts of the same or opposite mating type, is a potentially important contributor to pathogenesis as re-combination can generate novel genotypes and transgressive phenotypes. However, our quantitative understanding of recom-bination in this clinically important yeast is limited. Here, we describe genome-wide estimates of recomrecom-bination rates in Cryptococcus deneoformans and compare recombination between progeny froma–aunisexual and a–abisexual crosses. We
find that offspring from bisexual crosses have modestly higher average rates of recombination than those derived from unisexual crosses. Recombination hot and cold spots across the C. deneoformans genome are also identified and are associated with increased GC content. Finally, we observed regions genome-wide with allele frequencies deviating from the expected parental ratio. Thesefindings and observations advance our quantitative understanding of the genetic events that occur during sexual reproduction in C. deneoformans, and the impact that different forms of sexual reproduction are likely to have on genetic diversity in this important fungal pathogen.
KEYWORDSunisexual reproduction; whole-genome sequencing; genome-wide recombination map; crossover hot spots; allele segregation distortion
A
NNUALLY, cryptococcal disease is estimated to affect. 200,000 people worldwide, accounting for 15% of AIDS-related mortalities (Rajasingham et al. 2017). While Cryptococcus species are preferentially haploid (Hull et al. 2002) and propagate primarily asexually, sexual reproduc-tion and recombinareproduc-tion have been demonstrated in both the laboratory and environment (Kwon-Chung 1975, 1976; Hullet al.2002; Litvintsevaet al.2003; Linet al.2007). The sexual cycle inCryptococcushas clinical relevance as sexual reproduction produces spores that are readily aerosolizedand inhaled by hosts, serving as infectious propagules (Giles et al.2009; Velagapudiet al.2009; Coelhoet al.2014). Fur-thermore, recombination during sex produces new genotypes, some of which may display novel phenotypes linked to viru-lence, such as the ability of offspring to grow at higher tem-peratures than that of their parental strains (Sunet al.2014). Thus, quantitatively characterizing recombination in Crypto-coccusis a key step to developing a better understanding of the genetics of virulence in this clade.
Cryptococcus deneoformans [formerly C. neoformansvar. neoformans, serotype D; see Hagen et al. (2015), Kwon-Chunget al.(2017), and Hagenet al.(2017) for recent dis-cussions of nomenclature] possesses a bipolar mating system with the mating-type locus (MAT) on chromosome 4. The MATlocus, which is.100 kb in size and contains.20 genes, is represented in two mating-type alleles,aanda(Heitman et al.1999; Lengeleret al.2002; Loftuset al.2005; Sun and Heitman 2016). In the laboratory setting, sexual reproduc-tion has been observed between haploid MATa andMATa Copyright © 2018 by the Genetics Society of America
doi:https://doi.org/10.1534/genetics.118.300996
Manuscript received December 15, 2017; accepted for publication April 5, 2018; published Early Online April 6, 2018.
Available freely online through the author-supported open access option.
Supplemental material available at Figshare: https://doi.org/10.25386/genetics. 6083315.
strains (Kwon-Chung 1976; Hullet al.2002; Nielsen et al. 2007; Xueet al.2007; Sunet al.2014; Gyawaliet al.2017). Diploid strains and signatures of recombination have been documented in environmental isolates, indicating that sexual reproduction also occurs in nature (Litvintseva et al.2003; Campbellet al.2005; Linet al.2007, 2009; Buiet al.2008). However, an analysis of environmental and clinical isolates of Cryptococcusspecies revealed a bias in the distribution of the mating-type alleles, with the majority of C. deneoformans isolates analyzed possessing theMATaallele (Kwon-Chung and Bennett 1978). This observation called into question the frequency and importance of bisexual reproduction, and thus recombination, in the wild. Lin et al. (2009) provided an answer to this conundrum with the discovery thatC. deneo-formansis also capable of undergoing same-sex or unisexual matings betweenMATastrains (Linet al.2005, 2007, 2009). Meiosis is an integral component of sexual reproduction (Page and Hawley 2003) that occurs in both unisexual and bisexual reproduction (Linet al.2005; Feretzaki and Heitman 2013). Within a basidium, meiosis produces nuclei that will undergo several rounds of mitosis to generate subsequent nuclei that are packaged into spores (Kwon-Chung 1980). These basidiospores then bud from the basidium in four long chains (Kwon-Chung 1980; Idnurm 2010). Dissection of basidio-spore chains and analysis of their genotypes shows segregation of alleles consistent with one round of meiosis, and demonstrates that postmeiotic nuclei undergo mitosis and randomly assort into different spore chains (Kwon-Chung 1980; Idnurm 2010).
Various studies have examined recombination rates in Cryptococcusspecies, as well as other phenomena that occur during meiosis, such as crossover hot spots, gene conversions, and allele segregation distortion (Forcheet al.2000; Marra et al.2004; Hsuehet al.2006; Sun and Xu 2007; Sunet al. 2014; Sun and Heitman 2016). Genome-wide, our quantita-tive understanding of recombination is limited to a few stud-ies ofC. deneoformanscrosses (Forcheet al.2000; Marraet al. 2004) and hybrid crosses between C. deneoformans and C. neoformansstrains (Sun and Xu 2007). Current estimates of recombination rates forC. deneoformansare based on link-age maps constructed via a modest number of genetic markers, with estimates varying between 13.2 kb/cM (Marra et al. 2004) and 7.13 kb/cM (Sunet al.2014).
Sunet al.(2014) described thefirst quantitative analysis of recombination resulting from unisexual reproduction in Cryptococcus. They generated several hundred progeny de-rived froma–aunisexual anda–abisexual matings between C. deneoformans strain backgrounds XL280 (XL280a and XL280aSS) and 431a. Based on 42 markers along chromo-some 4, they observed no significant difference in recombi-nation rates between segregants derived from unisexualvs. bisexual reproduction. Across both sets of progeny from the unisexual and bisexual crosses, large regions along chromo-some 4 were observed with biased or distorted allele frequen-cies, deviating from the expected 2:2 parental ratio. While gene conversions could explain some of these anomalies in allelic ratios, most of the conversion tracks were too large to have been
generated solely by gene conversion, and the authors hypothe-sized that such regions were due to mitotic recombination-induced loss-of-heterozygosity prior to meiosis (Sunet al.2014). In the present study, we utilize progeny from Sunet al. (2014) and whole-genome sequencing data to quantitatively analyze differences in genome-wide recombination rates be-tween progeny from unisexual and bisexual reproduction, to identify recombination hot and cold spots and to identify chromosomal regions that exhibit biased or distorted allele frequencies. Wefind genome-wide differences in the average rates of recombination between progeny froma–aunisexual anda–abisexual crosses, with higher rates of crossovers in samples froma–abisexual crosses. Recombination hot and cold spots are identified, with hot spots associated with higher than average GC content and cold spots clustering near centromeres. Centromeric cold spots are oftenflanked by areas of increased crossover activity. Finally, we show that re-gions with allele frequencies deviating from the expected 2:2 parental allele ratio are not unique to chromosome 4 and are seen genome-wide. The high-resolution characterization of pat-terns and rates of recombination that this study provides helps to advance our understanding of the processes that generate genetic diversity in this fungus, and will serve as a foundation for future investigations of the population and quantitative ge-netics ofC. deneoformansand relatedCryptococcusspecies.
Materials and Methods
Strains, laboratory crosses, and isolation
Progenitor strains: As previously described (Sun et al. 2014), parental strains 431a, XL280aSS, and XL280awere used ina–aunisexual anda–abisexual mating. Progenitor strain 431a is a natural C. deneoformans isolate with the MATa allele (Sun et al. 2012, 2014). XL280aSS is an XL280a strain with an inserted NAT resistance marker in theURA5gene. Analysis of sequenced reads of progeny from thea–aunisexual crosses confirmed the insertion site of theNAT resistance marker within theURA5gene of XL280aSS. XL280aSS is congenic to XL280a, with the exceptions of theURA5gene, the NATresistance marker, theMATlocus, and a partial duplication of the left arm of chromosome 10 (Zhaiet al.2013; Sunet al.2014).
Laboratory crosses and isolation:As described in Sunet al. (2014), parental strains were mixed then spotted onto V8 media (pH = 5) and incubated at room temperature, in the dark, for approximately 1 week until abundant hyphae, basi-dia, and basidiospore chains were visible under a microscope (Sunet al.2014). Fora–abisexual crosses between strains XL280aand 431a, chains of basidiospores from individual basidia were transferred onto fresh YPD medium and indi-vidual basidiospores were separated using afiber optic nee-dle. In total, 261 basidiospores were isolated from 27 basidia (Sunet al.2014).
spots were extracted and suspended in PBS. This suspension was then diluted and spread onto synthetic defined-uracil plates to screen forURA5progeny (Sunet al.2014). These URA5progeny were transferred to plates with YPD + Nata-mycin (NAT) media and further screened forNATresistance. Finally, 156 (NATRURA5) progeny, representing crossover/ fusion of the parental markers, were retained (Sun et al. 2014). Segregants were maintained in 35% glycerol frozen stocks (280°) and subcultured from freezer stock to YPD solid media for study.
Sequencing, aligning, variant calling, andfiltering
From thea–aunisexual anda–abisexual crosses conducted in Sunet al.(2014), 105 segregants (63 froma–aunisexual matings and 42 from a–a bisexual matings) were initially isolated for whole-genome sequencing. Sequencing was per-formed on the Illumina Hisequation 2500 platform in the Next Generation Sequencing Facility at the University of North Carolina, Chapel Hill. A paired-end library with 300 base inserts was constructed for each sample and li-braries were multiplexed, running 24 samples per lane using 100-bp paired-end reads. Raw reads were aligned to an XL280C. deneoformansreference genome (Zhaiet al.2013; Sun et al. 2014) using BWA (v0.7.10-r789, Li and Durbin 2009). Variant calling was carried out using The Genome Analysis Toolkit (v3.1-1, McKennaet al.2010) and SAMtools (v1.2, Li 2011), resulting in 139,469 variable sites across the 105 segregants. These sites were scored as 0 or 1 if inherited from the XL280aSS (or XL280a) or 431a parental strains, respectively. Variable sites werefiltered on read depth and quality. Across segregants, variable sites were required to have.153coverage, a quality score, normalized by read depth, of$20, and a minor allele frequency per site of$1%. Only sites with 100% call rate were used in analysis. Variant calls were further filtered to include only sites exhibiting biallelic single-nucleotide polymorphisms (SNPs), yielding afinal total of 86,767 sites.
Segregantfiltering
Read count data for each SNP site was used to screen each of the initial 105 segregants for gross aneuploidy of chromo-somes. In total, six segregants were removed due to partial or complete aneuploidy. Aneuploidy of chromosome 1 was de-tected in three segregants, a duplication of the right arm of chromosome 7 in one segregant, and aneuploidy of chromo-some 10 in two segregants. For all samples, pairwise genetic correlations were calculated to identify pairs of segregants that were genetically identical. These duplicates were re-moved from analysis to avoid biasing estimates of recombi-nation by sampling a genotype more than once. In total, four pairs of segregants from thea–aunisexual crosses were iden-tified as genetically identical. From each of the four pairs of segregants, one was removed from analysis. One segregant from thea–abisexual cross, SSB593, showed no recombina-tion across its genome and inheritance of all chromosomes, except chromosome 7, from the XL280aparental strain. This
segregant was removed from further analysis. After passing thesefiltering criteria, 94 segregants, 55 froma–aunisexual crosses and 39 froma–abisexual crosses, were retained for analysis.
Haplotype construction andfiltering
For each sample, SNP data were used to estimate regions with consecutive SNPs inherited from one parent (i.e., haplotypes) between XL280a, XL280aSS, and 431a. A “minimum”run approach based on intermarker intervals was used to deter-mine the size of haplotypes (Manceraet al.2008). Briefly, for a set of SNPs within a haplotype with positionsv0;v1;. . .vn along a chromosome, the size of the haplotype in nucleotide bases or length of the intramarker interval is calculated as h¼vn2v0þ1:The intermarker interval is defined as the
distance between two SNPs with opposing genotypes (Mancera et al.2008). Letv;wbe the positions of two adjacent SNPs along a chromosome with opposing genotypes, then the distance in nucleotide bases between the two SNPs is calcu-lated asd¼w2v21:For each sample, SNP data were used to construct haplotype blocks, where runs of contiguous SNPs with shared genotypes are grouped. For the results shown here, haplotypes were retained if the size of the hap-lotype or intramarker interval was$6 kb.
Crossover frequency estimation
Poisson regression: Haplotype data for each segregant was used to calculate the number of crossovers. For any given segregant with n haplotypes there are n21 crossovers. Across all segregants, a region 10 kb in size, centered on theURA5locus (chromosome 7), was masked from analysis to account for the insertion of the NATmarker in the pro-genitor strain XL280aSS, used in thea–aunisexual crosses. Genome-wide recombination rates were estimated using Poisson regression, modeling the number of crossovers as a function of chromosome length with the mode of sexual re-production as a covariate using the ‟glm”function imple-mented in R (version 3.4.1). Our analysis indicated no support for an interaction term between chromosome length and mode of sexual reproduction; we thereforefit a simple additive model of the form logðEð# of crossoversjxÞÞ ¼
b0þb1Icþb2x;wherexis chromosome length andIcis an indicator variable for the cross type (0 =a–aunisexual and 1 = a–abisexual crosses).
The model was estimated as: logðEð# of crossoversjxÞÞ ¼ 20:06þ0:30Icþ0:58x: The model fit failed to reject the null hypothesis of a zero intercept term (B0) but there was
strong support to reject the null hypothesis of zero-valuedb1
andb2coefficients (P-values ,10210).
Holm–Sidak step-down method to correct for multiple test-ing (Holm 1979).
Recapitulation of previous results:Across progeny from the a–aunisexual anda–abisexual crosses, SNPs were selected to approximate original marker locations along chromosome 4 from Sunet al.(2014). This was done by reducing the set of SNPs to those with positions#1 kb away from the previously utilized marker locations (Sun et al. 2014). This yielded 42 and 17 SNPs for the segregants froma–aunisexual and a–abisexual crosses, respectively, similar to the size of the original marker sets used by Sun et al.(2014). These data were then used to reconstruct haplotypes as described above and to calculate crossover events.
Crossover hot and cold spot discovery and analysis
Statistical association testing:For each chromosome, con-tiguous bins of varying size were used to tile each chromosome from the edges of the centromeres out to the ends of the chromosome (centromeric regions were excluded from hot/ cold spot analysis). After investigating the total detected number of hot and cold crossover spots as a function of bin size (from 0.5 to 100 kb), a bin size of 41.5 kb was chosen because it minimized the difference between the detected number of crossover hot and cold spots (Supplemental Ma-terial, Figure S9). The outermost 59and 39bins of each chro-mosome were constructed to have at least half of their width overlap the last two annotated SNPs on the respective end of that chromosome. Within each bin, the number of inter-marker intervals in which a crossover was detected were counted. For each intermarker interval, crossovers shared by meiotic siblings were only counted once. For every bin, a Poisson model, with parameters established from genome-wide analysis of crossover frequencies of meiotic progeny from thea–abisexual crosses, was utilized to compare the number of crossovers observed vs. the number expected given the bin size. A two-tailed test was used to search for statistically cold and hot crossover spots. A false discovery rate (FDR) approach (Benjamini and Yekutieli 2001) was used to define genome-wide, significantly hot or cold cross-over spots, using an FDR cutoff of 0.05. An“artificial”hot spot on chromosome 7, resulting from the use of selectable markers to isolate recombinant progeny from the a–a uni-sexual crosses (Sun et al. 2014), was removed from the analysis.
Analysis of GC content: For each intermarker interval, nu-cleotide sequences were obtained from the XL280 reference genome (Zhaiet al.2013). The GC content for all intermarker intervals was calculated and classified as hot, cold, or other according to whether the interval fell within a hot or cold region, as defined above. In total, there were 7558 hot marker interval sequences, 7369 cold spot intermarker inter-val sequences, and 68,051 interinter-vals defined as other. The GC content for intermarker intervals within hot and cold spots was compared using a two-sided, Mann–Whitney U-test
(a¼0:05). For the three groups of intermarker interval se-quences, 95% C.I.s were calculated via permutation (sam-pling with replacement), taking the difference between the observed mean GC content and the sampled mean, 1000 times. From these deviations, the 2.5 and 97.5% per-centiles of the permuted distribution were used as critical values.
Identification of motifs associated with crossover hot spot sequences:To search for sequence motifs associated with hot spots, 100 random sequences from hot spot intermarker intervals in which there was a crossover where chosen, such that the lengths of sequences ranged between 100 and 10,000 bases and the sum of the sequences was,60 kb. A comple-mentary control set of 100 randomly chosen sequences was selected from other genomic regions using the same param-eters. The hot and control sets of sequences where analyzed using the MEME software suite, version 4.12.0 (Bailey and Elkan 1994). Analysis in MEME was conducted using dis-criminative mode, with zero or one occurrence of a contrib-uting motif site per sequence, searching for four motifs between 6 and 50 bases wide.
Analysis of allele distortion and bias
Segregants used in haplotype analysis: From thea–a bi-sexual cross, 22 of the 39 segregants were grouped by ba-sidium, representing five unique basidia. Basidia groups where chosen for analysis if they contained three or more segregants with unique genotypes. Of the five basidia groups, two consisted of three segregants, two with four segregants, and one basidium exhibited eight unique genotypes.
Analysis of regions with distorted allele frequencies: The allele frequency of regions across segregants germinated from the same basidium was analyzed. Specifically, deviations from the expected 2:2 parental allele ratio where quantified. Re-gions were removed from consideration if only a single SNP supported the observation or if the size of the region was only one base in width. An ANOVA was used to examine average differences in sizes of regions with distorted allele frequencies across the genome. A log-linear model was used to investigate the average number of regions as a function of chromosome size (a¼0:05).
Data availability
Raw sequence reads generated from samples utilized in this study are available on the National Center for Biotechnology Information’s sequence read archive under Bio-Project iden-tification number PRJNA420966, with individual accession numbers SAMN08130857–SAMN08130963. The generated variant callfile from the aligned sequenced reads are publicly avail-able on the GitHub repository (https://github.com/magwenelab/ crypto-recombination-paper). Supplemental material avail-able at Figshare:https://doi.org/10.25386/genetics.6083315.
Results
High-density SNP data allowsfine mapping of genome-wide crossovers
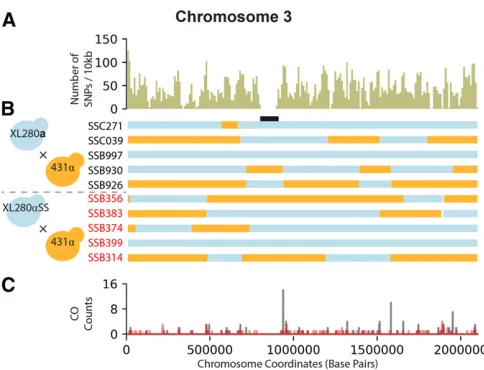
Whole-genome sequencing data were obtained for 55 segre-gants from a–aunisexual crosses between parental strains XL280aSS and 431a, and 39 segregants froma–abisexual crosses between the parental strains XL280aand 431a(Sun et al. 2014). Variants were called for each segregant (see Materials and Methods) and 86,767 biallelic SNPs between the parental strains were used as genetic markers. Across the 19-Mb genome, comprised of 14 chromosomes, the median distance between consecutive SNPs (intermarker interval) was 87 bases with only 0.5% of the 86,753 intermarker in-tervals larger than 2 kb (Figure S1). SNP data were used to infer haplotypes and crossover events per segregant (Figure 1). In total, 3240 crossovers were detected.
In each set of progeny from thea–aunisexual anda–a bisexual crosses, several segregants were identified as having at least one nonexchange chromosome. In 35 of 55 (64%) progeny from thea–aunisexual crosses and 19 of 39 (49%) progeny from thea–abisexual crosses, at least one chromo-some was nonrecombinant based on filtered SNP data and inferred haplotypes. There is no difference in the distribu-tions of numbers of nonexchange chromosomes per segre-gant across the two cross types (Kolmogorov–Smirnov-test, P-value .0:05). For these progeny, the median number of nonexchange chromosomes per segregant is between one
andfive. Smaller chromosomes are more likely to have zero
crossovers. Of the 59 nonexchange chromosomes in the 35 progeny from the unisexual crosses, 32 (54%) have the parental XL280aSS genotype. However, in the 37 nonex-change chromosomes among the 19 progeny from the bisex-ual crosses, 29 (78%) have the XL280aparental copy.
Genome-wide recombination rates differ between unisexual and bisexual reproduction in C. deneoformans
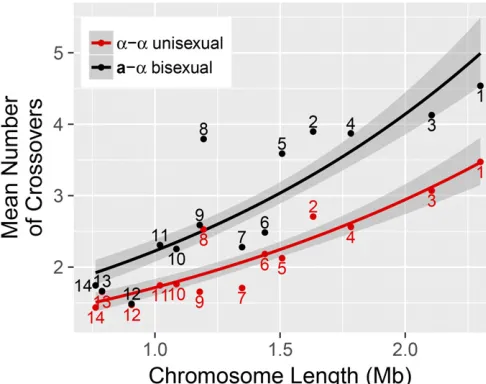
Genome-wide recombination rates were estimated using Poisson regression, modeling the number of crossovers as a function of chromosome length with the mode of sexual reproduction as a covariate (seeMaterials and Methods). This model predicts an obligatory0.94 crossovers per chromo-some for offspring from the unisexual crosses and 1.27 crossovers per chromosome for offspring from the bisexual
cross. There is a significant difference in the expected number of crossovers between segregants froma–aunisexual and a–abisexual crosses (P-value ,10210). The expected
num-ber of crossovers is predicted to increase by a ratio of1.79 per Mb increase in chromosome size (Figure 2). Based on the sum of the per chromosome average and the total genome length, we estimate an approximate physical–genetic dis-tance of 6.33 kb/cM for the a–a unisexual crosses and 4.69 kb/cM for the a–abisexual crosses.
To explore this difference in greater detail, we compared recombination rates by chromosome for the two types of crosses. For chromosomes 1–5, 8, and 9 there are significant differences (Mann–Whitney U-test, FDR , 0.042) in the average number of detected crossovers between the progeny from thea–aunisexual and a–abisexual crosses. No signif-icant difference in the average number of crossovers between the two cross types was detected on chromosomes 6, 7, and 10–14 (Figure S2).
Our finding that recombination rates differ in offspring
Analysis of crossover hot spots for segregants froma–a unisexual and a–abisexual crosses in C. deneoformans
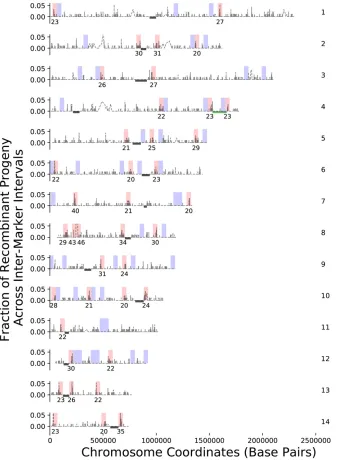
To identify regions of high- and low-crossover activity or crossover hot and cold spots (Petes 2001) along each chro-mosome, a binning approach was used. Bins of size 41.5 kb were tiled across each chromosome and the number of cross-overs detected within each bin was counted. The bin size of 41.5 kb was chosen based on simulations, so as to minimize the difference in the total number of hot and cold spots (Fig-ure S9). A Poisson model with this bin size and the expected genome-wide average crossover rate per segregant, as esti-mated from the observed data (seeMaterials and Methods), was used in two-tailed tests to examine each bin for signifi-cantly high- (hot) or low- (cold) crossover rates. An FDR procedure was used to establish genome-wide significance (a¼0:025;FDR , 0.014) (Benjamini and Yekutieli 2001). This analysis revealed 39 hot spots, bins with 20 or more de-tected crossovers, and 44 cold spots, bins with zero dede-tected crossovers (Figure 3). Along every chromosome, at least one crossover hot spot was identified and these regions were often foundflanking or near centromeres.
Previous studies have demonstrated an association be-tween recombination hot and cold spots and GC content (Sunet al.2012; Sun and Heitman 2016). For 7558 inter-marker interval sequences within the 39 hot spots, the mean GC content was 0.49 (95% C.I.: 0.489, 0.494), while the mean GC content for 7369 intermarker interval sequences contained within the 44 cold spots was0.475 (95% C.I.: 0.473, 0.477). The mean GC content of hot spots differs significantly from the cold spots (Mann–Whitney U-test, P-value ,10235;Figure S4). Both of these differ from the
reported genome-wide average GC content (0.486) and the mean (0.483, 95% C.I.: 0.482, 0.484) of the other 68,051 intermarker interval sequences not associated with hot or cold spots (Sunet al.2012). Of the 7558 intermarker interval sequences within identified hot spots, 584 detect a genotype change (i.e., the approximate sites of double-strand breaks), and of these intermarker interval sequences 64.4% over-lapped with intergenic regions when compared to the anno-tated reference strain, JEC21 (Loftuset al.2005).
From the set of 584 intermarker interval sequences asso-ciated with hot spots and in which a crossover occurs, 100 random sequences were analyzed using MEME to identify sequence motifs associated with crossover hot spots. These sequences were compared to a control set of sequences selected in a similar fashion from other genomic regions. A poly(G) motif that is 29 bases long was identified in all of the 100 hot spot-associated sequences (E-value ,10270;
Figure S5).
Allele bias and allele distortion seen in segregants generated via bisexual reproduction in C. deneoformans
Separately for the 55 segregants from the a–a unisexual crosses and 39 segregants from the a–abisexual crosses, a binomial model was used to identify chromosomal regions with bias toward one parental allele, using a null model of equal likelihood of inheriting either of the parental alleles (P= 0.5). The allele frequencies across SNP sites in segre-gants from thea–aunisexual cross do not show evidence of bias toward either parental allele that reaches genome-wide significance. Across the 39 progeny froma–abisexual crosses,five regions show evidence of biased allele inheri-tance toward the XL280aallele (FDR ,0:016). These re-gions are located on chromosomes 1, 2, 4, 6, and 12, with lengths of364, 260, 303, 41, and 60 kb, respectively (Fig-ure S6).
Allelic inheritance patterns within basidia were then ex-amined for segregants from the a–abisexual cross. Of the 39 progeny from thea–abisexual crosses, 22 may be grouped by basidia of dissection. This grouping method generatesfive groups for analysis with three (N¼2), four (N¼2), and eight (N¼1) segregants, all with unique genotypes (Figure 4). Using these segregants, 197 regions were identified across the genome with allelic ratios deviating from the expected parental ratio of 2:2 (allelic distortion). The size of these regions with allelic distortion ranged from a minimum of six bases to a maximum of 1.4 Mb (Figure S7A). The average size of regions exhibiting allelic distortion does not differ signif-icantly across chromosomes (ANOVA, P-value = 0.092). The locations of regions exhibiting allelic distortion are often similar across basidia (Figure 4). Of the 197 allelic distortions, 83 were identified from basidia III, IV, and V, with allele ratios consistent with possible gene conversions.
Across the 197 regions with distorted parental allele fre-quencies, the direction of bias was examined. Along chromo-some 12, 11 regions with distorted allele frequencies were identified, and 10 of these retain the XL280aallele. However, Figure 2 Unisexualvs.bisexual crossovers as a function of chromosome
genome-wide, no evidence of consistent bias toward either parental genotype was observed (Figure S7B).
The average number of regions with distorted allele fre-quencies across the genome was established as a function of chromosome size for our 22 segregants, representing five unique basidia from thea–abisexual crosses (Figure S8). A log-linear model provides evidence supporting a signifi-cant association between chromosome size and the average number of regions with distorted allele frequencies (P-value
,1025).
Unique patterns of allele segregation
Two groups of segregants from thea–abisexual crosses rep-resenting two unique basidia showed interesting patterns of allele segregation. Thefirst group of samples dissected from
one basidium was comprised of eight spores and analysis of their recombinant haplotypes indicates that all eight samples are genetically unique (for example see Figure 4, basidium IV). This observation deviates from the expected four unique gametes expected to result from meiosis (Kwon-Chung 1980; Page and Hawley 2003; Idnurm et al. 2005). The second basidium showing interesting allele segregation was com-posed of four segregants. These four samples are all recombi-nant and were previously thought to be genetically unique, as indicated by marker genotypes along chromosome 4 (Sun et al. 2014). However, our reanalysis indicates that two of the four segregants are nearly genetically identical; chromo-some 4 is the only distinct chromochromo-some differentiating the two samples, which are identical along the other 13 chromo-somes, including a duplication of chromosome 10.
Figure 3 Genome-wide crossover hot and cold spots. In gray, the fraction of recombi-nant progeny between intermarker intervals (y-axis) for segregants from thea–a unisex-ual anda–abisexual crosses along each of the 14 chromosomes (indicated by number to the right). Crossovers occur within an intermarker interval and are detected as a change in genotype between consecutive SNPs. Bins, 41.5 kb in size, were used to segment each chromosome. For bins
Discussion
C. deneoformansis capable of sexual reproduction between strains of the opposite and the same mating types. In this study, we document higher rates of recombination in off-spring generated from bisexual crosses, which is surprising, given our previous results in Sunet al.(2014). Progeny from the bisexual cross are predicted to have a basal rate of1.27 crossovers per chromosomevs.0.94 crossovers per chromo-some for progeny in the unisexual cross. For both sets of progeny, the number of crossovers is predicted to increase by a ratio of1.79 per Mb increase in chromosome size. Of the 14 chromosomes in theC. deneoformansgenome, seven show differences in the average number of crossovers per segregant when comparing samples froma–abisexual and a–aunisexual crosses. Converting these crossover rates, we estimate an approximate physical–genetic distance of6.33 and 4.69 kb/cM for thea–aunisexual and a–abisexual crosses, respectively. These estimates are nearly three times lower than the estimated crossover rate of Saccharomyces cerevisiae (2 kb/cM; Cherry et al. 1997; Barton et al. 2008) and far higher than the crossover rates estimated for Drosophila melanogaster (100 kb/cM; Comeron et al. 2012), Arabidopsis thaliana (278 kb/cM; Salomé et al. 2012), andHomo sapiens(840 kb/cM; Konget al.2002).
Our results differ from previous estimates because they are based on information from the entire C. deneoformans ge-nome and utilize.200-fold higher density of markers than has been employed in any previous study of recombination in C. deneoformans(Forcheet al.2000; Marraet al.2004; Sun et al.2014). For example, relative to the earlier study of Sun et al. (2014), which utilized the same set of offspring, we detected differences in the average number of crossovers along chromosome 4 between progeny froma–aunisexual
anda–abisexual crosses. Our analysis shows that this differ-ence is due to an increase in the detected number of cross-overs resulting from greater marker density, which facilitates the detection of genotype changes previously masked by double-crossover events.
The regression model used to relate chromosome length and the number of crossovers predicts nearly one obligate crossover on average per chromosome for both sets of progeny from the a–aunisexual and a–a bisexual crosses (see Re-sults). A significant number of segregants had chromosomes that had zero detected crossovers (nonexchange chromo-somes), but analysis of segregants from basidia groups sug-gests that the standard model of crossover assurance holds (i.e., there is at least one crossover per homologous chro-mosome pair per meiosis; Ault and Nicklas 1989). The non-exchange chromosomes we observed may thus be due to Holiday junctions resolving into noncrossover events during chromosome disjunction or may reflect chromatids that were not involved in crossovers during meiosis.
2004; Hsuehet al.2006; Sunet al.2012; Sun and Heitman 2016). While recombination hot spotsflank theMATlocus, theMATlocus itself contains a crossover cold spot, consistent with previousfindings (Lengeleret al.2002; Sunet al.2014). Parallel to the pattern observed at theMATlocus, we noted a tendency for crossover hot spots toflank or surround centro-meric regions and crossover cold spots. Some caution is re-quired in interpreting the total number of hot and cold spots, and their precise locations. Due to the SNP and haplotype-filtering criteria we employed, some genomic regions such as centromeres and telomeres are excluded from analysis. Thus, we are unable to access recombination or gene conver-sion events that could have taken place within centromeric regions, as suggested in previous studies of Cryptococcus (Janbonet al.2014; Sunet al.2017) and other fungal species such asCandida albicans(Thakur and Sanyal 2013). The pre-cise location of inferred hot and cold spots is also a function of the choice of bin widths and starting coordinates.
In addition to providing genome-wide information on crossover hot and cold spots, our analysis identified numerous regions that have allele ratios that deviate from the expected 2:2 parental ratio in progeny from thea–abisexual crosses, consistent with and extending the findings of Sun et al. (2014) for chromosome 4. Some of the regions with deviant allele frequencies have 3:1 allele ratios, which would be con-sistent with gene conversion, but most of the regions of allelic distortion are quite large, nearing 100 kb. Thus, it is unlikely that gene conversions alone explain the observed loss-of-heterozygosity genome-wide, as conversion tracks from gene conversions are thought to be small, on the order of only a few kilobases, as observed in S. cerevisiae (Mancera et al. 2008). Alternate models that could explain the observed al-lelic distortions include mitotic recombination that takes place after nuclear fusion but prior to meiosis, or chromo-somal mis-segregation that takes place during cell fusion prior to meiosis and the formation of a basidium, leading to loss of a parental genotype. Chromosomal breakage prior to meiosis followed by repair using the homologous chromo-some could also lead to a loss of one of the parental alleles (Sun et al. 2014). It is also possible that combinations of alleles between the progenitor strains 431a and XL280a could have led to the creation of nonviable genotypes, thus resulting in observed biased allele inheritance in the sampled spores.
Of the segregants from the a–a bisexual crosses, two groups are worth discussing in detail. Thefirst group is com-prised of four segregants from a single basidium. All four segregants were previously described as unique based on marker genotypes along chromosome 4 (Sun et al. 2014). However, genome-wide analysis revealed that two of the seg-regants are genetically identical except for chromosome 4 and are aneuploid for chromosome 10. For this set of seg-regants, the patterns of allele segregation could be explained by chromosomal nondisjunction. During the formation of the basidium and during meiosis, chromosomal nondisjunction could have produced three nuclei, two with the correct ploidy
of both chromosome 4 and 10 and one nucleus with two unique, recombinant copies of chromosome 4. Such patterns have been observed in hybrid crosses betweenC. neoformans andC. deneoformans(Voganet al.2013). During mitosis and basidiospore packaging, this aneuploid nucleus may have produced several copies of itself with varying arrangements of the genome, thus generating haplotypes that are geneti-cally identical except for chromosome 4, as seen in two of these segregants. Another basidium from the a–abisexual crosses that exhibited interesting patterns of allele segrega-tion was a collecsegrega-tion of eight segregants. Analysis of the haplotypes of these eight segregants indicates that all are genetically unique. In this instance, fusion between sister haploid nuclei could have taken place postmeiosis within the basidium, providing an opportunity for mitotic recom-bination to occur, and, through subsequent rounds of mito-sis, produce more than four unique gametes (Vogan et al. 2013). Due to the nature ofC. deneoformansand the meth-ods of dissection, it is almost impossible to determine if crossover events occur during meiosis or mitosis.
Our analyses provide evidence of different rates of recom-bination in unisexual and bisexual crosses. What are the molecular mechanisms that could drive such differences in recombination and how might they have evolved? A strong candidate is mating type-specific regulation of meiotic genes. For example, in the budding yeastS. cerevisiae, the meiotic inhibitor Rme1 is regulated in a mating type-specific manner; repression ofRME1by thea1/a2 complex is required for the initiation of meiosis, thus restricting meiosis only toa/a dip-loids (Covitzet al.1991; Covitz and Mitchell 1993). Similarly, mating type-specific regulation of DNA repair and mitotic recombination has been shown to occur in S. cerevisiae (Haber 2012). While there is no ortholog of Rme1 in Crypto-coccus, mating type-specific transcriptional regulators such as SXI1aandSXI2a(Hullet al.2005; Meadet al.2015) may directly or indirectly regulate genes that are critical for re-combination, such as DMC1 and SPO11(Lin et al. 2005), leading to higher or lower crossover rates during sexual reproduction.
Given that bisexual mating is the most parsimonious hy-pothesis for the ancestral mode of sexual reproduction for the Cryptococcus clade (Hsuehet al.2011; Heitman 2015), the evolutionary origin of unisexual reproduction inCryptococcus species likely required rewiring of the gene networks that regulate meiosis. A key first step would be mutations that allowed for the initiation of meiosis in genotypes other than a/a-diploids. Once this basic rewiring had occurred, addi-tional mating type-specific modifier mutations that induce quantitative effects on recombination rates or patterns of allelic inheritance could evolve, perhaps in a lineage-specific manner.
C. deneoformans, in the VNI and VNII lineages ofC. neoformans, most isolates are of theMATamating type (Kwon-Chung and Bennett 1978). Only in populations of the VNBI and VNBII lineages are MATastrains found with significant frequency (Litvintsevaet al.2003; Desjardinset al.2017). This has led to the hypothesis that sexual reproduction in manyC. neofor-manslineages may be primarily unisexual (Fuet al.2015). The differences in the rates of recombination we document here betweena–abisexual anda–aunisexual matings may contribute to differences in population recombination rates, even if a–a bisexual and a–a unisexual matings occur at similar frequencies. Consistent with this idea, the analysis of Desjardinset al.(2017) indicates that linkage disequilib-rium decays at a relatively similar rate in both VNB lineages (bisexual) and the VNI lineage (unisexual). However, the primarily unisexual VNI lineage shows an overall higher rate of linkage disequilibrium. New high-resolution genomic data, both from crosses and from population studies (Desjardins et al.2017; Rhodeset al.2017), will help to clarify the rela-tive contributions that sex, mitotic recombination (Vogan et al.2013), hypermutation (Billmyreet al.2017), and other mechanisms for generating genomic variation have on the origins and maintenance of genetic diversity within this clade of fungal pathogens.
Acknowledgments
We thank Debra Murray and Selcan Aydin for comments and feedback on the manuscript. This research was funded by a Research Training Grant from the University Program in Genetics and Genomics, Duke University, the Office of Biomedical Graduate Diversity’s Initiative for Maximizing Student Diversity program, BioCoRE, and National Institutes of Health grants R56 AI-123502, R01 AI-133654, and R37 AI-39115-20. The authors declare no conflicts of interest. Author contributions: S.S. and J.H. conceived and designed the experiments. S.S. performed the experiments C.R., R.B.B., and P.M.M. analyzed the data. S.S., R.B.B., and J.H. contributed reagents and materials. C.R. and P.M.M. wrote the paper. C.R., S.S., R.B.B., J.H., and P.M.M edited the paper.
Literature Cited
Ault, J. G., and R. B. Nicklas, 1989 Tension, microtubule re-arrangements, and the proper distribution of chromosomes in mitosis. Chromosoma 98: 33–39. https://doi.org/10.1007/ BF00293332
Bailey, T. L., and C. Elkan, 1994 Fitting a mixture model by ex-pectation maximization to discover motifs in biopolymers. Proc. Int. Conf. Intell. Syst. Mol. Biol. 2: 28–36.
Barton, A. B., M. R. Pekosz, R. S. Kurvathi, and D. B. Kaback, 2008 Meiotic recombination at the ends of chromosomes in
Saccharomyces cerevisiae. Genetics 179: 1221–1235. https:// doi.org/10.1534/genetics.107.083493
Benjamini, Y., and D. Yekutieli, 2001 The control of the false discovery rate in multiple testing under dependency. Ann. Stat. 29: 1165–1188.
Billmyre, R. B., S. A. Clancey, and J. Heitman, 2017 Natural mis-match repair mutations mediate phenotypic diversity and drug resistance inCryptococcus deuterogattii. Elife 6: e28802.https:// doi.org/10.7554/eLife.28802
Bui, T., X. Lin, R. Malik, J. Heitman, and D. Carter, 2008 Isolates ofCryptococcus neoformansfrom infected animals reveal genetic exchange in unisexual, a mating type populations. Eukaryot. Cell 7: 1771–1780.https://doi.org/10.1128/EC.00097-08
Campbell, L. T., B. J. Currie, M. Krockenberger, R. Malik, W. Meyer
et al., 2005 Clonality and recombination in genetically differ-entiated subgroups of Cryptococcus gattii. Eukaryot. Cell 4: 1403–1409.https://doi.org/10.1128/EC.4.8.1403-1409.2005
Cherry, J. M., C. Ball, S. Weng, G. Juvik, R. Schmidt et al., 1997 Genetic and physical maps ofSaccharomyces cerevisiae. Nature 387: 67.
Coelho, C., A. L. Bocca, and A. Casadevall, 2014 The tools for virulence ofCryptococcus neoformans. Adv. Appl. Microbiol. 87: 1–41.https://doi.org/10.1016/B978-0-12-800261-2.00001-3
Comeron, J. M., R. Ratnappan, and S. Bailin, 2012 The many landscapes of recombination inDrosophila melanogaster. PLoS Genet. 8: e1002905. https://doi.org/10.1371/journal.pgen. 1002905
Covitz, P. A., and A. P. Mitchell, 1993 Repression by the yeast meiotic inhibitor RME1. Genes Dev. 7: 1598–1608. https:// doi.org/10.1101/gad.7.8.1598
Covitz, P. A., I. Herskowitz, and A. P. Mitchell, 1991 The yeast RME1 gene encodes a putative zincfinger protein that is directly repressed by a1-a2. Genes Dev. 5: 1982–1989.https://doi.org/ 10.1101/gad.5.11.1982
Desjardins, C. A., C. Giamberardino, S. M. Sykes, C.-H. Yu, J. L. Tenoret al., 2017 Population genomics and the evolution of virulence in the fungal pathogen Cryptococcus neoformans. Genome Res. 27: 1207–1219. https://doi.org/10.1101/gr. 218727.116
Feretzaki, M., and J. Heitman, 2013 Genetic circuits that govern bisexual and unisexual reproduction in Cryptococcus neofor-mans. PLoS Genet. 9: e1003688. https://doi.org/10.1371/jour-nal.pgen.1003688
Forche, A., J. Xu, R. Vilgalys, and T. G. Mitchell, 2000 Development and characterization of a genetic linkage map ofCryptococcus neoformansvar.neoformansusing amplified fragment length polymorphisms and other markers. Fungal Genet. Biol. 31: 189–203. https://doi.org/10.1006/fgbi.2000. 1240
Fu, C., S. Sun, R. B. Billmyre, K. C. Roach, and J. Heitman, 2015 Unisexual vs. bisexual mating in Cryptococcus neofor-mans: consequences and biological impacts. Fungal Genet. Biol. 78: 65–75.https://doi.org/10.1016/j.fgb.2014.08.008
Gerton, J. L., J. DeRisi, R. Shroff, M. Lichten, P. O. Brown et al., 2000 Global mapping of meiotic recombination hotspots and coldspots in the yeastSaccharomyces cerevisiae. Proc. Natl. Acad. Sci. USA 97: 11383–11390. https://doi.org/10.1073/pnas.97. 21.11383
Giles, S. S., T. R. T. Dagenais, M. R. Botts, N. P. Keller, and C. M. Hull, 2009 Elucidating the pathogenesis of spores from the human fungal pathogen Cryptococcus neoformans. In-fect. Immun. 77: 3491–3500. https://doi.org/10.1128/IAI. 00334-09
Gyawali, R., Y. Zhao, J. Lin, Y. Fan, X. Xuet al., 2017 Pheromone independent unisexual development in Cryptococcus neofor-mans. PLoS Genet. 13: e1006772. https://doi.org/10.1371/ journal.pgen.1006772
Haber, J. E., 2012 Mating-type genes and MAT switching in Sac-charomyces cerevisiae. Genetics 191: 33–64. https://doi.org/ 10.1534/genetics.111.134577
Cryptococcus neoformans species complex. Fungal Genet. Biol. 78: 16–48.https://doi.org/10.1016/j.fgb.2015.02.009
Hagen, F., H. T. Lumbsch, V. Arsic Arsenijevic, H. Badali, S. Bertout
et al., 2017 Importance of resolving fungal nomenclature: the case of multiple pathogenic species in the Cryptococcusgenus. MSphere 2: e00238–e00217.https://doi.org/10.1128/mSphere. 00238-17
Heitman, J., 2015 Evolution of sexual reproduction: a view from the fungal kingdom supports an evolutionary epoch with sex before sexes. Fungal Biol. Rev. 29: 108–117. https://doi.org/ 10.1016/j.fbr.2015.08.002
Heitman, J., B. Allen, J. A. Alspaugh, and K. J. Kwon-Chung, 1999 On the origins of congenic MATaandMATa strains of the pathogenic yeast Cryptococcus neoformans. Fungal Genet. Biol. 28: 1–5.https://doi.org/10.1006/fgbi.1999.1155
Holm, S., 1979 A simple sequentially rejective multiple test pro-cedure. Scand. J. Stat. 6: 65–70.
Hsueh, Y.-P., A. Idnurm, and J. Heitman, 2006 Recombination hotspotsflank theCryptococcusmating-type locus: implications for the evolution of a fungal sex chromosome. PLoS Genet. 2: e184.https://doi.org/10.1371/journal.pgen.0020184
Hsueh, Y.-P., B. Metin, K. Findley, M. Rodriguez-Carres, and J. Heitman, 2011 The mating-type locus of cryptococcus: evo-lution of gene clusters governing sex determination and sexual reproduction from the phylogenomic perspective, pp. 139–149 inCryptococcus: From Human Pathogen to Model Yeast. American Society for Microbiology (ASM), Washington, DC.
Hull, C. M., R. C. Davidson, and J. Heitman, 2002 Cell identity and sexual development in Cryptococcus neoformans are con-trolled by the mating-type-specific homeodomain protein Sxi1a. Genes Dev. 16: 3046–3060.https://doi.org/10.1101/gad.1041402
Hull, C. M., M.-J. Boily, and J. Heitman, 2005 Sex-specific home-odomain proteins Sxi1aand Sxi2a coordinately regulate sexual development inCryptococcus neoformans. Eukaryot. Cell 4: 526– 535.https://doi.org/10.1128/EC.4.3.526-535.2005
Idnurm, A., 2010 A tetrad analysis of the basidiomycete fungus
Cryptococcus neoformans. Genetics 185: 153–163. https://doi. org/10.1534/genetics.109.113027
Idnurm, A., Y.-S. Bahn, K. Nielsen, X. Lin, J. A. Fraser et al., 2005 Deciphering the model pathogenic fungusCryptococcus neoformans. Nat. Rev. Microbiol. 3: 753–764.https://doi.org/ 10.1038/nrmicro1245
Janbon, G., K. L. Ormerod, D. Paulet, E. J. Byrnes, III, V. Yadav
et al., 2014 Analysis of the genome and transcriptome of Cryp-tococcus neoformansvar.grubiireveals complex RNA expression and microevolution leading to virulence attenuation. PLoS Genet. 10: e1004261. https://doi.org/10.1371/journal.pgen. 1004261
Kong, A., D. F. Gudbjartsson, J. Sainz, G. M. Jonsdottir, S. A. Gud-jonsson et al., 2002 A high-resolution recombination map of the human genome. Nat. Genet. 31: 241–247.https://doi.org/ 10.1038/ng917
Kwon-Chung, K. J., 1975 A new genus,Filobasidiella, the perfect state of Cryptococcus neoformans. Mycologia 67: 1197–1200.
https://doi.org/10.2307/3758842
Kwon-Chung, K. J., 1976 A new species ofFilobasidiella, the sex-ual state ofCryptococcus neoformansB and C serotypes. Myco-logia 68: 943–946.
Kwon-Chung, K. J., 1980 Nuclear genotypes of spore chains in
Filobasidiella neoformans(Cryptococcus neoformans). Mycologia 72: 418–422.https://doi.org/10.2307/3759266
Kwon-Chung, K. J., and J. E. Bennett, 1978 Distribution ofaand a mating types ofCryptococcus neoformansamong natural and clinical isolates. Am. J. Epidemiol. 108: 337–340. https://doi. org/10.1093/oxfordjournals.aje.a112628
Kwon-Chung, K. J., J. E. Bennett, B. L. Wickes, W. Meyer, C. A. Cuomoet al., 2017 The case for adopting the“species complex”
nomenclature for the etiologic agents of cryptococcosis. MSphere 2: e00357–e00316.https://doi.org/10.1128/mSphere.00357-16
Lengeler, K. B., D. S. Fox, J. A. Fraser, A. Allen, K. Forresteret al., 2002 Mating-type locus ofCryptococcus neoformans: a step in the evolution of sex chromosomes. Eukaryot. Cell 1: 704–718.
https://doi.org/10.1128/EC.1.5.704-718.2002
Li, H., 2011 A statistical framework for SNP calling, mutation discovery, association mapping and population genetical param-eter estimation from sequencing data. Bioinformatics 27: 2987– 2993.https://doi.org/10.1093/bioinformatics/btr509
Li, H., and R. Durbin, 2009 Fast and accurate short read align-ment with burrows-wheeler transform. Bioinformatics 25: 1754–1760. https://doi.org/10.1093/bioinformatics/ btp324
Lin, X., C. M. Hull, and J. Heitman, 2005 Sexual reproduction between partners of the same mating type inCryptococcus neo-formans. Nature 434: 1017–1021. https://doi.org/10.1038/na-ture03448
Lin, X., A. P. Litvintseva, K. Nielsen, S. Patel, A. Floyd et al., 2007 aADahybrids ofCryptococcus neoformans: evidence of same-sex mating in nature and hybrid fitness. PLoS Genet. 3: 1975–1990.https://doi.org/10.1371/journal.pgen.0030186
Lin, X., S. Patel, A. P. Litvintseva, A. Floyd, T. G. Mitchell et al., 2009 Diploids in theCryptococcus neoformansserotype A pop-ulation homozygous for theamating type originate via unisex-ual mating. PLoS Pathog. 5: e1000283.https://doi.org/10.1371/ journal.ppat.1000283
Litvintseva, A. P., R. E. Marra, K. Nielsen, J. Heitman, R. Vilgalys
et al., 2003 Evidence of sexual recombination among Crypto-coccus neoformans serotype A isolates in sub-Saharan Africa. Eukaryot. Cell 2: 1162–1168.https://doi.org/10.1128/EC.2.6. 1162-1168.2003
Loftus, B. J., E. Fung, P. Roncaglia, D. Rowley, P. Amedeo et al., 2005 The genome of the basidiomycetous yeast and human pathogen Cryptococcus neoformans. Science 307: 1321–1324.
https://doi.org/10.1126/science.1103773
Mancera, E., R. Bourgon, A. Brozzi, W. Huber, and L. M. Steinmetz, 2008 High-resolution mapping of meiotic crossovers and non-crossovers in yeast. Nature 454: 479–485. https://doi.org/ 10.1038/nature07135
Marra, R. E., J. C. Huang, E. Fung, K. Nielsen, J. Heitman et al., 2004 A genetic linkage map ofCryptococcus neoformans vari-etyneoformansserotype D (Filobasidiella neoformans). Genetics 167: 619–631.https://doi.org/10.1534/genetics.103.023408
Marsolier-Kergoat, M.-C., and E. Yeramian, 2009 GC content and recombination: reassessing the causal effects for the Saccharo-myces cerevisiaegenome. Genetics 183: 31–38.https://doi.org/ 10.1534/genetics.109.105049
McKenna, A., M. Hanna, E. Banks, A. Sivachenko, K. Cibulskiset al., 2010 The genome analysis toolkit: a MapReduce framework for analyzing next-generation DNA sequencing data. Genome Res. 20: 1297–1303.https://doi.org/10.1101/gr.107524.110
Mead, M. E., B. C. Stanton, E. K. Kruzel, and C. M. Hull, 2015 Targets of the sex inducer homeodomain proteins are required for fungal development and virulence inCryptococcus neoformans. Mol. Microbiol. 95: 804–818. https://doi.org/ 10.1111/mmi.12898
Nielsen, K., A. L. De Obaldia, and J. Heitman, 2007 Cryptococcus neoformans mates on pigeon guano: implications for the real-ized ecological niche and globalization. Eukaryot. Cell 6: 949– 959.https://doi.org/10.1128/EC.00097-07
Page, S. L., and R. S. Hawley, 2003 Chromosome choreography: the meiotic ballet. Science 301: 785–789. https://doi.org/ 10.1126/science.1086605
Rajasingham, R., R. M. Smith, B. J. Park, J. N. Jarvis, N. P. Govender
et al., 2017 Global burden of disease of HIV-associated cryp-tococcal meningitis: an updated analysis. Lancet Infect. Dis. 17: 873–881.https://doi.org/10.1016/S1473-3099(17)30243-8
Rhodes, J., C. A. Desjardins, S. M. Sykes, M. A. Beale, M. Vanhove
et al., 2017 Tracing genetic exchange and biogeography of
Cryptococcus neoformans var. grubii at the global population level. Genetics 207: 327–346. https://doi.org/10.1534/genet-ics.117.203836
Salomé, P., K. Bomblies, J. Fitz, R. Laitinen, N. Warthmannet al., 2012 The recombination landscape inArabidopsis thalianaF2 populations. Heredity 108: 447–455.https://doi.org/10.1038/ hdy.2011.95
Sun, S., and J. Heitman, 2016 Running hot and cold: recombina-tion around and within mating-type loci of fungi and other eu-karyotes, pp. 3–13 inEnvironmental and Microbial Relationships. The Mycota (A Comprehensive Treatise on Fungi as Experimental Systems for Basic and Applied Research), Vol. IV. Springer-Verlag, New York.https://doi.org/10.1007/978-3-319-29532-9_1
Sun, S., and J. Xu, 2007 Genetic analyses of a hybrid cross be-tween serotypes A and D strains of the human pathogenic fungus Cryptococcus neoformans. Genetics 177: 1475–1486.
https://doi.org/10.1534/genetics.107.078923
Sun, S., Y.-P. Hsueh, and J. Heitman, 2012 Gene conversion oc-curs within the mating-type locus of Cryptococcus neoformans
during sexual reproduction. PLoS Genet. 8: e1002810.
https://doi.org/10.1371/journal.pgen.1002810
Sun, S., R. B. Billmyre, P. A. Mieczkowski, and J. Heitman, 2014 Unisexual reproduction drives meiotic recombination and phenotypic and karyotypic plasticity inCryptococcus
neofor-mans. PLoS Genet. 10: e1004849. https://doi.org/10.1371/ journal.pgen.1004849
Sun, S., V. Yadav, R. B. Billmyre, C. A. Cuomo, M. Nowrousian
et al., 2017 Fungal genome and mating system transitions fa-cilitated by chromosomal translocations involving intercentro-meric recombination. PLoS Biol. 15: e2002527. https://doi. org/10.1371/journal.pbio.2002527
Thakur, J., and K. Sanyal, 2013 Efficient neocentromere forma-tion is suppressed by gene conversion to maintain centromere function at native physical chromosomal loci in Candida albi-cans. Genome Res. 23: 638–652. https://doi.org/10.1101/ gr.141614.112
Velagapudi, R., Y.-P. Hsueh, S. Geunes-Boyer, J. R. Wright, and J. Heitman, 2009 Spores as infectious propagules ofCryptococcus neoformans. Infect. Immun. 77: 4345–4355. https://doi.org/ 10.1128/IAI.00542-09
Vogan, A. A., J. Khankhet, and J. Xu, 2013 Evidence for mitotic recombination within the basidia of a hybrid cross of Cryptococ-cus neoformans. PLoS One 8: e62790.https://doi.org/10.1371/ journal.pone.0062790
Xue, C., Y. Tada, X. Dong, and J. Heitman, 2007 The human fungal pathogenCryptococcuscan complete its sexual cycle dur-ing a pathogenic association with plants. Cell Host Microbe 1: 263–273.https://doi.org/10.1016/j.chom.2007.05.005
Zhai, B., P. Zhu, D. Foyle, S. Upadhyay, A. Idnurm et al., 2013 Congenic strains of thefilamentous form ofCryptococcus neoformansfor studies of fungal morphogenesis and virulence. Infect. Immun. 81: 2626–2637.https://doi.org/10.1128/IAI.00259-13