996 IEEE Transactions on Power Systems, Vol. 12, No. 2, May 1997
~ e ~ ~ o ~ o l o g y
of
Urban Re-Development Considerations
in
Spatial Load
Forecasting
Mo-yuen Chow
IEEE Senior
MemberDepartment of Electrical and Computer Engineering North Carolina State University
Raleigh, NC 27695-79 1 1
A
bs trac t
Load forecasting in power systems is an important subject and has been studied from different points of view in order to achieve better load forecasting results. ”Ius paper will address one of the challenges in spatial load forecasting area - urban re-development, and present a theory and methodology to incorporate urban re-development into spatial load forecasting considerations.
K e y w o r d s
: Load forecasting, spatial load forecasting, urban re-development, land usage, system planning.1.
Introduction
1 . 1 . Importance of Current Status o f Distribution Spatial Load Forecasting
Load forecasting in power systems is an important subject and has been studied from different points of view in order to achieve better load forecasting results. Techniques such as regression analysis, expert systems, artificial neural networks and multi-objective evaluations have been used based on different choices of inputs and available information. Distribution system load forecasting has been a challenging problem due to its spatial diversity
and
sensitivities to land usage and customer habits. Different tools have been developed [ 1-31 to assist utilities to simulate and estimate the future land usage and load growth in their territory, so that distribution system planners can plan according to their goals and interests. Many factors need to be considered for this purpose. To name a few :1. What type of land usage will be in their temtory in the future?
2. What type of power consumption will be in their temtory?
3 . Should they build new feeden and substations or reinforce the existing ones?
4. Where should they plan the new lines and structures? Among different distribution load forecasting techniques, the one based on spatial distribution of land usage has yielded one of the best performances [4].
This paper was presented at the 1996 IEEE Transmission and
Distribution Conference held in Los Angeles, California,
September 15-20, 1996.
Hahn Tram
IEEE
Senior M e m b e rSystems Control
-
Automated Distribution ABB Power T&D Company Inc.Cary, NC 2751 1
Utility companies generally take advantages of distribution system load forecasting techniques for the company’s best interests, as in considering a piece of land that is speculated to be developed into a dense commercial site from a slump residential site. In this case, both the land and the power cohsumption of the land will increase significantly in a few years. A utility company with vision will acquire substation sites and right-of-ways which will allow substations to be built at a relatively low price
and
will place the substation close to the load center, in order to prepare for the future load growth as early as possible. The company can then earn high profits from the projected high power consumption.Of course, the early land purchasing policy involves risk takmg. For example, if the economy changes dynamics ad the commercial site is to be relocated, then the utility will need to adjust its plan to reduce such risks. The proposed method also supports such “multi-scenario planning” [I].
On the other extreme, some conservative utility companies will only react to customers’ requests to provide services. In these cases, utilities react (instead of proact) to ambient conditions and will install power distribution systems to their best interests, in addition to meeting the customers’ needs. This approach will, in many cases, put the utilities in bad situations because they are only reactive, thus creating a time lag from the growth of the economy,
ad
they will not only lose the opportunities for right-of-ways, but also lose financial advantages, such as land purchases for substation planning, in the competitive world. Let’s again consider a land site that is expected to be re-developed from a run-down residential area to a high power consumption commercial site. The land price will skyrocket within the next few years. If the utility company waits too long to buy the land to build substations, the land price may be so high that the utility company will lose profits providing power services to that site. In addition, there are many disadvantages in the pure reactive mode.1 . 2 . The Necessities to Include Urban R e - Development Considerations
Many of our cities are growing bigger and bigger. Due to various reasons, such as the scarcity of available vacant lands and economical considerations, many local governments try
to re-develop existing urban lands rather than to develop new lands. Downtown revitalization is one of the major slogans seen in many major U. S. cities. This phenomenon in
997
classes under consideration; (x, y) E
3t
N x x N y , where N x and N , are the number of sites under consideration in the x and y spatial coordinates, respectively.Let the composite mapping f = f l o f2 o f 3 be the mapping from site ( x , y ) to the system load S,
CJpxxN, >%'* (3)
Then the spatial load forecasting problem becomes finding out the inverse off, i.e., f =f<' of;' of;'. If we are able to find f?',
fr',
andfi',
then f-' can be uniquely determined. Apparently, this problem belongs to the set of under-determined mathematical problems. There exists an infinite number of solutions that can satisfy Eqn. (2) and f-'
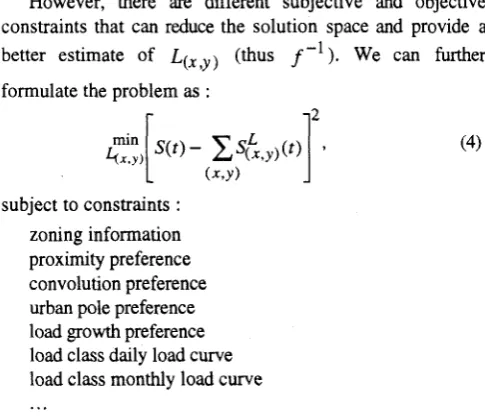
cannot be uniquely determined.However, there are different subjective and objective constraints that can reduce the solution space and provide a better estimate of L ( x , y ) (thus f-'). We can further general happen in many big cities around the world. To name
a few : the inner harbor in Baltimore, Philadelphia, Paris, Bangkok, etc. [ 5 ] .
There are certain rules and analytical approaches which can provide useful information and reasonable prediction on future city growth and land usage[5-61. Among the factors that need to be considered in order to achieve a good Urban Re-Development projection are :
government policies
0 transportation
-
roads, railroads, subways, train stations,city services
-
water systems, power systems,...
terrain-
slopes, plains, mountains,...
education
-
schools, universities, libraries, museums,...
recreation-
stadiums, parks,...
surrounding areas
-
trees, rivers, lakes, harbors,...
pollution
-
industrial sites, cars per area,...
...
0
0 0
0 crimerates
0
0 land values, property taxes
Most of the existing distribution spatial load forecasting techniques have already provided some of the answers for vacant land usage [ 7 ] . Yet they have not taken urban re- development into consideration. This paper will address one of the challenges in spatial load forecasting area
-
urban r e development, and present a theory and methodology to incorporate urban re-development into spatial load forecasting considerations.2.
Mathematical Formulation for Spatial Load
The overall spatial load forecasting problem and
Forecasting
computation can be represented as :
(x, Y> f 1
' k w )
A
' S k , , )
f3 3s9 (1)where fi maps different sites ( x , y ) to their land usage
4x,y)
and f2 maps the land usageL
to their power consumption S'.
In general, each land usage class has a corresponding load demand S&,y,-- based on customer- supplied daily and monthly load curves. The function f3maps the aggregated load at all ( x , y ) sites together to form the system load S(t) :
f 3 : ~ ( t ) = xS$,y)(r) = x S ( q x , , ) ( t ) ) , t = o,...,rn.(2)
( & Y ) ( & Y )
where S(r) is calculated by different long-term trend load forecasting programs (assumed to be known) and f is the time index in appropriate units such as years.
Mathematically speaking, S E
3
',
S(x,y, L and€ s N L where N L is the number of land usage
L(x .Y 1
subject to constraints : zoning information proximity preference convolution preference urban pole preference load gowth preference load class daily load curve load class monthly load curve
...
(4)
In general, even with user provided information, the spatial load forecasting is still a highly nonlinear, stochastic, large scale, spatial and time dependent problem. One way to solve this type of problems is to use multi-objective decision evaluation and preference maps [7,8].
2 . 1 . Load Aggregation Decomposition
998
MW
icLii=
year Y W Y e a r Fig. 1. Typical load curves for different land use class. If we'know the land usage at site ( x , y ) , based on the previous assumptions, then the load is known. Based on the number of different land usage sites that are known, we can compute the system load. Our problem can be further formulated as :
r
fUsers in general need to provide appropriate input information and assumptions. A calibration process is involved [ 7 ] .
3. Brief Description
ofMathematical Formulation
in Spatial Load Forecasting
Before discussing the urban re-development theory and methodology proposed in this paper, it is worthwhile to briefly review one of the techniques that is used in many spatial load forecasting programs : multi-objective decision evaluation [ 81.
Let N be the number of customer classes under consideration and J be the number of factors under consideration. Then :
where P is the Preference map, w,,, are the weighting factors, and
F,
is the j-th factor feature map (after feature extraction). 3 . I . Feature Extraction ProcessIn here, an example to create a location preference map is shown to illustrate the feature extraction process used in spatial load forecasting [7]. There are several stages in the feature extraction process. The first stage is the raw
data
itself, as shown in Figure 2.3 . 1 . 1 . Stage 1 : Raw Data
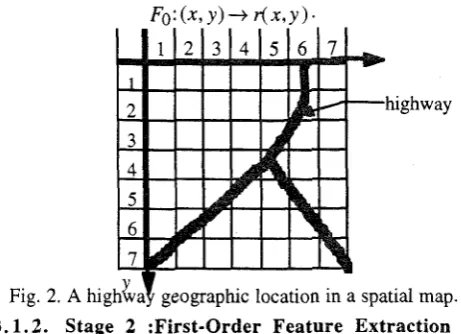
Assume the highway feature is j = 1, the residential class is n = 1, and the information in site (x% y) is r(x,y). If the highway passes through site (x,y), then r(x,y) = 1; otherwise r(x,y) = 0. We can denote this data collection process as F, :
highway
Fig. 2. A hgh&ay geographc location in a spatial map. 3 . 1 . 2 . Stage 2 :First-Order Feature Extraction
Let's deline E as the operator to transform the raw data
into the (Hamming) distance of the ( x , y ) location from the highway, which is a more meaningful piece of information used in a decision making process. Since only a one-step operation has been executed for this feature extraction process at this stage, we term t h s a jirst-order (one-step) feature
extraction. Next, the information in each site (x,y) is denoted by F,(x,y), and the process is denoted by the mapping : This mapping is based on more physical measurements and is termed objective mapping (versus subjective mapping, to be discussed in
F 1 : r ( x , y > + F l ( X , Y ) . (6)
-highway
Fig. 3. The distance from the highway spatial map. 3 . 1 . 3 . Stage 3 : Second-Order Feature Extraction
In some cases, the data after the first order feature extraction process may still lack enough or suitable information for decision making. That is when the secund- order (or two-step) feature extraction process is used. For
999
1
-
$ 0.8 e, 0.62 0.4
L 2
0.2
a
>
u
C
0
0 1 2 3 4 5 6
distance
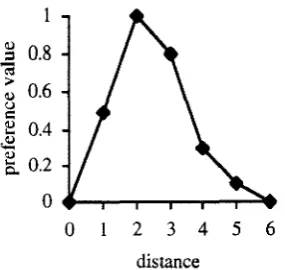
Fig. 4. Preference function of distance from highways. Let’s define F2 as the operator to transform F,(x,y) through the preference mapping shown in Figure
4
to the preference value that can be used directly for decision making :F2 :F1 ( ~ Y ) + 9 F ~ ( x , Y ) . (7)
Then the fe ature maD becomes X
*
-hi
Yt
Fig. 5. Preference of the distance from the hlghway spatial map.
In a loose way, we define
F
as a vector containing allF/
for j = 1,..,
J , where J is number of preference functions used.The preference map for land usage class n is then aggregated as a linear combination of the feature maps F, with weight factors W,. The overall problem is formulated nonlinearly because of the F, and F, operators involved.
4.
Urban Re-Development Land Usage Problem
Formulation
In this paper, we propose to use the concept of balance between land utilization U ( x , y ) (t ) and land value
V,,
,y) ( t ) at site ( x y ) and time t to predict future land usage.The estimate of land values rely on many different factors. To name a few :
Proximity to the city center
-
similar to Urban Pole concept-
is desirableSize of the city plays an important role in land values Proximity to trees, water, and parks
--
the general amenities of life--
add valuesProximity to hilly terrain increases land value
Pollution has a negative effect on the value of the surrounding land
--
industrial sites generally produce alot of pollution
Crime has a negative effect on the value of the surrounding land
The estimate of utilization value and land use value IS
based on users’ input.
4.1.1. Conceptual Approach
Let’s hypothetically create two maps, one to indicate the land value V(x , y ) (t ) and another to indicate land utilization
U ( x , y ) ( t ) at time t, as shown pictorially in Fig. 6 .
Y t
Yt
Estimated current Estimated current land value V(, ,y (t ) land utilization U ( x , y ) ( t )
Fig. 6. Estimated land and utilization values in a spatial map.
At site (x,y) and time t , if V(,,,)(t) =
U ( x , y )
( t ) , e.g. site (1,2) and site (2,3), then the land usage and land utilization is balanced. Everyone is happy and nothing needs to be changed. However, there could be a mismatch between V ( x , y ) ( t ) and U ( x , y ) ( t ) , e.g. site (1,3). This situation could cause a potential urban re-development. Let’s name the land utilization and land value relationship at site ( x , y ) and time t as the U-V relationship, represented as :q x , y) (t>
+E
(x, y) (t1
=V(
x y ) (t1
7 (8)where E ( x , y ) ( t ) is the mismatch between the U-V relationship. We will use
E ( x , y ) ( t )
as an indicator to estimate the possibility of urban re-development. Let’s defineq x Y )
( t ) as a threshold for urban re-development at site (x,y) at time t such that :if E ( x , y ) W
’
q x y , ( t ) at time t*, thenc(x,y)
( t * )rc*
9where C*is the set containing all sites (x,y) to be considered for changing state (or land usage). After appropriate calculation, C(x,y, (t ) will change its state at t = t *
+
Af
*
where At* is the development time to change C ( x , y )( r )
from one class (state) to another class (state). Aassume that all U , V, and T have the same units so we can compare them. The method to perform the mapping will be investigated in the future.
A
9' I
Fig. 7. Conceptual figure of load growth of Urban Re- Development.
4 . 1 . 2 . Technical Considerations
Among the technical considerations that need to be investigated in the posted urban re-development problem are :
0 How to estimate I ! J ( ~ , ~ ) ( t ) ?
e How to estimate V(,,,)(t)?
0 How to estimate
q x y ,
( t ) ?All the estimates rely on different factors and information such as economy, geography, and current land usage patterns. In spatial load forecasting simulation, this task is left to users to determine how they input these values because they are the ones who know their environment most [9].
4.2.
Implications
ofE ( x , y )
(t )If E ( x , y l ( t ) is negative or stays constant, then the utilization of the land is higher than its value. The land value will be regulated by the economy and will increase its value to balance the difference between the
U
and V.Another scenario is that there is a negative land utilization growth (in here, we assume load growth is proportional to utilization of the land, ignoring factors such as the effects between power load growth and land utilization of energy efficient due to over-building or decay in that area.
Both cases will arrive to a stable equilibrium. Therefore, the overall system is stable as far as urban re-development is concerned and we do not need to consider these cases.
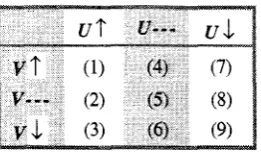
If ( t ) is positive, there are a few possible scenarios as shown in Table 1. The
? ,
--, and1
symbols in Table 1 denote increase, zero and decrease growth rate respectively.In case 1, the increase rate of V is greater or equal to the increase rate of U , these are stable situations
and
do not need to be considered urban re-development.Table 1. Possible scenarios when .E(x,y) (t ) is positive. When the increase rate of V is less than the increase rate of U , this is an unstable situation. One of the examples is that the location is over-built or over-developed. This situation will eventually lead to negative growth in the area
The nature of economy will regulate this scenario. Therefore, from the urban re-development point of view, we do not need to consider thls case either.
Cases (2) - (6) are all irrelevant to urban re-development
either the land value and utilization value growth are stable, or the negative growth in utilization will regulate the situation.
Cases (7)
-
(9) will create unstable situations in term of land and utilization value growth and will need urban re development at some point in time.5.
Relationship between Land Usage, Load
Growth, and Distribution System Planning
One of the concerns in urban re-development spatial load forecasting is to first convert land usage to load growth, then to distribution planning. Distribution planning can be directly used by utilities. Much of the conversion mechanism is already available in Merent commercial spatial load forecasting software packages.
Let's denote S ( x , y ) ( t > =
p(x,y)
( t > ,Q(x,y)(df
tobe
the (real and reactive) power consumption at site (x, y) at time t . We want to explicitly put S in the urban re development formulation because S is the value that the utilities' T&D system must meet.Let's revisit the land usage example used in Figure 6 and focus on the land development of the sites with the marked values. The land usage of the sites with non-zero values will keep the inputted values. The load curve will be forecasted based only on the initial settings (of course, unless the user manually overrides the land usage of the site).
For sites (1,2) and (2,3), the U-V relationship is balanced, therefore no action needs to be taken. For sites (2,4), (3,2), (3,3), (3,4), (4,2), and (4,3), the land utilization is higher than the land value. All the sites will experience negative utilization growth or the land values will increase to balance the unbalanced situation (Adam Smith, 18th century
-
The market is self-reguluring). Sites (1,4),(2,1), and (4,4) are the sites urban re-development needs to consider and are included in set C*.1001
[9] Mo-yuen Chow,’Hahn
Tram,
“Application of Urban Re- Development Methodology in SpatialLoad
Forecasting,” submitted to Power T&D conference, 1996.ambiguity of the equal sign in E and T described previously)
for all sites
at
all times. Then only site (4,4)c
C*
willt
x
investigated to determine the state that the site will change into. No action needs to be taken for sites (1,4) and (2,2). However, if the threshold value is 1.5, then site (1,4) cc*
and it will need to be considered too. At this moment, assume C* = {(4,4)) only.
6. Conclusion
This paper presents a theory and methodology to incorporate Urban Re-Development considerations into distribution spatial load forecasting. In the companion paper of this article [9], we will demonstrate the urban re development methodology and theory on a distribution system, showing on how a new highway construction will affect the land usage in the surrounding areas, and the corresponding power system design.
Acknowledgment
The authors of ths paper would like to acknowledge Mr. Lee Willis for his valuable suggestions on urban re- development issues.
Reference
[l] H. Lee Willis, Hahn Tram, “Distribution Load Forecasting,” JEEE Tutorial on Power Distribution Planning, EH0361-6-PWR, 1992.
[2] Hesham K. Temraz, Victor H. Quintana, “Analytic spatial electric load forecasting methods : a survey,” Canada Joumal of Electrical and Computer Engineering, [3] H. Lee Willis, J.E.D. Northcote-Green, “Comparison Tests of Fourteen Distribution
Load
Forecasting Methods,” IEEE Transactions on Power Apparatus and Systems, Vol. PAS-103, No. 6, June 1984, pp. 1190-1197.
[4] H.L. Willis, H.N. Tram, G.B. Rackliffe, “Short-Range Load Forecasting for Distribution System Planning
-
An Improved Method for Extrapolating Feeder Load Growth,” IEEE Transactions on Power Systems, Vol. 7, [5] Yilmaz Gurer, Urban Land Market-
Policies for them,
OECD 1992.[6] Jeff R. Wright, Lyna L.Wiggins, Ravinder K. Jain, T. John Kim, ExDert Svstems in Environmental Planning, Springer-Verlag, 1993.
[7] H. Lee Willis, Michael V. Engel, Michael J. Buri, “Spatial Load Forecasting,” IEEE Computer Applications in Power, April 1995, pp.40-43.
[SI V. Chankong, Y.Y. Haimes, Multiobiective Decision 1983.
Vol. 17, NO. 1, 1992, pp. 24-42.
NO. 3, August 1992, pp.1306-1312.
Making : Theory and Methodology , North-Holhd,
Biography
Mo-yuen Chow
Mo-yuen Chow earned h s B.S.
degree at the University of Wisconsin-Madison (1982); M. Eng. degree (1983) and Ph.D. degrees at Come11 University (1987), all in Electrical Engineering. Upon completion of his Ph.D., Dr. Chow joined the faculty of North Carolina State University in Raleigh, NC, where he is presently an Associate Professor in the Department of Electrical and Computer Engineering. Dr. Chow has also worked as a consultant for Taiwan Power Company, J.W. Harley Company, and as a faculty intern at Duke Power Company.
Since 1987, Dr. Chow has been working as a Principal Investigator in several projects in the areas of system monitoring, fault detection and control, applications of artificial neural network and fuzzy logic to power engineering. Dr. Chow served as a guest editor of IEEE Transactions on Industrial Electronics Special Issue on Application of Intelligent Systems to Industrial Electronics. He is currently an Associate Editor of the IEEE Transactions on Industrial Electronics. He is also listed in Who‘s Who in Asian Americans.