Department of Civil Engineering, North Eastern Regional Institute of Science and Technology, Nirjuli, Itanagar, Arunachal Pradesh, India.
Structural behaviour of flat oval LDSS stub column
under pure axial compression
Khwairakpam Sachidananda1, Konjengbam Darunkumar Singh2
PhD Scholar, Indian Institute of Technology Guwahati, India1
Associate Professor, Indian Institute of Technology Guwahati, India2
Abstract: This paper presents numerical modelling of LDSS (Lean Duplex Stainless Steel) Class 3 flat oval hollow section columns under pure axial compression using the commercial finite element software, Abaqus (2010). A parametric study has been carried out to assess the effects of thickness and flat length on the load and deformation capacity of flat oval stub columns. The columns with longer flat length have more column strength than that of column with shorter flat length. The percentage increase in strength along with the increase in area is more in case of increase in thickness than the column with increase in flat length. The deformation capacity of the flat oval column reduces as the flat length of the column increases in the cross-section. The current code of EN 1993-1-4 (2006) can be used for the prediction of compact LDSS flat oval column.
Keywords: Flat-oval column, Hollow stub column, Finite element analysis
I. INTRODUCTION
Cold formed stainless steel are becoming popular in the construction industry due to its numerous advantages e.g. high corrosive resistance, ductility, aesthetic appearance, high strength, smooth and uniform surfaces etc. In earlier times, austenitic variety with nickel content of ~8% -11% was the most popular type of stainless steel, however with ever increasing price of nickel, there has been an increasing effort to cut down the proportion of nickel, and this led to the introduction of a new class of stainless steel known as Lean Duplex Stainless Steel (LDSS). LDSS such as grade EN 1.4162 in particular, has a low nickel
Department of Civil Engineering, North Eastern Regional Institute of Science and Technology, Nirjuli, Itanagar, Arunachal Pradesh, India.
systematically study both the load and deformation capacities of fixed ended flat oval hollow column made of Lean Duplex Stainless Steel under the action of pure compression, using the commercial Finite Element (FE) software, Abaqus (2010). Results from the FE parametric study are then compared with European code (EN 1993-1-4, 2006) to check code’s applicability for flat oval sections.
II. FINITE ELEMENT MODEL
In the present FE study, fixed ended FOHS (flat oval hollow section) column under pure axial compression is considered. Typical cross-section, FE mesh, boundary conditions are presented schematically in Figs. 1 and 2. As shown in Fig. 1, for the present study, radius and width of the section have been kept constant (r = 150 mm; w = 300 mm), so that parametric study can be done to see the effects of flat length (l) and thickness (t). Length of the column (L) has been kept as 900 mm so as to consider only the stub columns. The FE modelling approach followed the similar pattern as as those reported by Theofanous and Gardner (2009), Patton and Singh (2012), Ashraf et al. (2006), Gardner and Ministro (2004). The bottom part is fixed while allowing the top loaded part of the column as in Fig. 2. Reference points (RP1 and RP2) are provided to define the boundary conditions of the column. The column ends are constraints through kinematic coupling available in Abaqus (2010). Except for vertical translation all degree of freedom were restrained at the loaded end.
Fig.1. Schematic diagram of Flat Oval Hollow Section (FOHS)
(a) (b)
Fig. 2. Typical (a) FE mesh and (b) boudary conditions of LDSS FOHS column.
Table 1. Stub column dimensions (Theofanous and Gardner, 2009).
Specimen L (mm)
B (mm)
H (mm)
t (mm)
ri
(mm)
80x80x4-SC2 332.2 80 80 3.81 3.6
Four-noded doubly curved shell (S4R) elements with reduced integration having six degree of freedom per node have been used to discretize the models. Typical mesh size is of the dimension 11.5 mm x 11.5 mm with an aspect ratio of 1 was arrived at after mesh convergence study. The linear eigen value analyses were performed to find the buckling mode shapes of the column. The lowest eigen value was utilized as initial geometric imperfection to perturb the geometry of the column. The scaling of the imperfection amplitude is taken as 1% plate thickness as recommended in the literature (e.g. Theofanous and Gardner, 2009, Chan and Gardner, 2008).
t
r
= 150 mmw
mm
= 300 mmS4R elements
Reference point (RP1)
L
l
Department of Civil Engineering, North Eastern Regional Institute of Science and Technology, Nirjuli, Itanagar, Arunachal Pradesh, India.
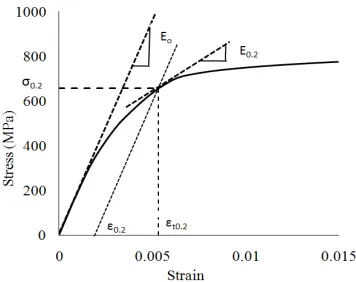
Fig. 3. Experimental stress-strain curve of LDSS material Grade EN 1.4162 (Theofanous & Gardner 2009).
The FE modeling approach has been validated with an experimental LDSS square hollow column-80x80x4-SC2 by Theofanous and Gardner (2009). The geometric details of the validated square LDSS column-80x80x4-SC2 is given in Table 1. Table 2 shows the material properties suggested by Gardner and Ashraf (2006) (modified version of original Ramberg–Osgood, 1943) which is used in deriving the stress-strain curve of LDSS material for the present models. Poisson’s ratio is taken as 0.3. The LDSS
stress (σ) – strain (ε) curve (Fig. 3), consists of two material models of Ramberg-osgood (1943) upto 0.2% proof stress (σ0.2) and Gardner and Ashraf (2006) from
σ0.2 to σ1.0.
Table 2. Compressive flat material properties (Theofanous and Gardner, 2009).
Cross-section E (Mpa)
σ0.2
(Mpa)
σ1.0
(Mpa)
Compound R-O
coefficients
n
80x80x4-SC2 197200 657 770 4.7 2.6
The strength enhancement in the corner regions by cold forming-process is neglected. The residual stresses is also neglected in the model as it has negligible effect on the ultimate load and load shortening behavior (Ellobody and Young, 2005). The material model shown in Fig. 3 is used as input parameters to Abaqus (2010), by converting into
true stress (σtrue) and true plastic strains
truepl using thefollowing Eqs. 1 and 2.
)
1
(
nomnom
true
(1)o true nom
true pl
E
ln(1 ) (2)
where nom and nom are engineering stress and strain
respectively.
The variation of load-axial displacement of the experimental of Theofanous and Gardner (2009) and FE results of stub column has been plotted in Fig.4. A good agreement can be seen between the present FE and experimental results, thus validating the FE modeling approach. Similar FE modeling approach is then employed in the subsequent modeling of flat oval hollow columns.
Fig. 4. Variation of P (load) vs δ (axial displacement) for
stub column ( SHC 80 x 80 x 4-SC2 ).
III. STUDY OF LDSS FLAT OVAL
HOLLOW COLUMN
A total of 25 FE models of flat oval column have been analysed by varying the flat length (l = 300 to 700 mm ) and thickness ( t = 10 to 20 mm). The specimens are labeled with complete details of its cross-section like L300W300R150T10 where L300 refer to flat length (l)of
0
200
400
600
800
1000
1200
0
1
2
3
4
5
6
7
P
(kN
)
δ
(mm)
Exp (80x80x4-SC2 ) Theofanous and Gardner FE-(80x80x4-SC2) with imperfection t/100
Ultimate load (Pu)
Department of Civil Engineering, North Eastern Regional Institute of Science and Technology, Nirjuli, Itanagar, Arunachal Pradesh, India.
300 mm, W300 refer to width (w)between the flat plates as 300 mm, R150 refer to radius (r)of curvature as 150 mm and T10 refer to thickness (t) of plate as 10 mm. The results of the FE analyses have been presented in the form of load and deformation capacities. It may be noted that the current European code, EN 1993-1-4 (2006) is not very specific on the design provision of hollow sections consisting of both flat and curve portions. Hence, the proposal by Zhu and Young (2011, 2012) to consider curved portion of the section to be fully effective (i.e. gross area of the curved section is considered for load calculation) whilst effective area has been considered for the flat portions as per the provisions of the code. For the range of thicknesses considered in the present study, all the sections falls under Class 3 as per EN 1993-1-4(2006).
(a)
(b)
Fig.5. Variation of a) P vs δ and b) P/Agfy vs δ for
L300W300R150
(a)
(b)
Fig.6. Variation of a) P vs δ and b) P/Agfy vs δ for
L700W300R150
0
5000
10000
15000
20000
25000
0
5
10
15
P
(kN
)
δ
(mm)
t = 10.0 mm t = 12.5 mm t = 15.0 mm t = 17.5 mm t = 20.0 mm
0.00
0.20
0.40
0.60
0.80
1.00
1.20
1.40
0 5 10 15
P
/
A
gf
yδ
(mm)
t = 10.0 mm t = 12.5 mm t = 15.0 mm t = 17.5 mm t = 20.0 mm
0
5000
10000
15000
20000
25000
30000
0 5 10 15
P
(kN
)
δ
(mm)
t = 10.0 mm t = 12.5 mm t = 15.0 mm t = 17.5 mm t = 20.0 mm
0.00
0.20
0.40
0.60
0.80
1.00
1.20
1.40
0
5
10
15
P
/
A
g
f
yδ
(mm)
Department of Civil Engineering, North Eastern Regional Institute of Science and Technology, Nirjuli, Itanagar, Arunachal Pradesh, India.
Fig.7. Oval W300R150 showing variation of Pu vs l and
Fig. 8. Variation of % deformation at Pu vs l for
W300R150
(a)
(b)
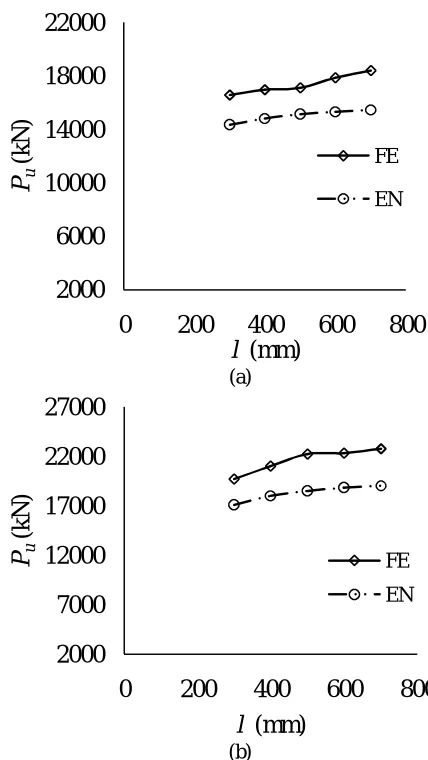
Fig. 9. Variation of Pu vs l (mm) for thickness (a) t = 15
mm and (b) t = 17.5 mm, for W300R150
IV. RESULTS AND DISCUSSION
The P (load) vs δ (axial displacement) and normalized
P/Agfy vs δ (Ag = gross cross sectional area, fy = yield
stress) for the shorter (l = 300 mm) and longer flat length (l = 700 mm) have been shown in Fig. 5 and 6. In Fig 5(a) and 6(a) it is shown that with the increase of thickness the load carrying capacity (or ultimate load, Pu) of column
increases. From Figs. 5b and 6b, it can be seen that for longer flat length, buckling takes place before reaching the
0
5000
10000
15000
20000
25000
30000
0
200 400 600 800
P
u(kN
)
l
(mm)
t=10.0 mm
t=12.5 mm
t=15.0 mm
t=17.5 mm
t=20.0 mm
0.00
0.20
0.40
0.60
0.80
1.00
0
500
1000
%
de
fo
rm
at
io
n
a
t
P
ul
(mm)
t=15.0 mm t=17.5 mm t=20.0 mm
2000
6000
10000
14000
18000
22000
0
200
400
600
800
P
u(kN
)
l
(mm)
FE
EN
2000
7000
12000
17000
22000
27000
0
200
400
600
800
P
u(kN
)
l
(mm)
FE
Department of Civil Engineering, North Eastern Regional Institute of Science and Technology, Nirjuli, Itanagar, Arunachal Pradesh, India.
global yield load (i.e. Agfy) for all the thicknesses
considered, however, at lower flat length such phenomena occurs only at lower thickness (t ≤ 12.5 mm). This may be related to the increased in cross-sectional slenderness at longer flat length. In the case of shorter flat length with increased thickness (t ≥ 12.5 mm), the sections becomes
stocky and buckling takes place beyond the global yield load. The effect of flat length on the load carrying capacity has been plotted in Fig. 7 in the form of Pu vs l for all the
thicknesses. It can be seen from Fig. 7 that the rate of increase of Pu with l is ~ 20% for 133.3 % increase in l
from 300. In order to assess the effect of increase in cross-sectional area on the ultimate load carrying capacity, increase in strength per unit increase in cross sectional area have been calculated and presented in Table 3. It can be seen from Table 3 that increase in strength per unit increase in cross-sectional area are 0.45 and 0.31 at t = 10 mm and t = 20 mm respectively, when only l is increased from 300 mm to 700 mm, whereas it is 1.75 and 1.58 respectively for l = 300 and l = 700 mm, when only thickness is increased (from t = 10 mm to t = 20 mm). Thus it can be observed that increased in thickness is much more effective in increasing the ultimate load, as compared to increasing the flat length for Class 3 sections. Table 3. Comparison of increase in strength with respect to increase in c/s area
Increasing c/s area by increasing flat length
% increas e in Pu
%
increase in c/s area
Increase in strength per unit increase in area L300W300R150T10
to
L700W300R150T10
23.57 52.94 0.45
L300W300R150T20 to
L700W300R150T20
16.88 54.06 0.31
b) Increasing c/s area by increasing thickness
% increas e in Pu
%
increase in c/s area
Increase in strength per unit increase in area L300W300R150T10 168.08 95.84 1.75
to
L300W300R150T20 L700W300R150T10 to
L700W300R150T20
153.58 97.28 1.58
Fig. 8 shows the variation of % deformation (= δu / L x
100%) at Pu with l. It can be seen from Fig. 8 that there is
a drop in the % deformation at Pu (1% to 0.6%) when l is
increased from 300 to 500 mm, and remains approximately stable, for l ≥ 500 mm. This may be
associated with the increase in load carrying capacity of shorter flat lengths (wherein Pu occurs after crossing the
global yield load), where deformation at Pu would be
controlled more by yielding than the buckling (shorter flat
length producing more δu). However, for longer length (l
≥ 500 mm), it may be the case where elastic buckling (Pu/Agfy ≤ 1.0)has more control on δu, thereby the effect
of length on δu is not that significant, and hence stable (see
Fig. 6). Figs. 9(a) and (b) show the comparison between the FE and EN 1993-1-4(2006) results for t = 15 and 17.5 mm in terms of Pu vs l. It can be seen that predictions from
EN 1993-1-4(2006) are conservative in comparison to the FE results.
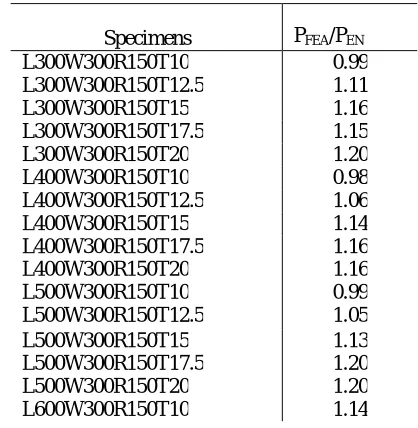
Table 4. Comparison of FEA with EN 1993-1-4 (2006) for r =150 mm and varying l (flat length) and thickness of oval cross-section.
Specimens PFEA/PEN
Department of Civil Engineering, North Eastern Regional Institute of Science and Technology, Nirjuli, Itanagar, Arunachal Pradesh, India.
L600W300R150T12.5 1.17 L600W300R150T15 1.16 L600W300R150T17.5 1.19 L600W300R150T20 1.19 L700W300R150T10 1.18 L700W300R150T12.5 1.21 L700W300R150T15 1.19 L700W300R150T17.5 1.19 L700W300R150T20 1.19 Total Nos. 25
Mean 1.14
COV 0.06
Reliability index,
2.87The comparison between column strength of FE (PFEA)and
EN 1993-1-4(2006) (PEN) is shown in Table 4. Table 4
shows a total of 25 models with mean value of 1.14, coefficient of variance of 0.06. The reliability analysis has been performed based on the NAS specification (2007) for cold formed steel structures. In the reliability analysis, a resistance factor of 0.91, along with dead load to live load
ratio of 0.2. The reliability index (β) is obtained as 2.87, which is greater than the target value of 2.5, suggesting that the current EN 1993-1-4(2006) can be used for the design of Class 3 flat oval LDSS hollow stub sections.
V. CONCLUSION
This paper presents the structural behavior of flat oval LDSS column for various flat lengths and thicknesses (keeping both the radius and width same) of the cross-section using the commercial FE software Abaqus (2010). Based on the study following conclusions are drawn as follows:
1) The columns with longer flat length has more column strength than that of column with shorter flat length. 2) The percentage increase in strength along with the increase in area is more in case of increase in thickness than the column with increase in flat length.
3) The deformation capacity of the oval column reduces as the flat length of the column increases in the cross-section, for shorter flat length columns.
4) The current code of EN 1993-1-4 (2006) can be used for the prediction of compact LDSS flat oval column.
REFERENCES
1) Ashraf M., Gardner L., Nethercot D.A. (2006). Finite element modelling of structural stainless steel cross-sections. Thin-Walled Structures. 44:10, 1048-1062.
2) Abaqus, Version 6.9-EF1. (2010). Simulia, Providence, RI, USA. 3) American Iron and Steel Institute (AISI) S100. (2007). North American Specification (NAS) for the Design of Cold-formed Steel Structural members.
4) Chan, T.M. (2007). Structural behavior of elliptical hollow sections. PhD thesis, Imperical College London.
5) Chan T.M., Gardner L. (2008). Compressive resistance of hot-rolled elliptical hollow sections. Engineering Structures. 30:2, 522–532. 6) EN 1993-1-4. Eurocode 3 (2006): Design of steel structures-Part 1.4: General rules-Supplementary rules for stainless steel. CEN.
7) EN 10088-4. Stainless steels part 4 (2009): Technical delivery conditions for sheet/plate and strip of corrosion resisting steels for general purposes. CEN.
8) Ellobody E. and Young B. (2005). Structural performance of cold-formed high strength stainless steel columns. Journal of Constructional Steel Research. 61:12, 1631-49.
9) Feinstein, G., Chen, Y.N. and Kempner, J. (1971a). Buckling of clamped oval cylindrical shells under axial loads. AIAA Journal, 9, 1733-1738.
10)Feinstein, G., Erickson, B. and Kempner, J. (1971b). Stability of oval cylindrical shells. Experimental Mechanics, 11, 514-520.
11)Gardner L.(2005). The use of stainless steel in structures. Progress in Structural Engineering and Materials. 7:2, 45–55.
12)Gardner L., Ashraf M. (2006). Structural design for non-linear metallic materials. Engineering Structures 28:925-36.
13)Gardner L., Chan T.M. (2007). Cross section classification of elliptical hollow sections. Steel and Composite Structures. 7:3, 185-200. 14)Gardner L., Ministro, A. (2004). Testing and numerical modelling of structural steel oval hollow sections, 04-002-ST, London, Department of civil and environmental engineering, Imperial college.
15)Hutchinson, J.W. (1968). Buckling and initial postbuckling behavior of oval cylindrical shells under axial compression. Journal of Applied Mechanics , 35, 66-72.
16) Kempner, J. (1962). Some results on buckling and post buckling of cylindrical shells. Collected papers on instability of shell structures. NASA TN D, 1510, 173-186.
17) Kempner, J. and Chen, Y.N. (1966). Buckling and post buckling of an axially compressed oval cylindrical shell. PIBAL report, 917, Department o Aerospace Engineering and Applied Mechanics, Polytechnic Institute of Brooklyn.
18) Margueerre, K. (1951). Stability of the cylindrical shell of variable curvature. NACA Technical Memorandim, 1302.
19) Patton M.L., Singh K.D. (2012). Numerical modelling of lean duplex stainless steel hollow columns of square, L-,T-,and +-shaped cross sections under pure axial compression. Thin-Walled Structures. 53, 1-8.
20) Ramberg W., Osgood W.R. (1943). Description of stress-strain curves by three parameters. Technical note No 902, Washington, DC: National advisory committee for aeronautics.
Department of Civil Engineering, North Eastern Regional Institute of Science and Technology, Nirjuli, Itanagar, Arunachal Pradesh, India.
22) Theofanous M., Chan T.M., Gardner L. (2009). Structural response of stainless steel oval hollow section compression members. Engineering Structures. 31:4,922-934.
23) Zhu J., Young B. (2011). Cold-formed-steel oval hollow sections under axial compression. Journal of Structural Engineering. 137:7, 719-727.